Environmental Monitoring and Audit Report
for
Contract No. ED/2018/01 –
Kai Tak Development – Stage 4 infrastructure at the former runway and south apron
Contract No.: EDO 15/2018
October 2020
(Version 1.2)

Environmental Monitoring and Audit Report
for
Contract No. ED/2018/01 –
Kai Tak Development – Stage 4 infrastructure at the former runway and south apron
Contract No.: EDO 15/2018
October 2020
(Version 1.2)
Table of Content
Breaches of Action and Limit Levels
Notifications of summons and successful prosecutions
Key construction works in the reporting month
Works Area and Construction Programme
Construction works undertaken during reporting month
Submission Status under the Environmental Permits
Monitoring Parameters, Frequency and Duration
Monitoring Methodology and QA/QC Procedure
Impact Air Quality Monitoring results
Monitoring Parameters, Frequency and Duration
Monitoring Methodology and QA/QC Procedure
Impact Noise Monitoring results
4. COMPARISON OF EM&A RESULTS WITH EIA PREDICTIONS
5. LANDSCAPE AND VISUAL MONITORING
6. ENVIRONMENTAL SITE INSPECTION AND AUDIT
Status of Environmental Licenses, Notification and Permits
Implementation Status of Environmental Mitigation Measures
Environmental Complaint and Non-compliance
Notifications of summons and successful prosecutions
Construction Programme in the coming month
Environmental Site Inspection and Monitoring Schedule for next month
List of Tables
Table I Non-compliance Record in the Reporting Month
Table II Summary of complaints in the Reporting Month
Table III Summary of summons and successful prosecutions in the Reporting Month
Table IV Summary of future key issues and potential impact in the coming month
Table 1.1 Contact Information of Key Personnel
Table 1.2 Major activities of the Project during reporting month
Table 1.3 Summary of Status of Required Submission of EPs
Table 2.1 Locations of Air Quality Monitoring Stations
Table 2.2 Air Quality Monitoring Parameters, Frequency and Duration
Table 2.3 Air Quality Monitoring Equipment
Table 2.4 Action and Limit Levels of 24-hour average TSP for Construction Dust Monitoring
Table 2.5 Action and Limit Levels of 1-hour average TSP for Construction Dust Monitoring
Table 2.6 Summary of 24-hour average TSP Monitoring Data during the reporting month
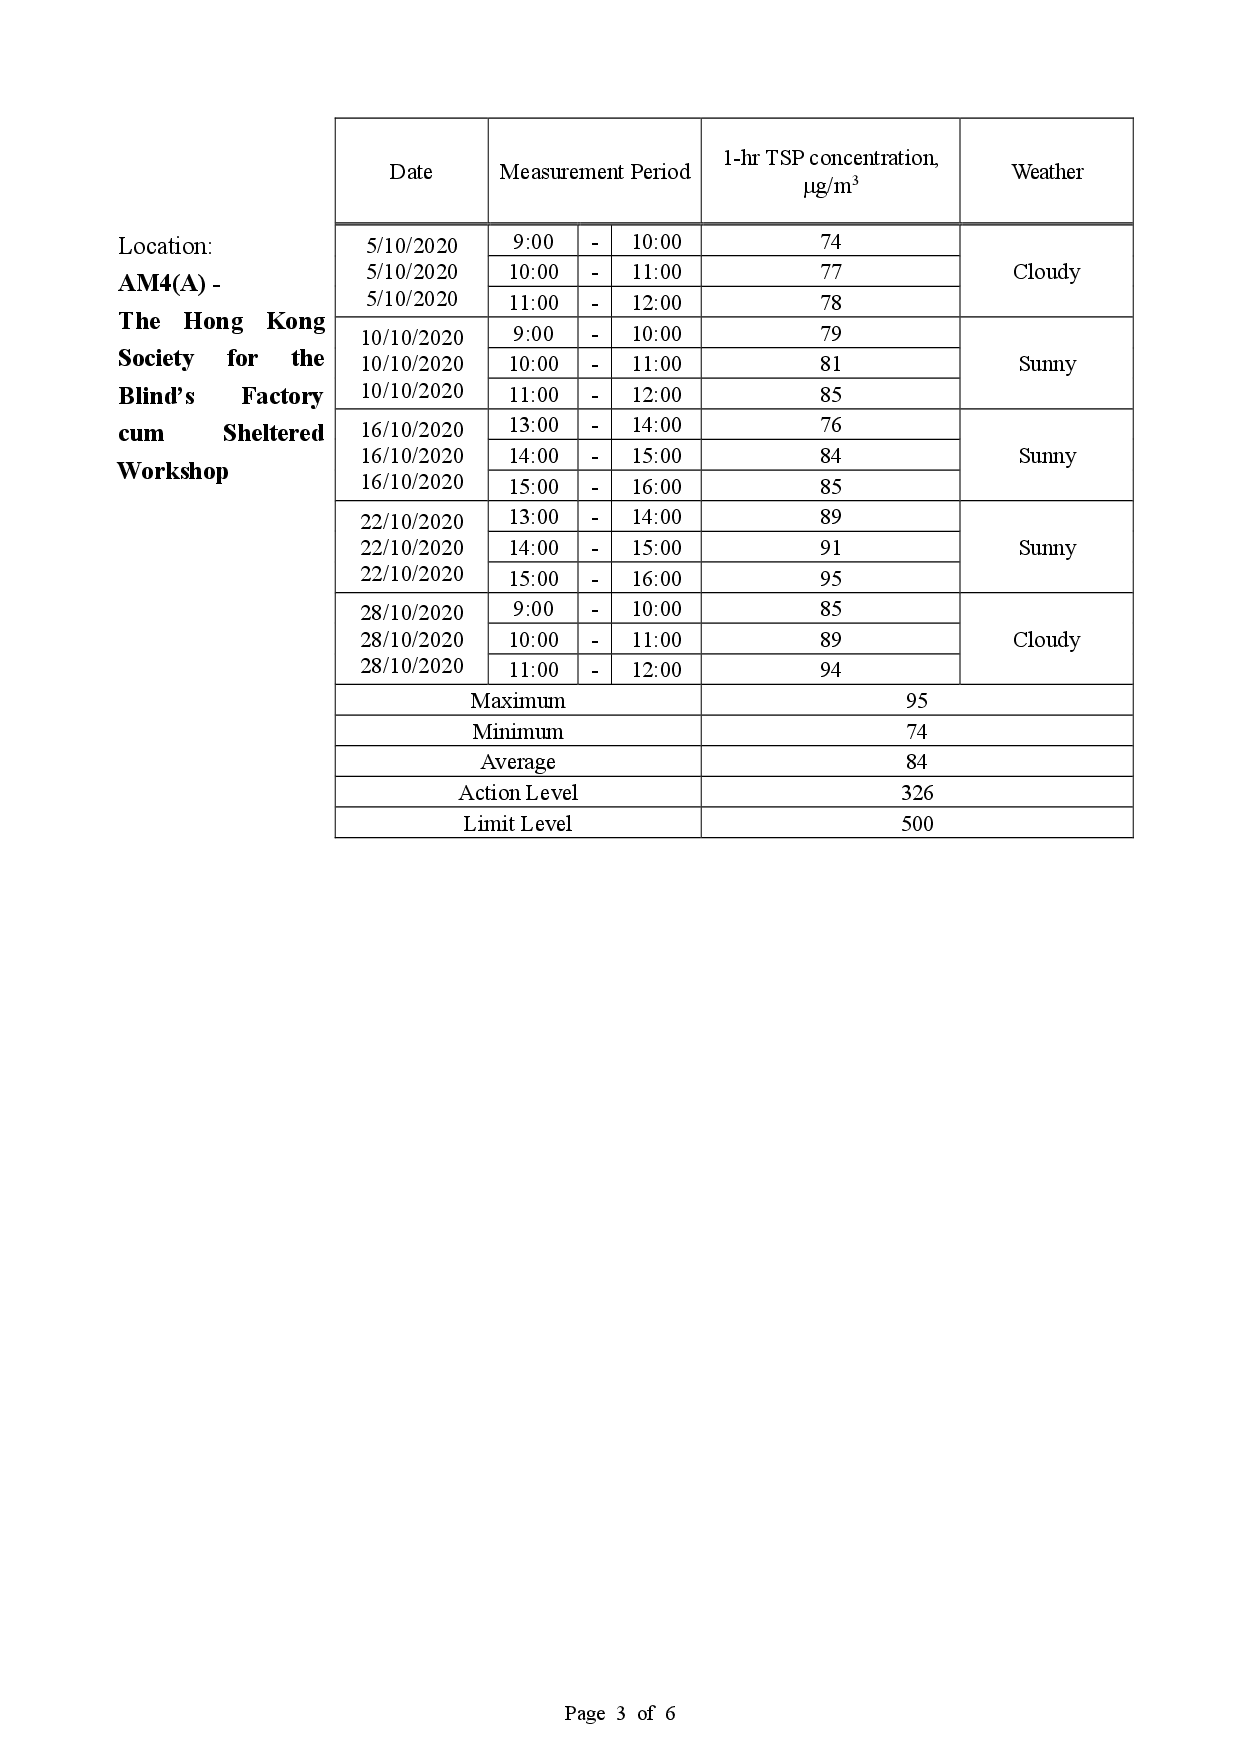
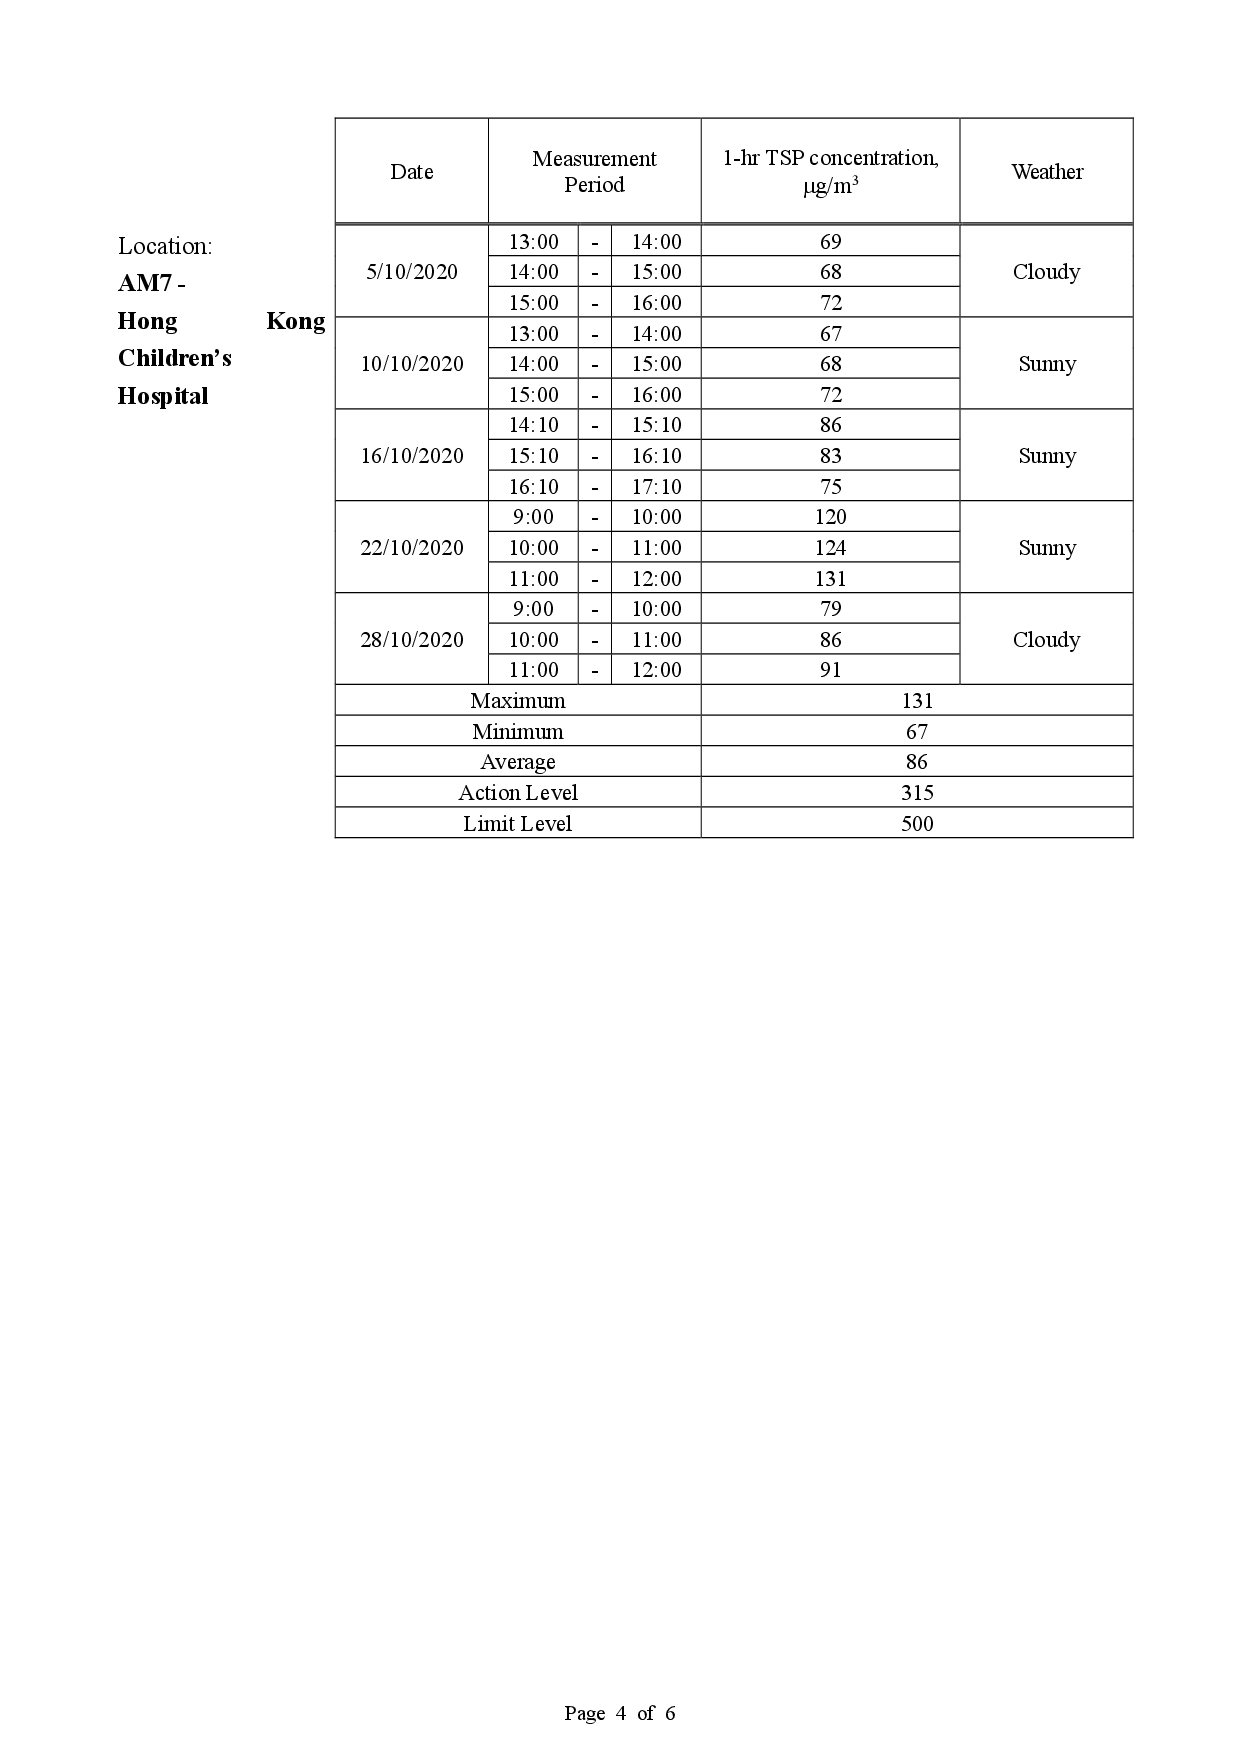
Table 2.7 Summary of 1-hour average TSP Monitoring Data during the reporting month
Table 3.1 Locations of Noise Monitoring Stations
Table 3.2 Noise Monitoring Parameters, Frequency and Duration
Table 3.3 Noise Monitoring Equipment
Table 3.4 Baseline Noise Level and Action and Limit Levels for Construction Noise Monitoring
Table 3.5 Summary of Noise Monitoring Data during the reporting month
Table 4.1 Comparison of 24-hour average TSP Monitoring Data with EIA predictions
Table 4.2 Comparison of 1-hour average TSP Monitoring Data with EIA predictions
Table 4.3 Comparison of Noise Monitoring Data with EIA predictions
Table 5.1 Summary of observations of Landscape and Visual impact during the reporting month
Table 6.1 Summary of site inspections observations during the reporting month
Table 6.2 Summary of Environmental Licenses, Notifications and Permits
Table 6.3 Summary of complaints in the Reporting Month
Table 6.4 Summary of summons and successful prosecutions in the Reporting Month
Table 7.1 Summary of future key issues and potential impact in the coming month
List of Figure
Figure 1 – Proposed works of Contract No. ED/2018/01
Figure 2 – Proposed Bus Stop And Associated Noise Barrier At Road D3A
Figure 3 – Future Pedestrian Connection Between Landscaped Deck And Private Developments
Figure 5 – Air Quality Monitoring Stations
Figure 6 – Noise Monitoring Stations
List of Appendices
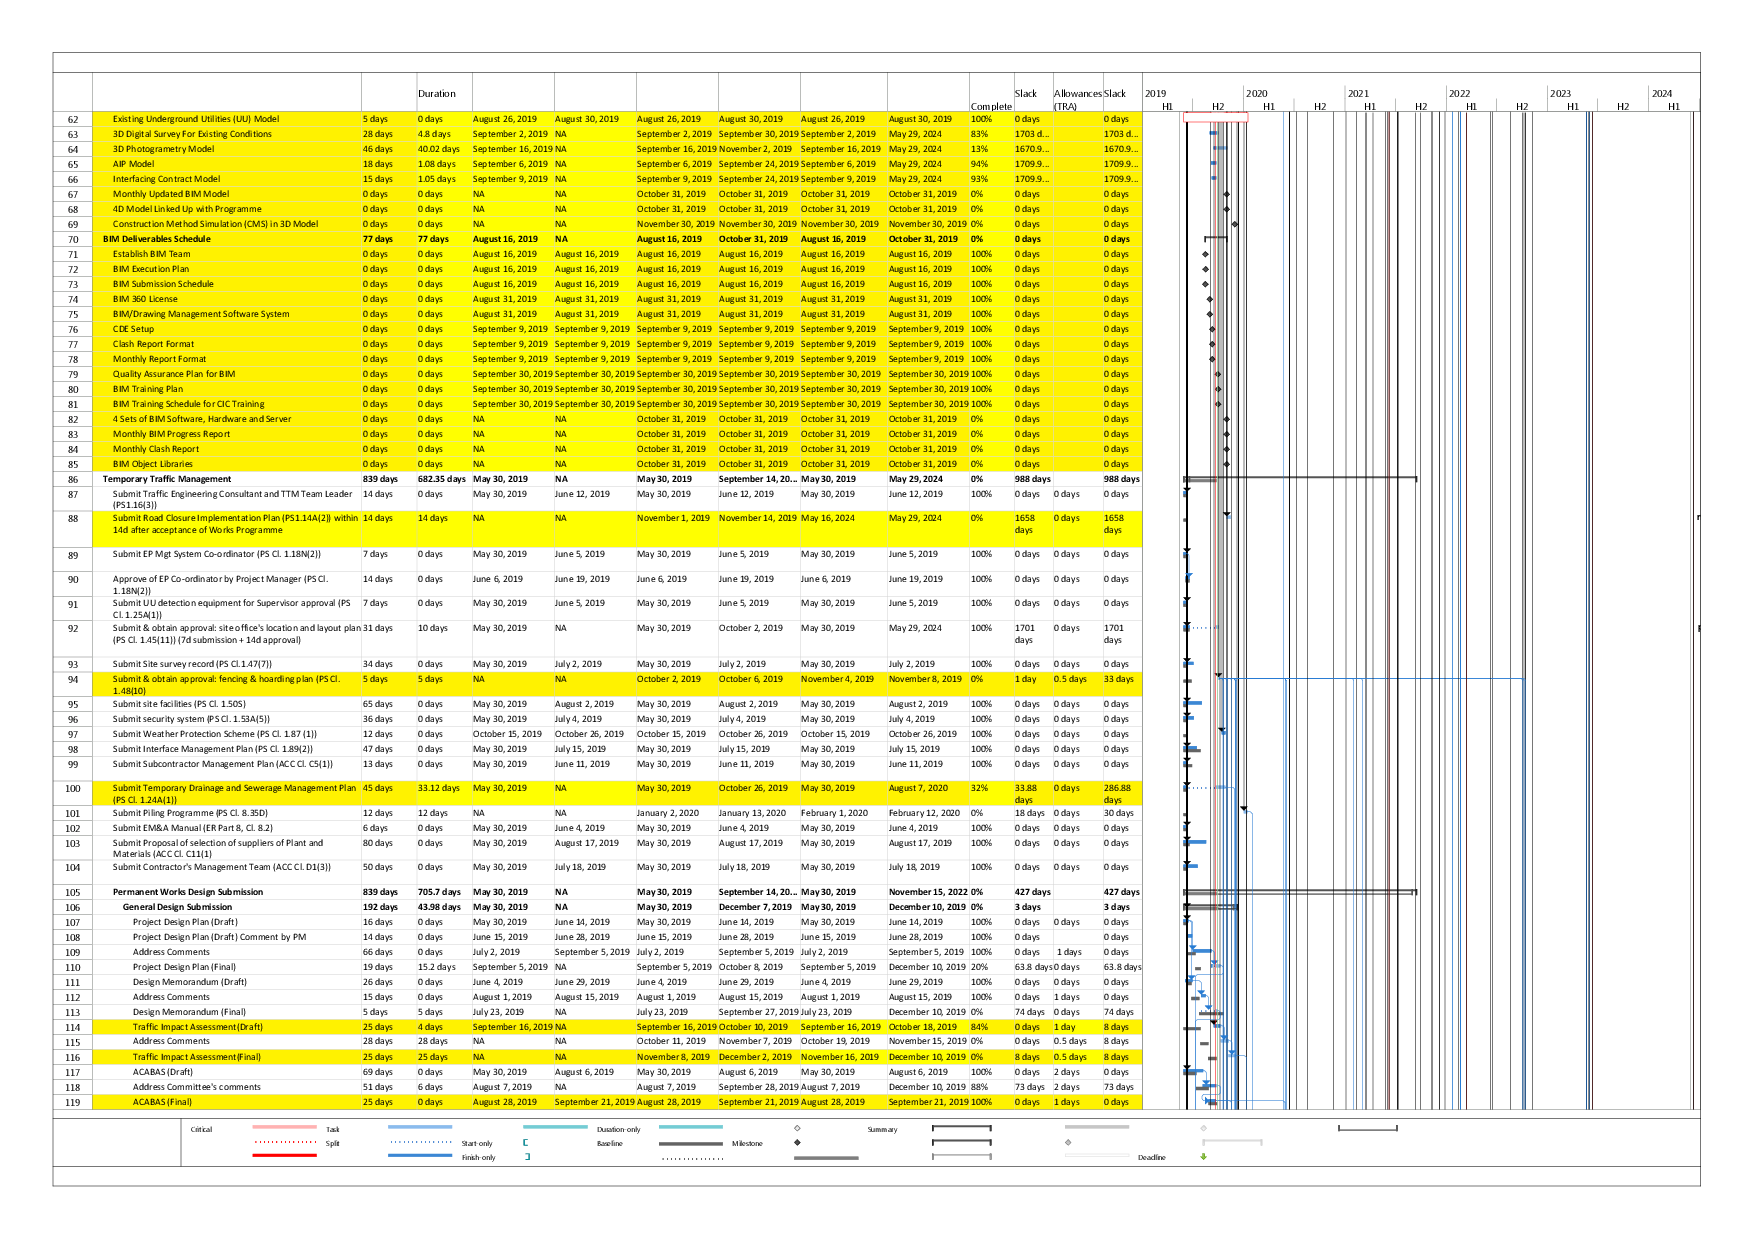
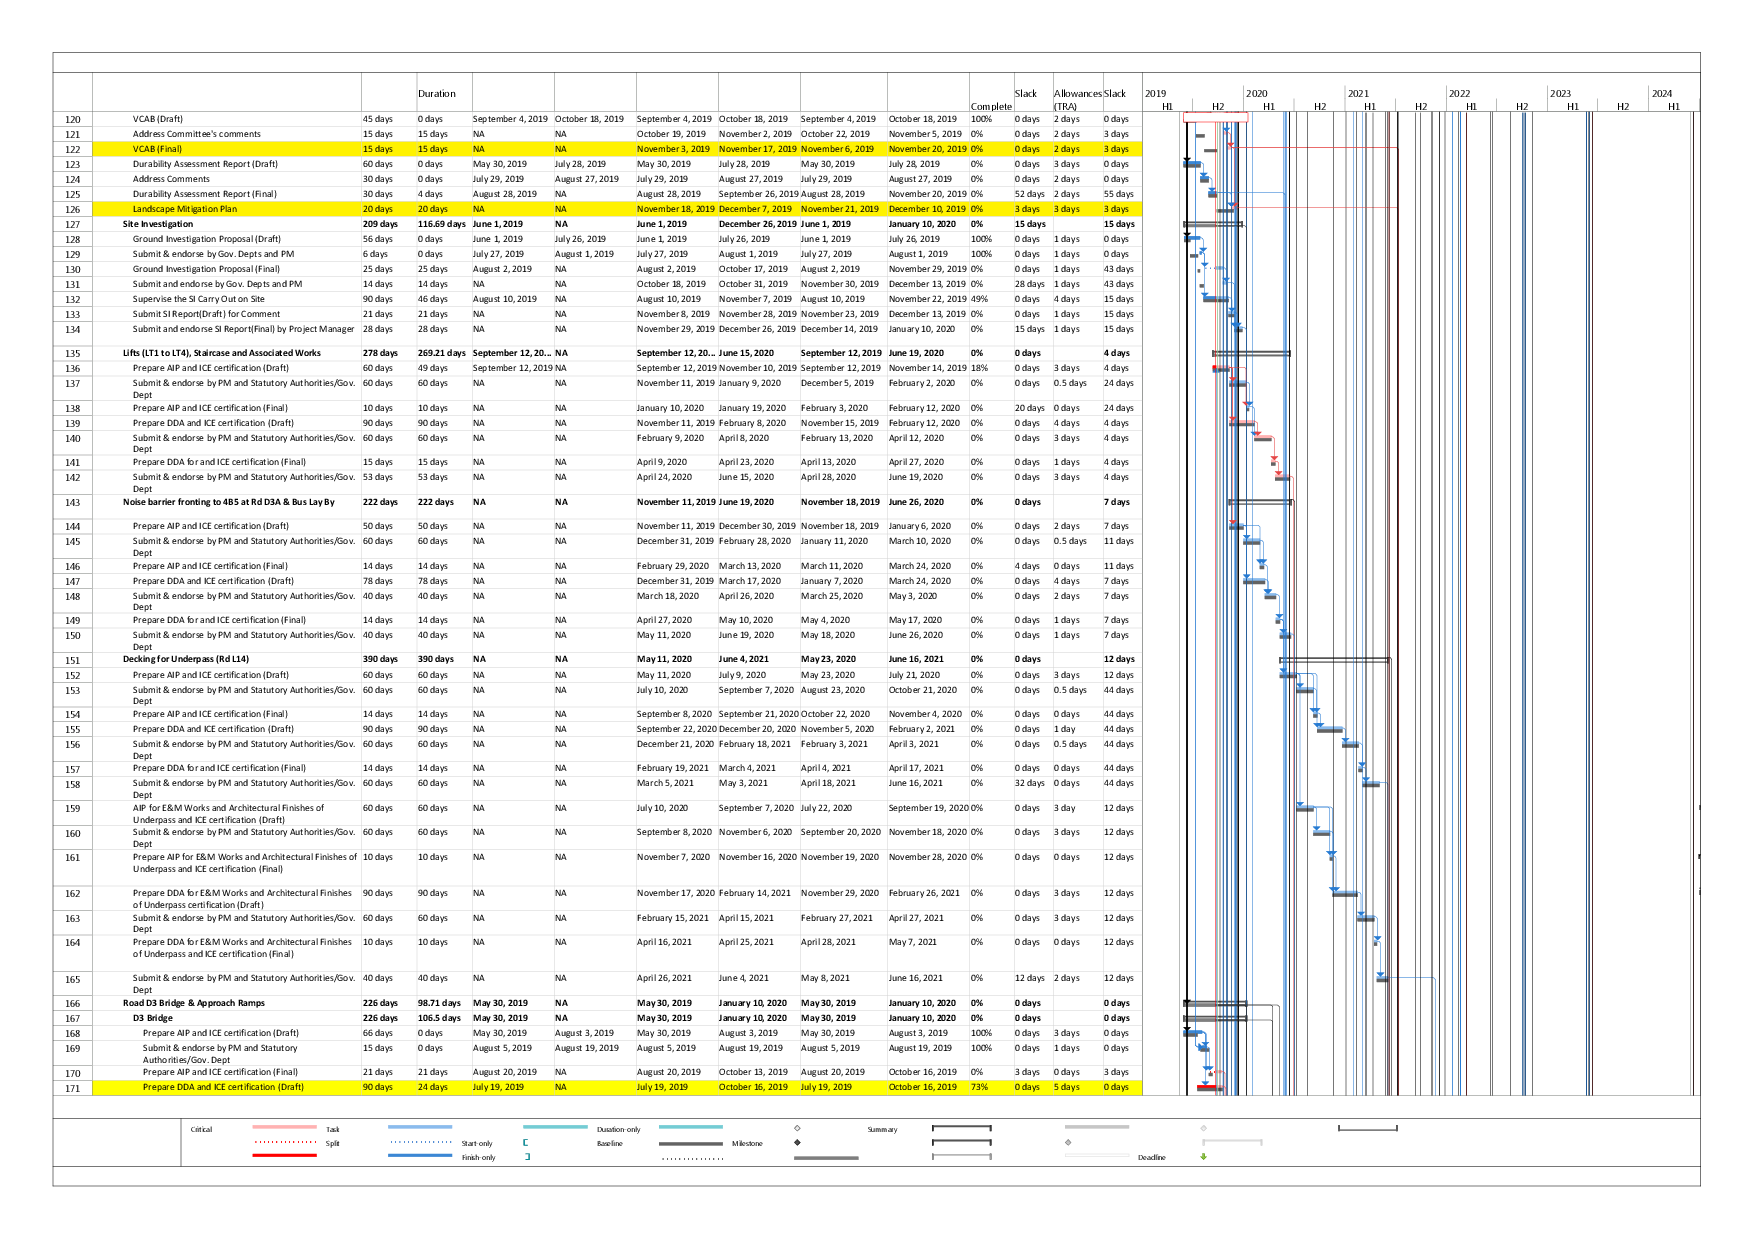
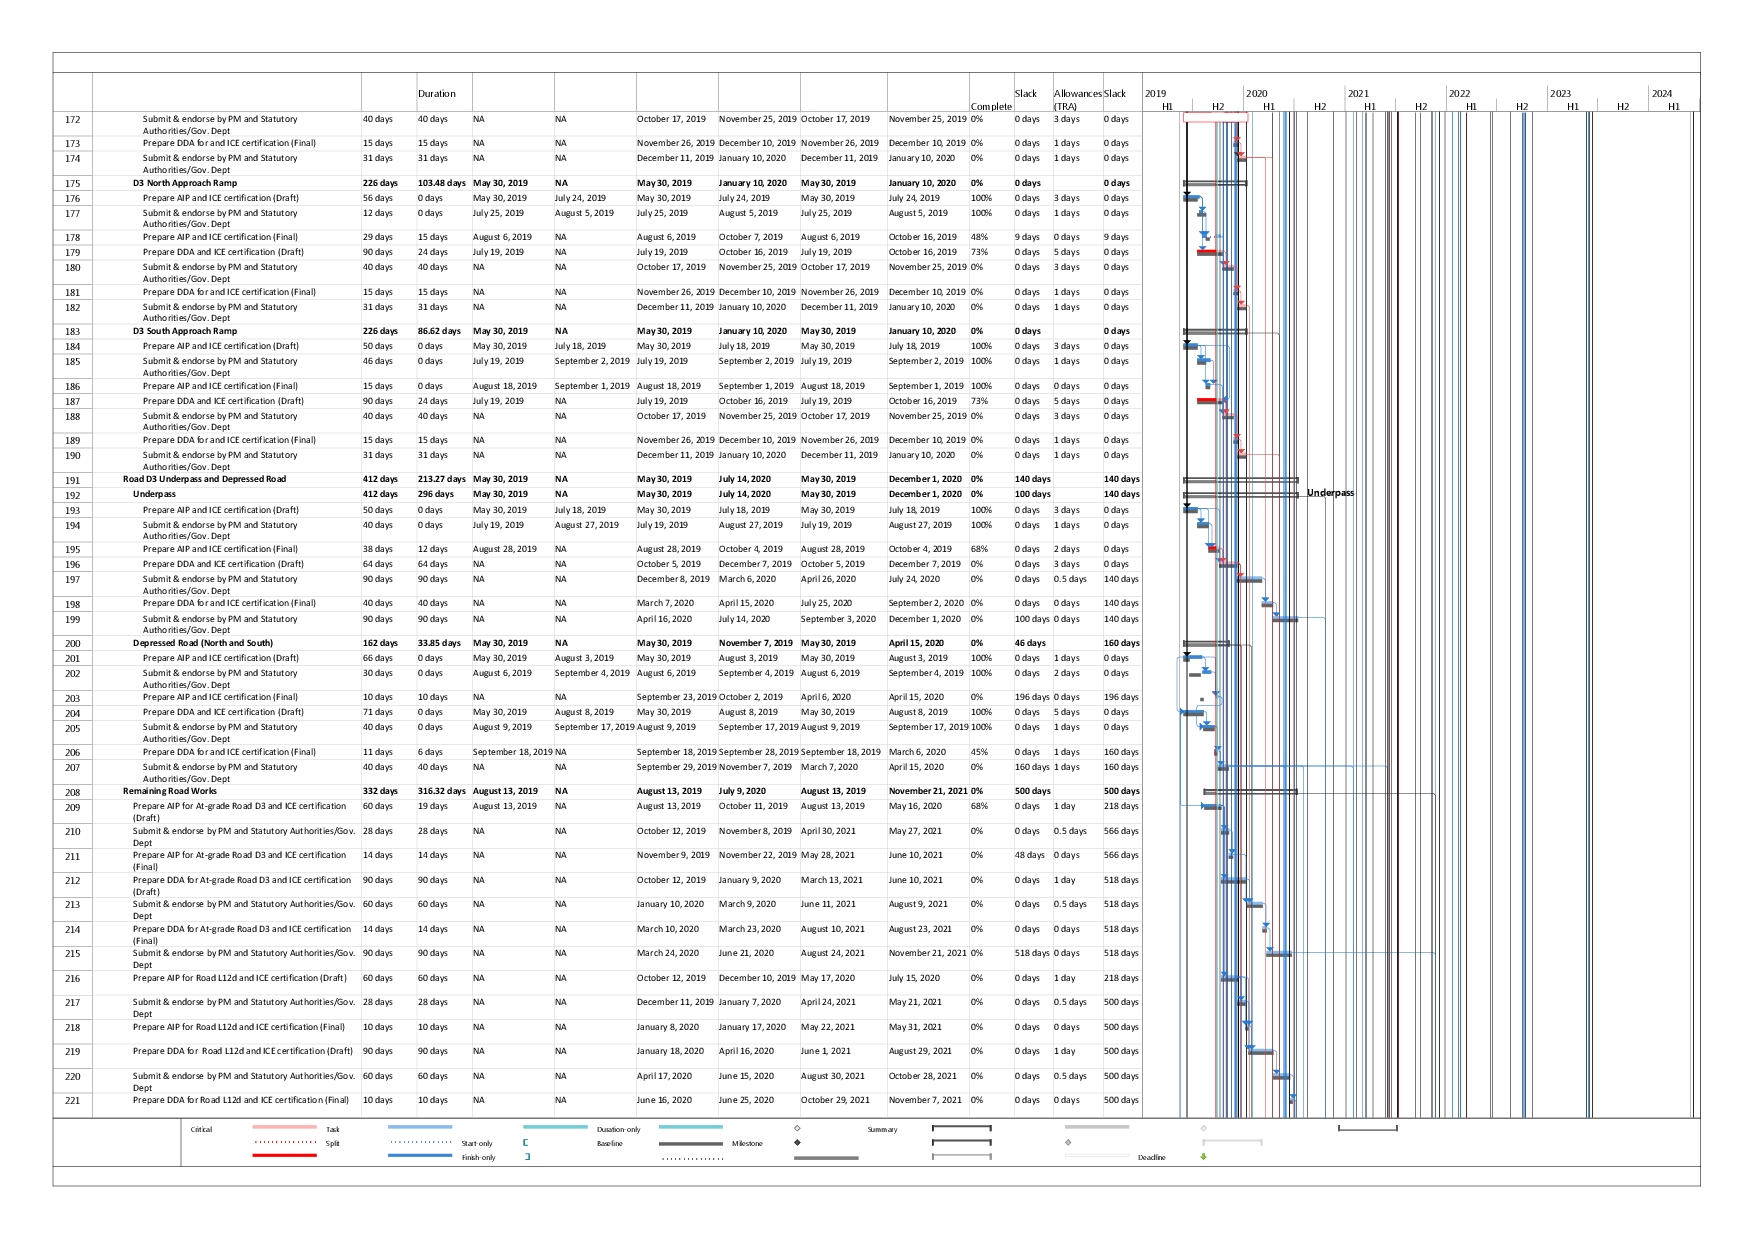
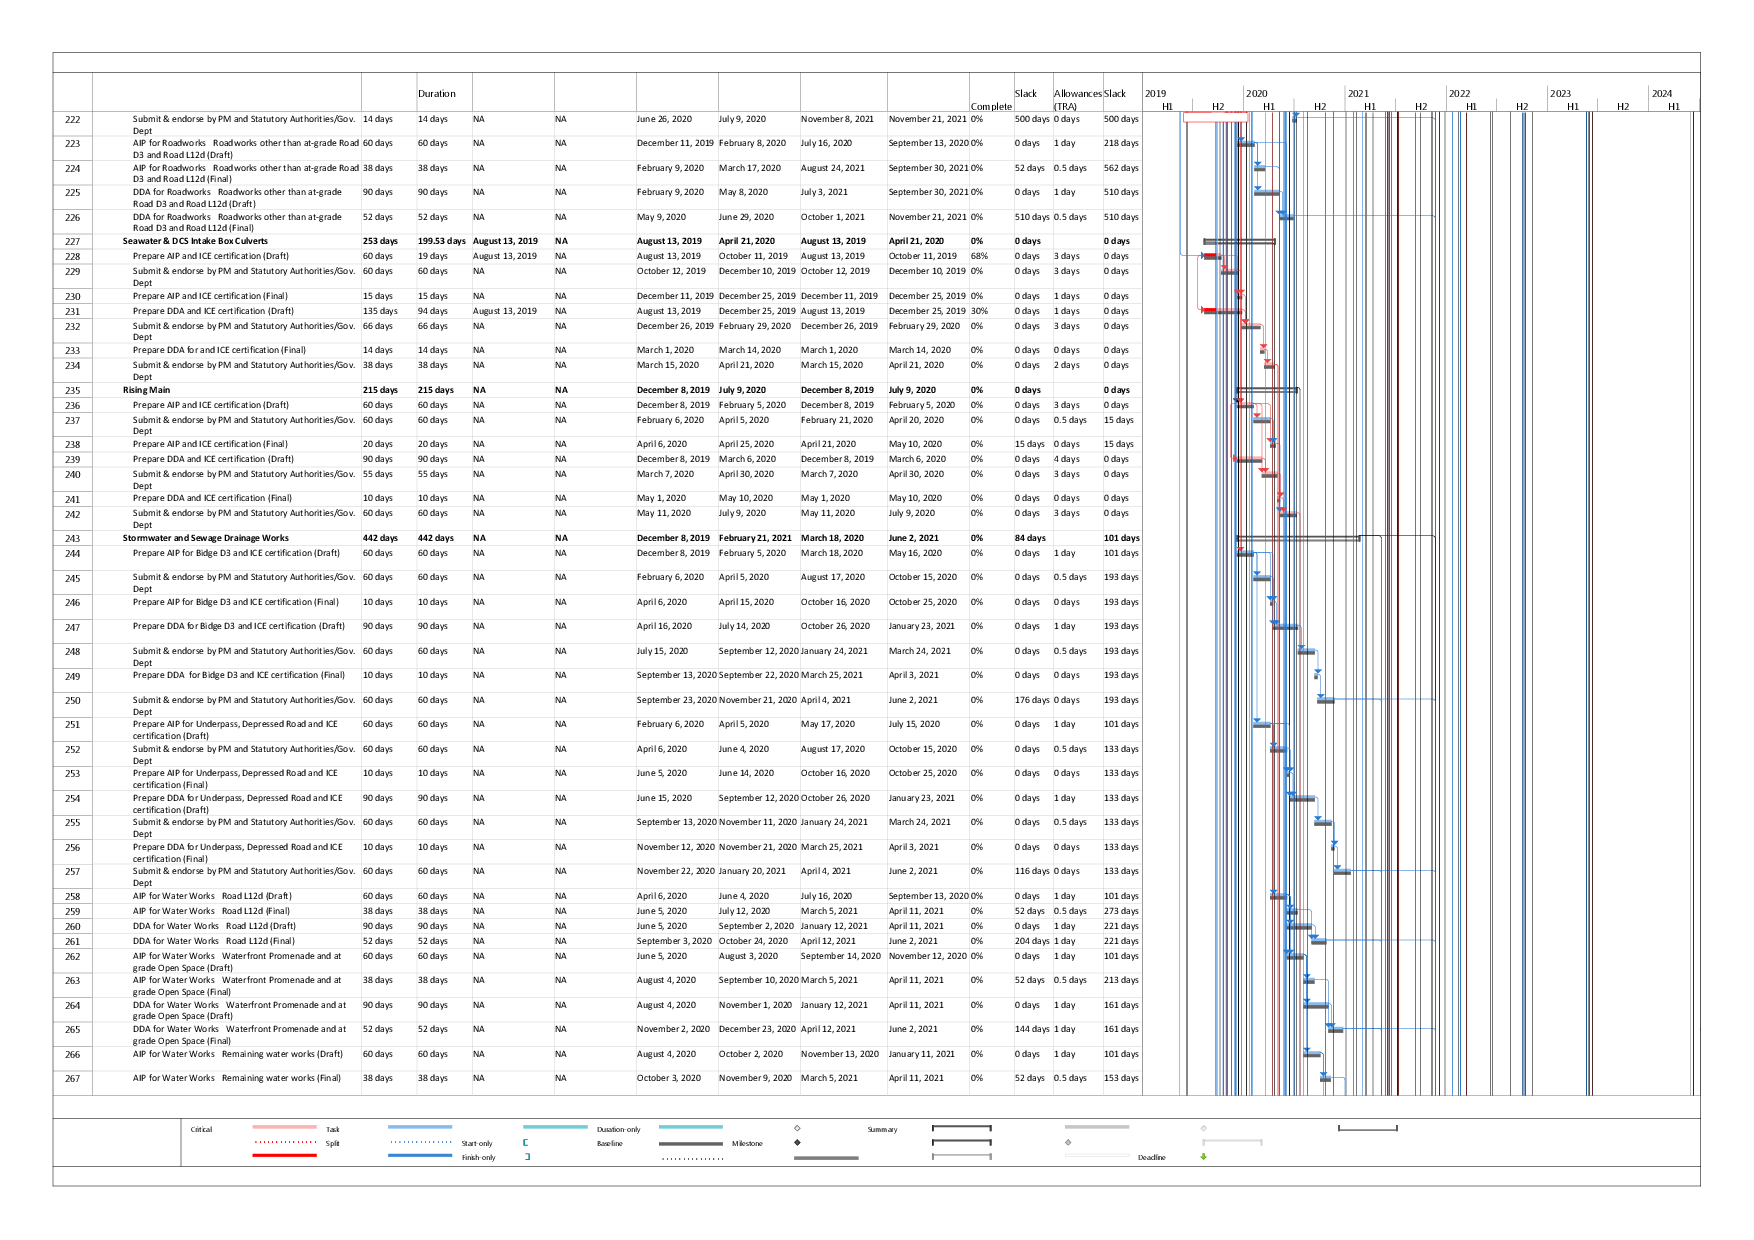
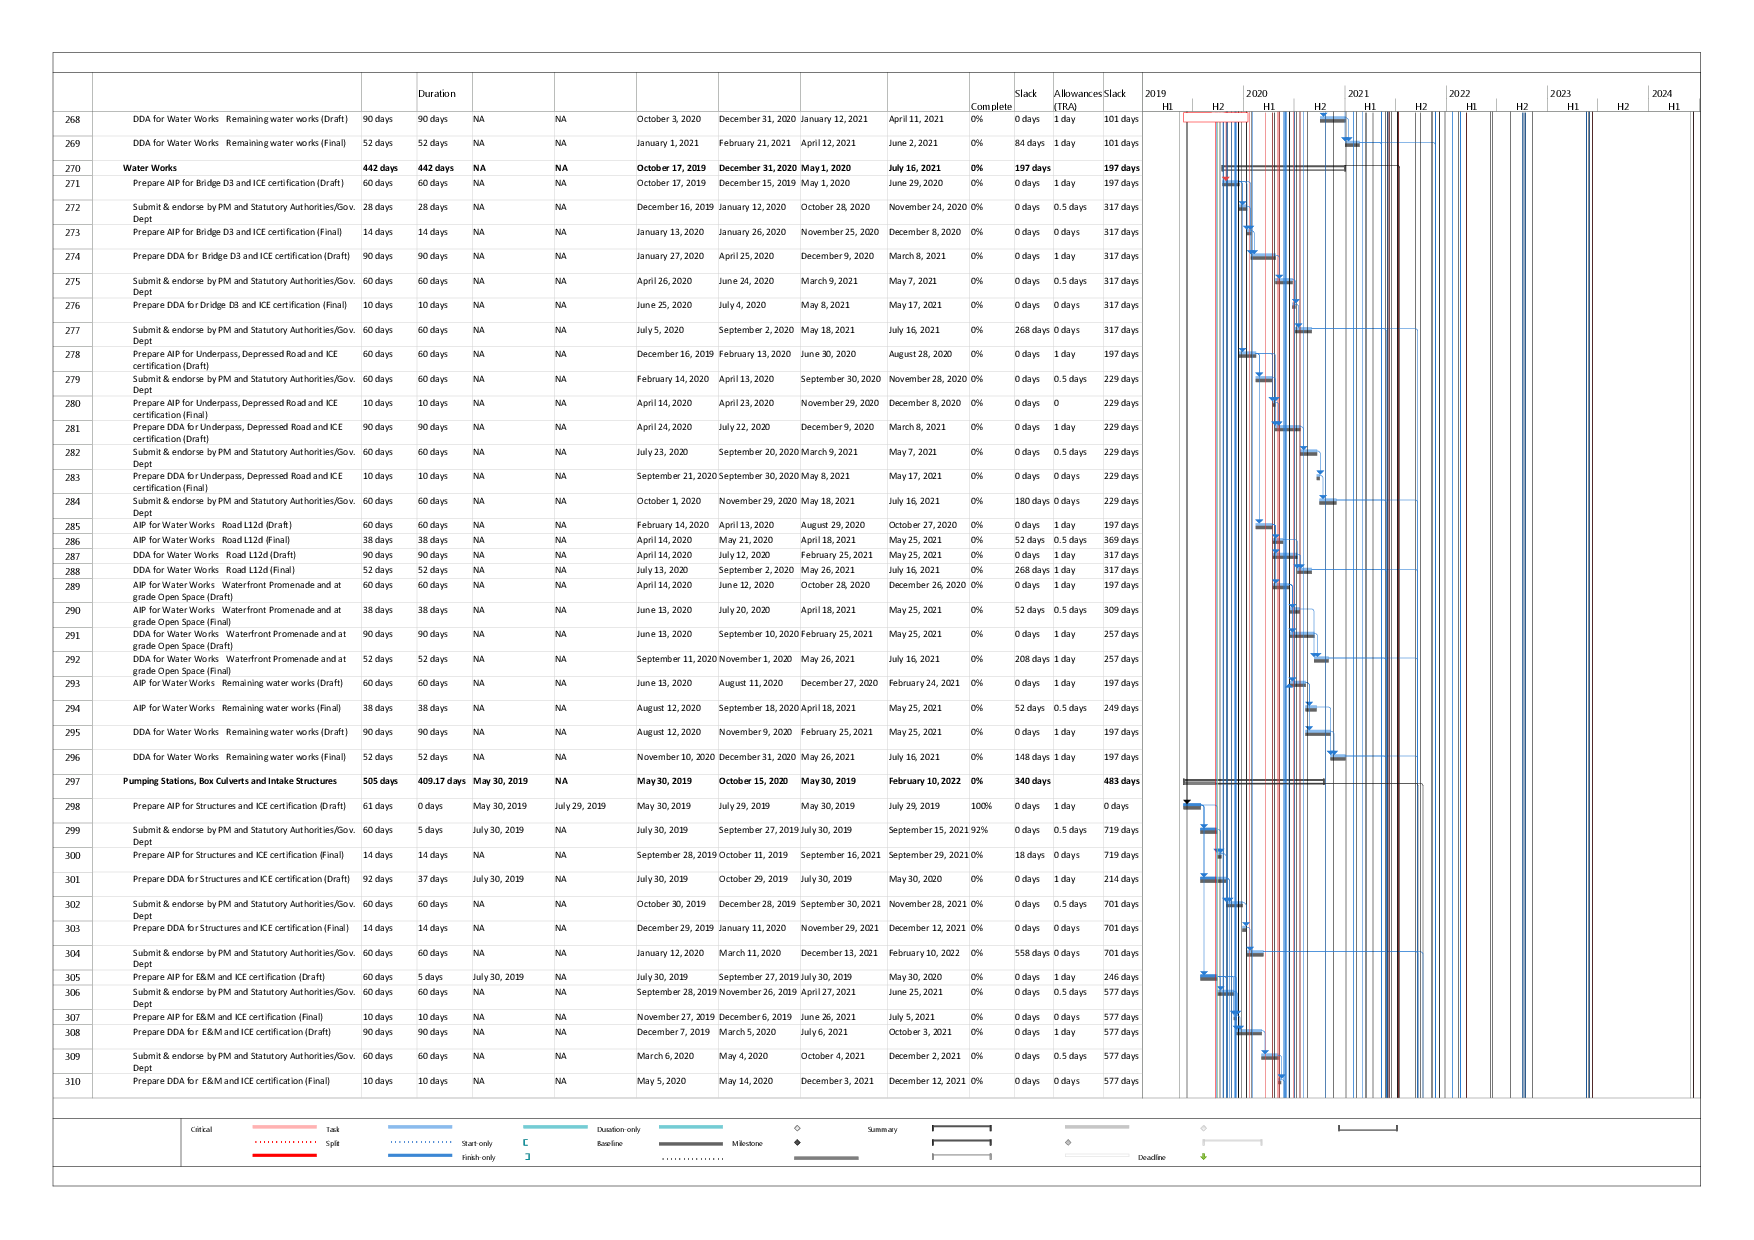
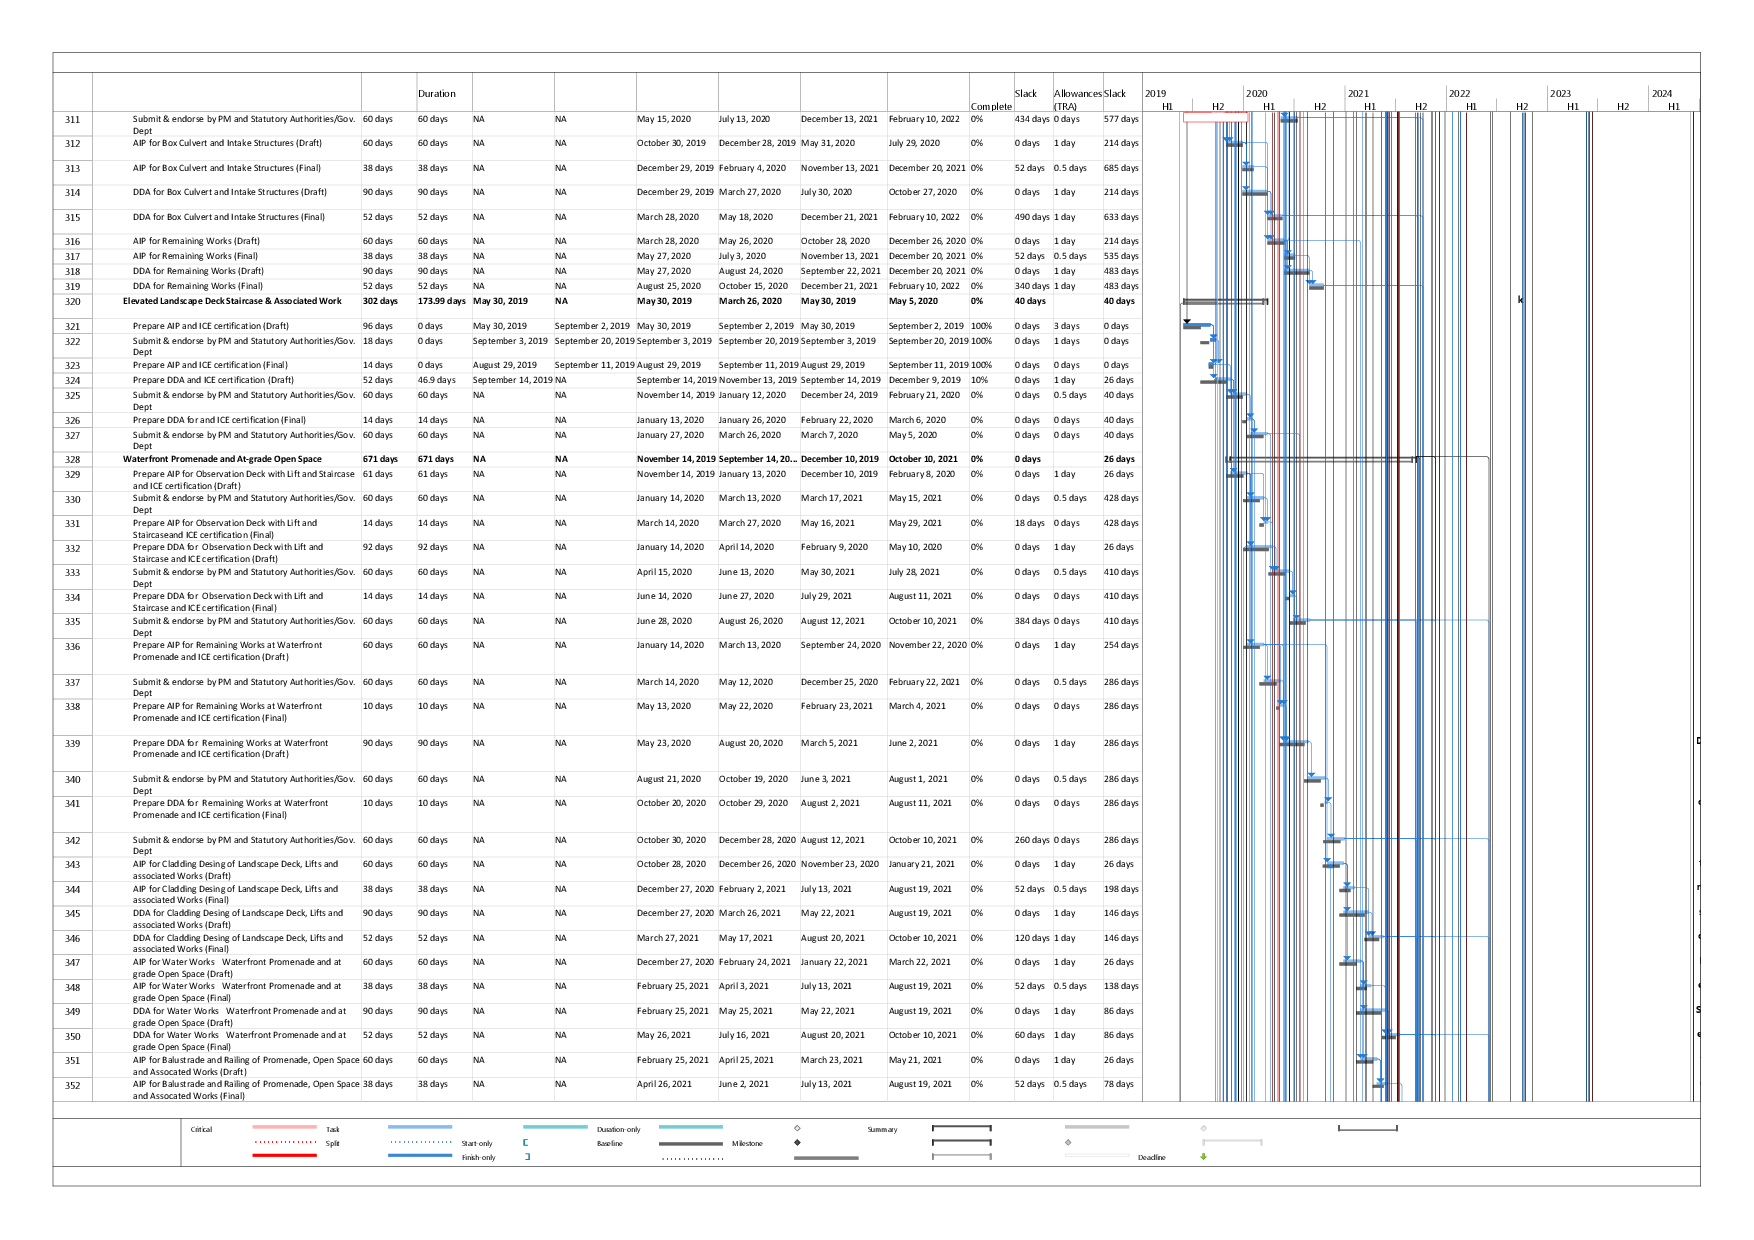
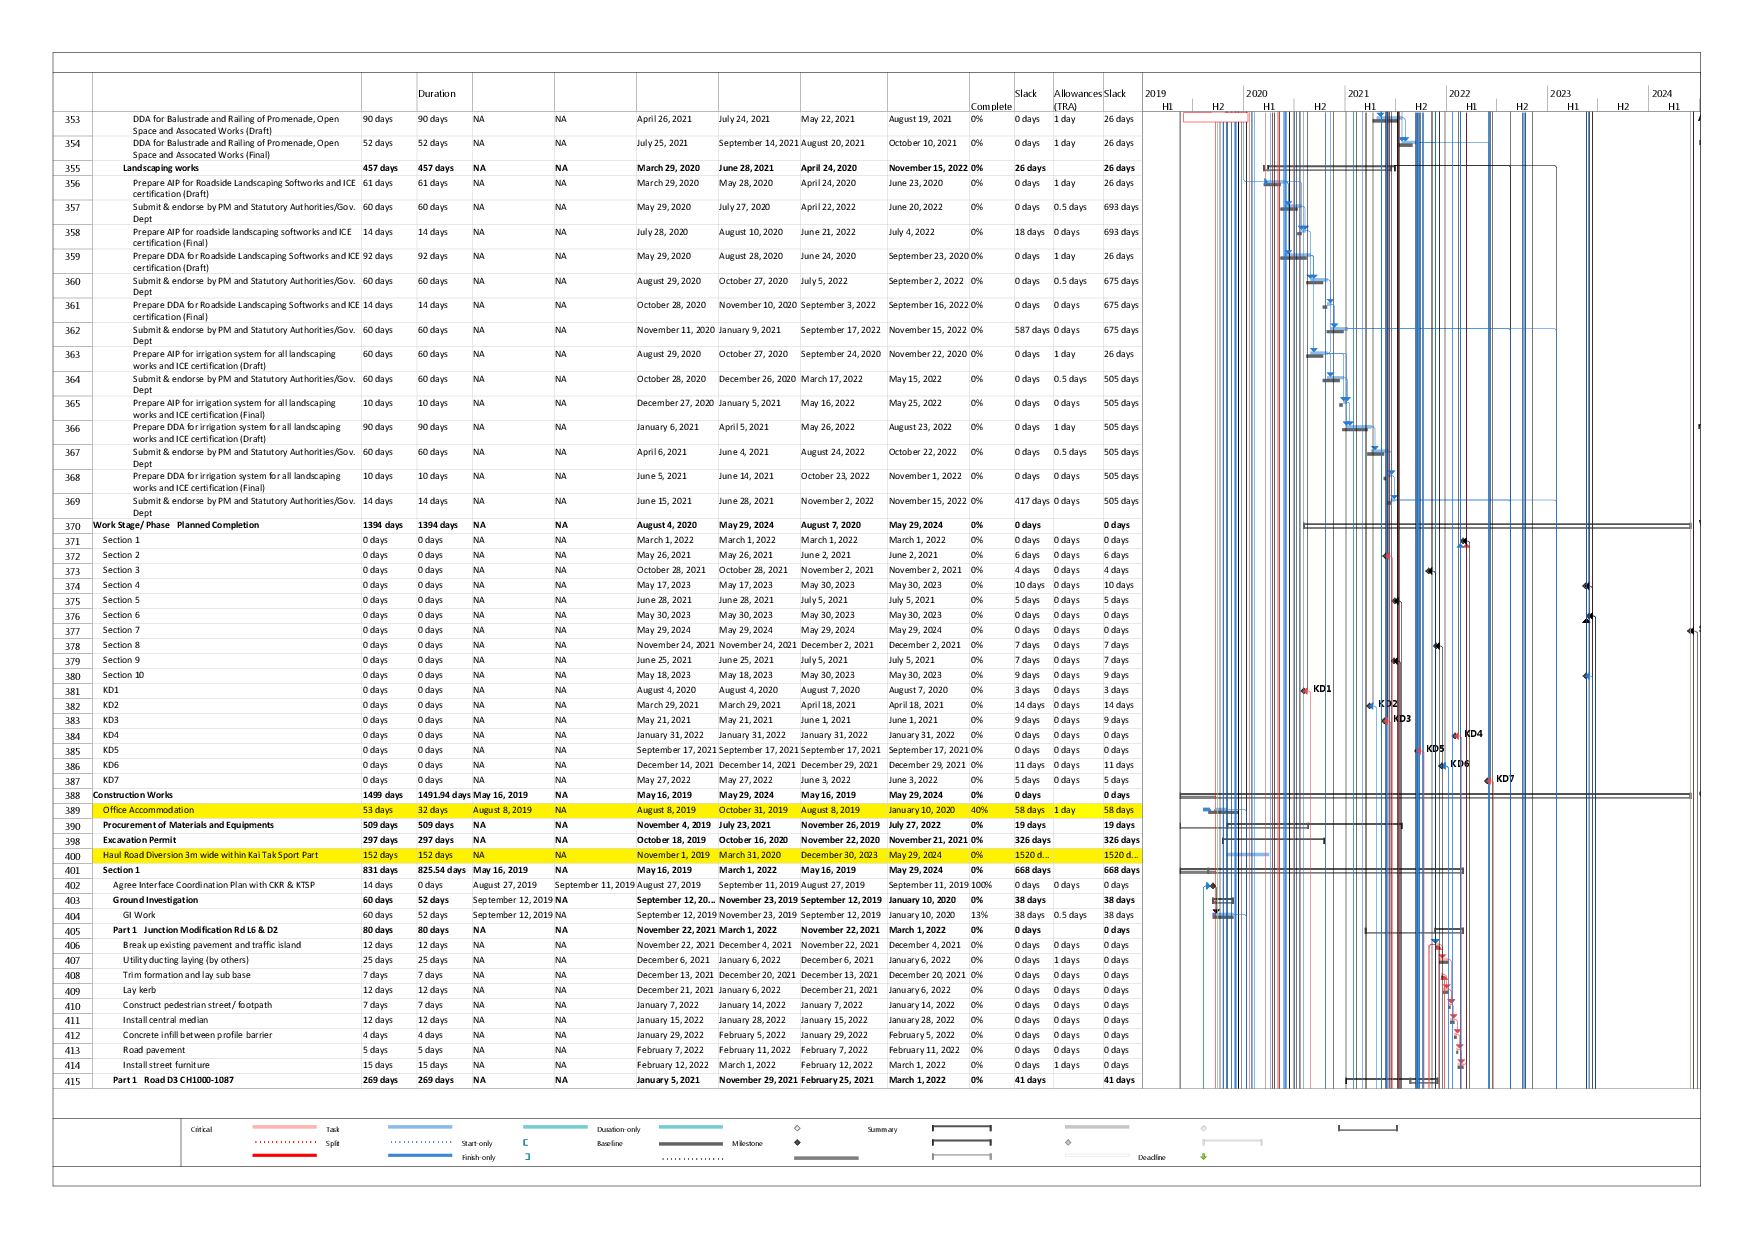
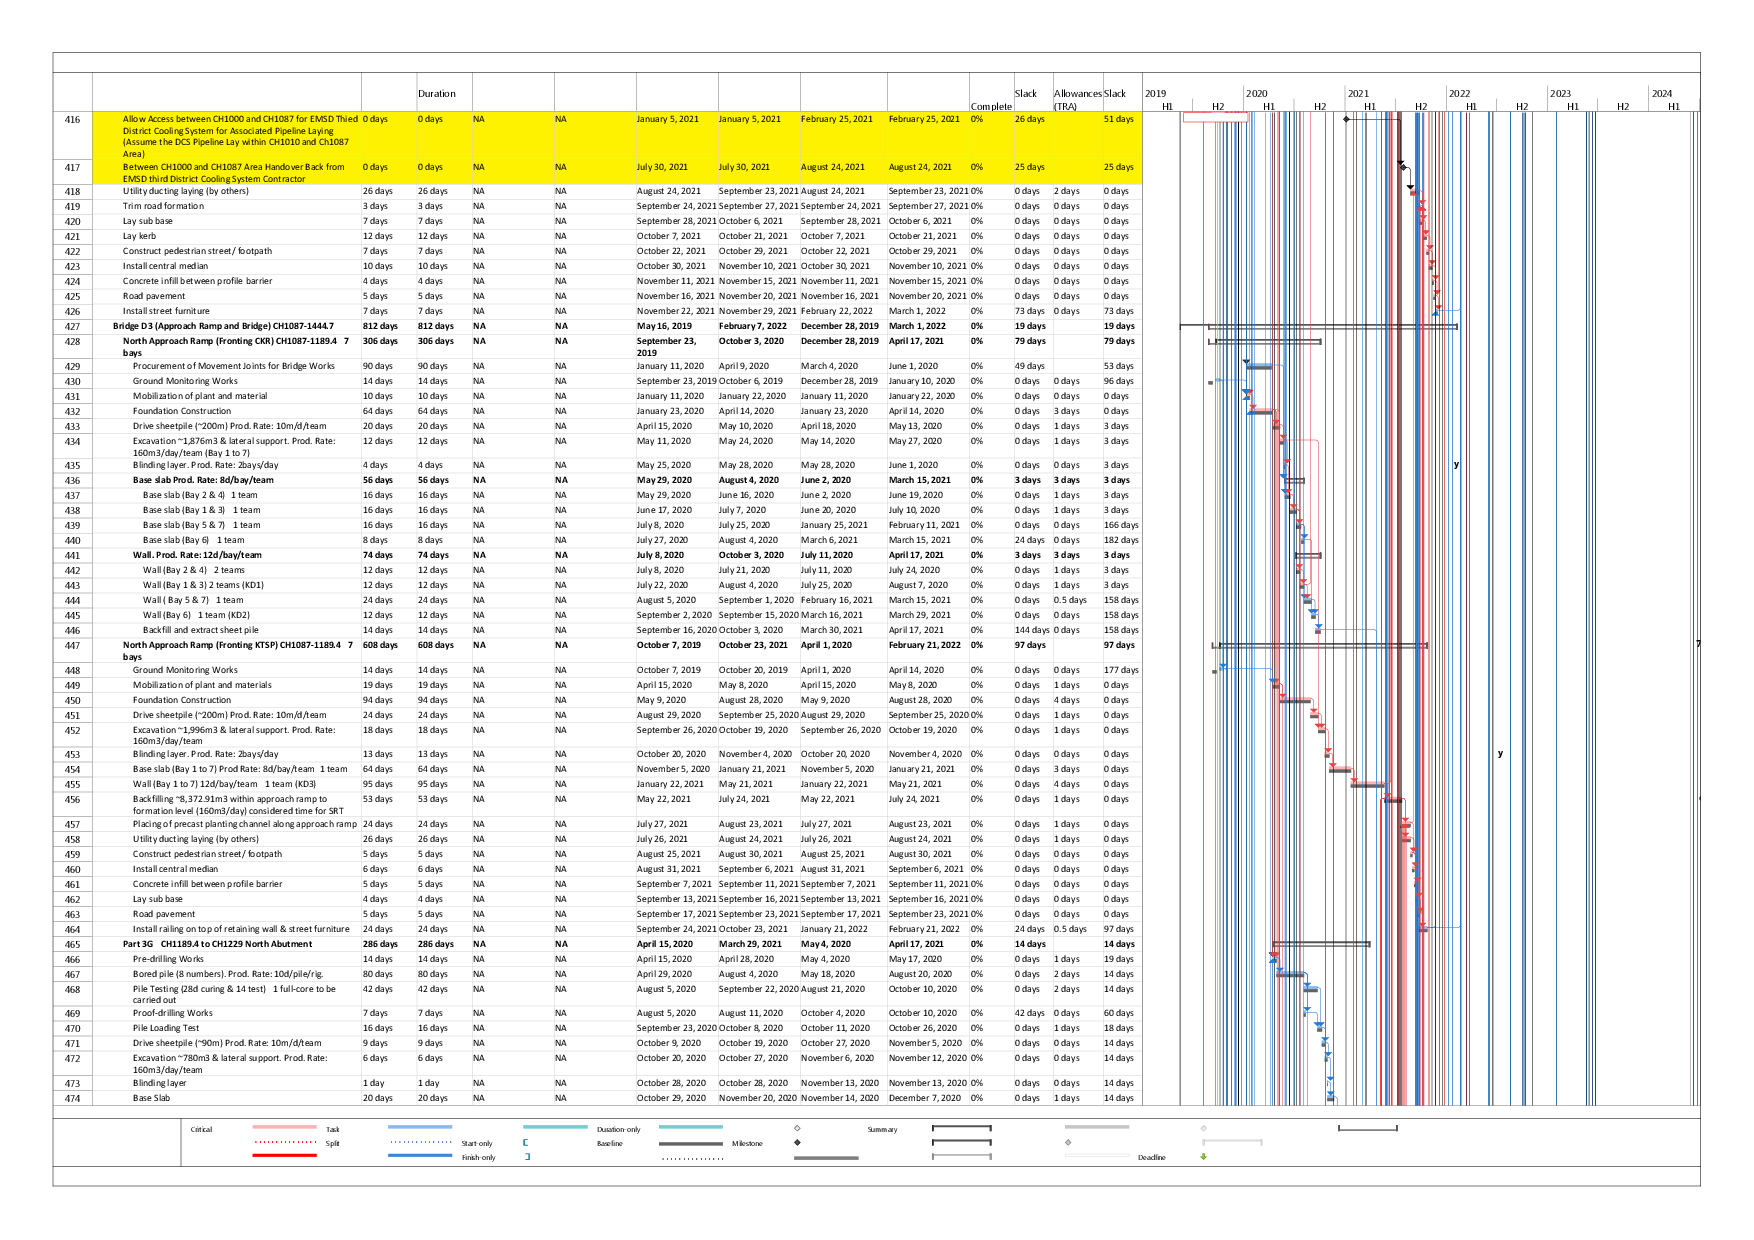
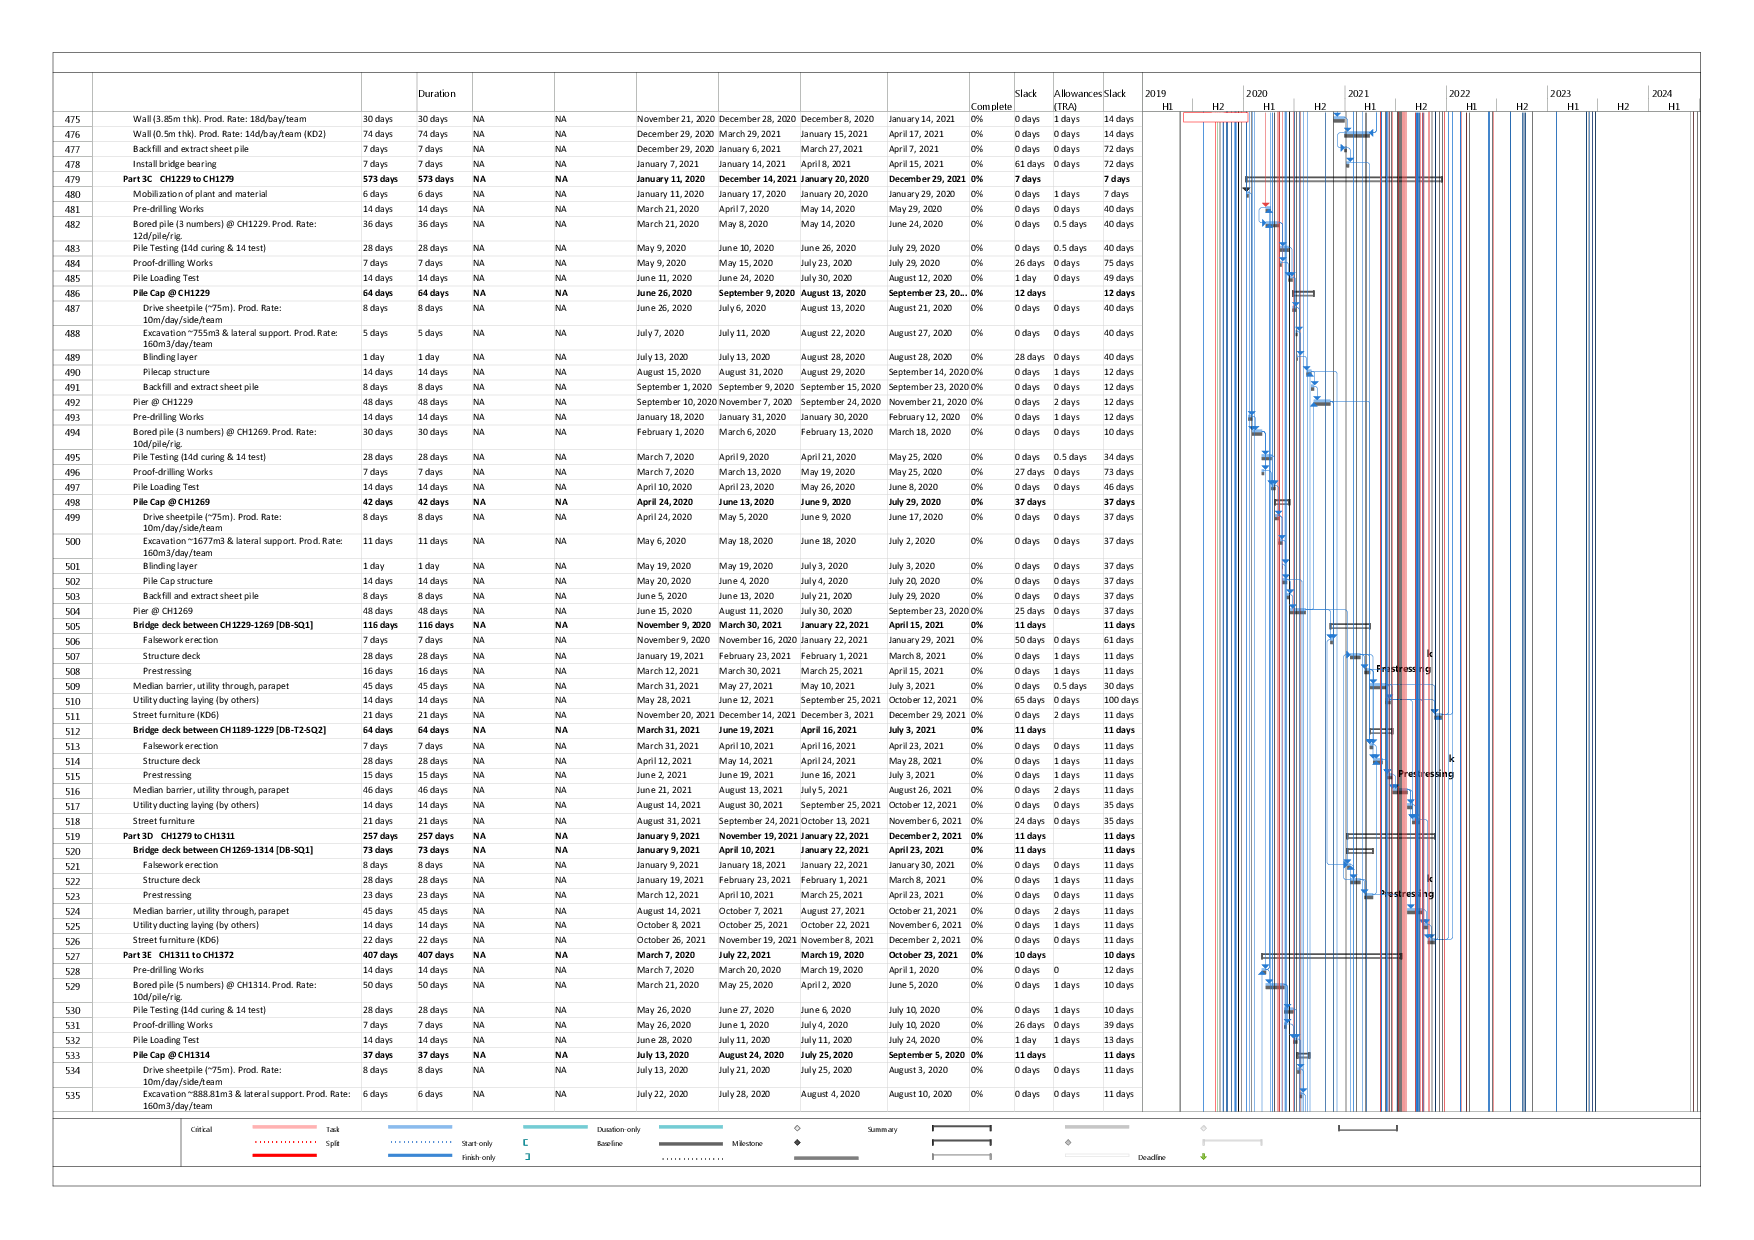
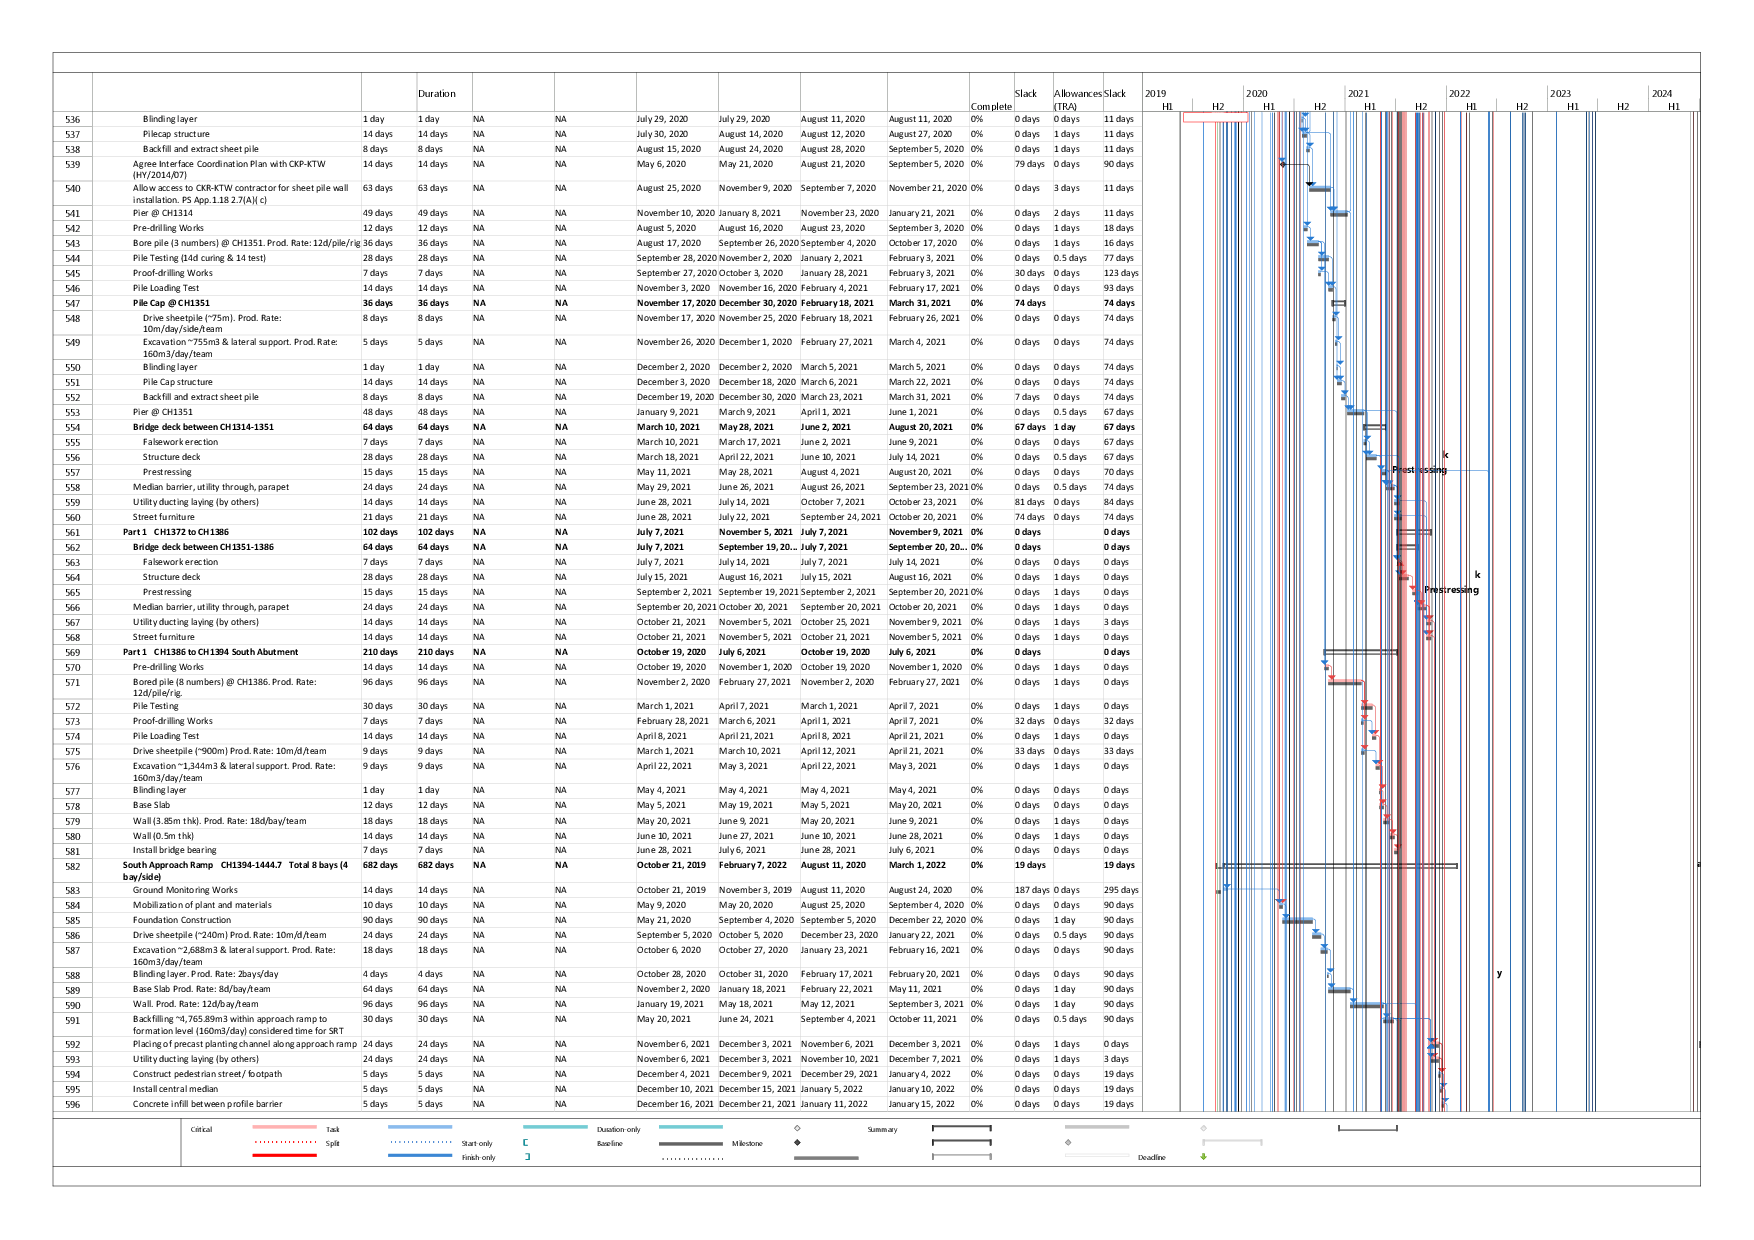
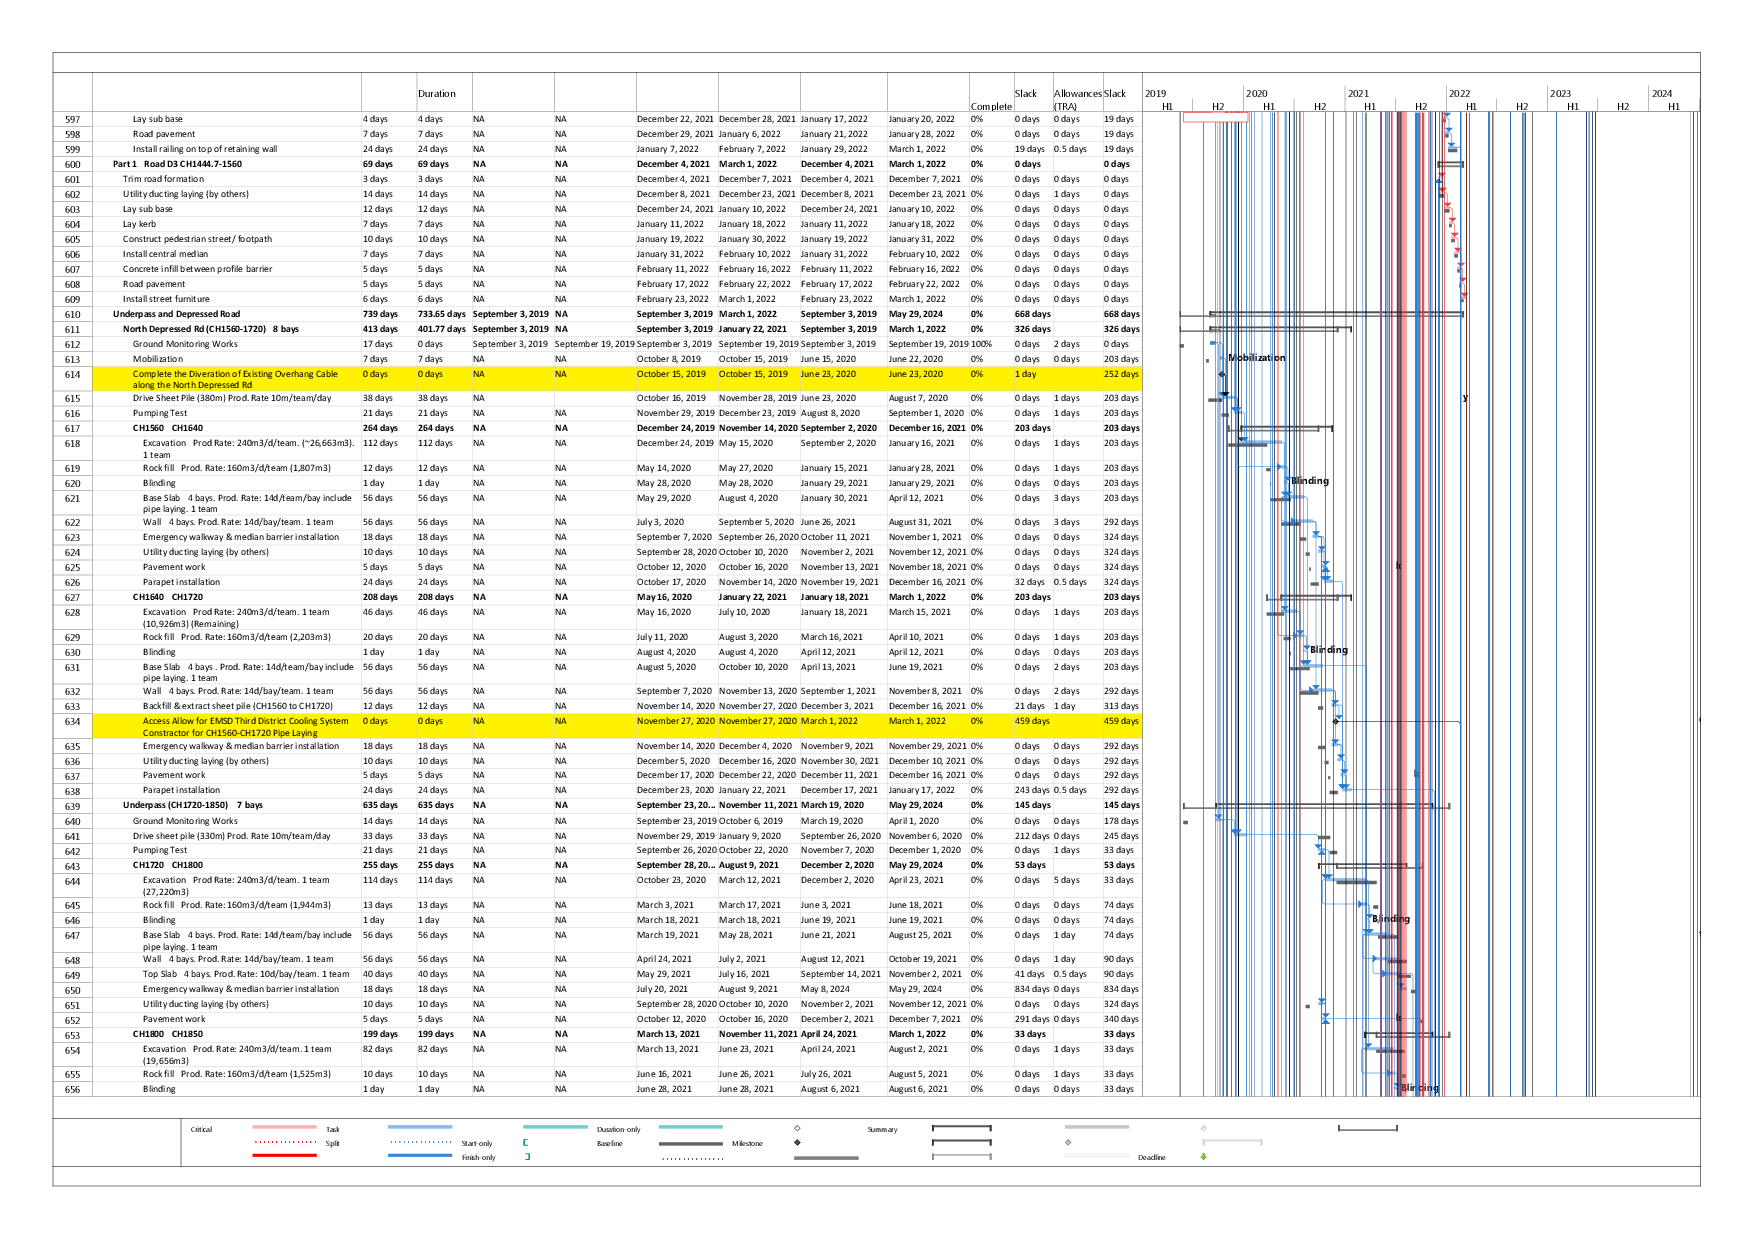
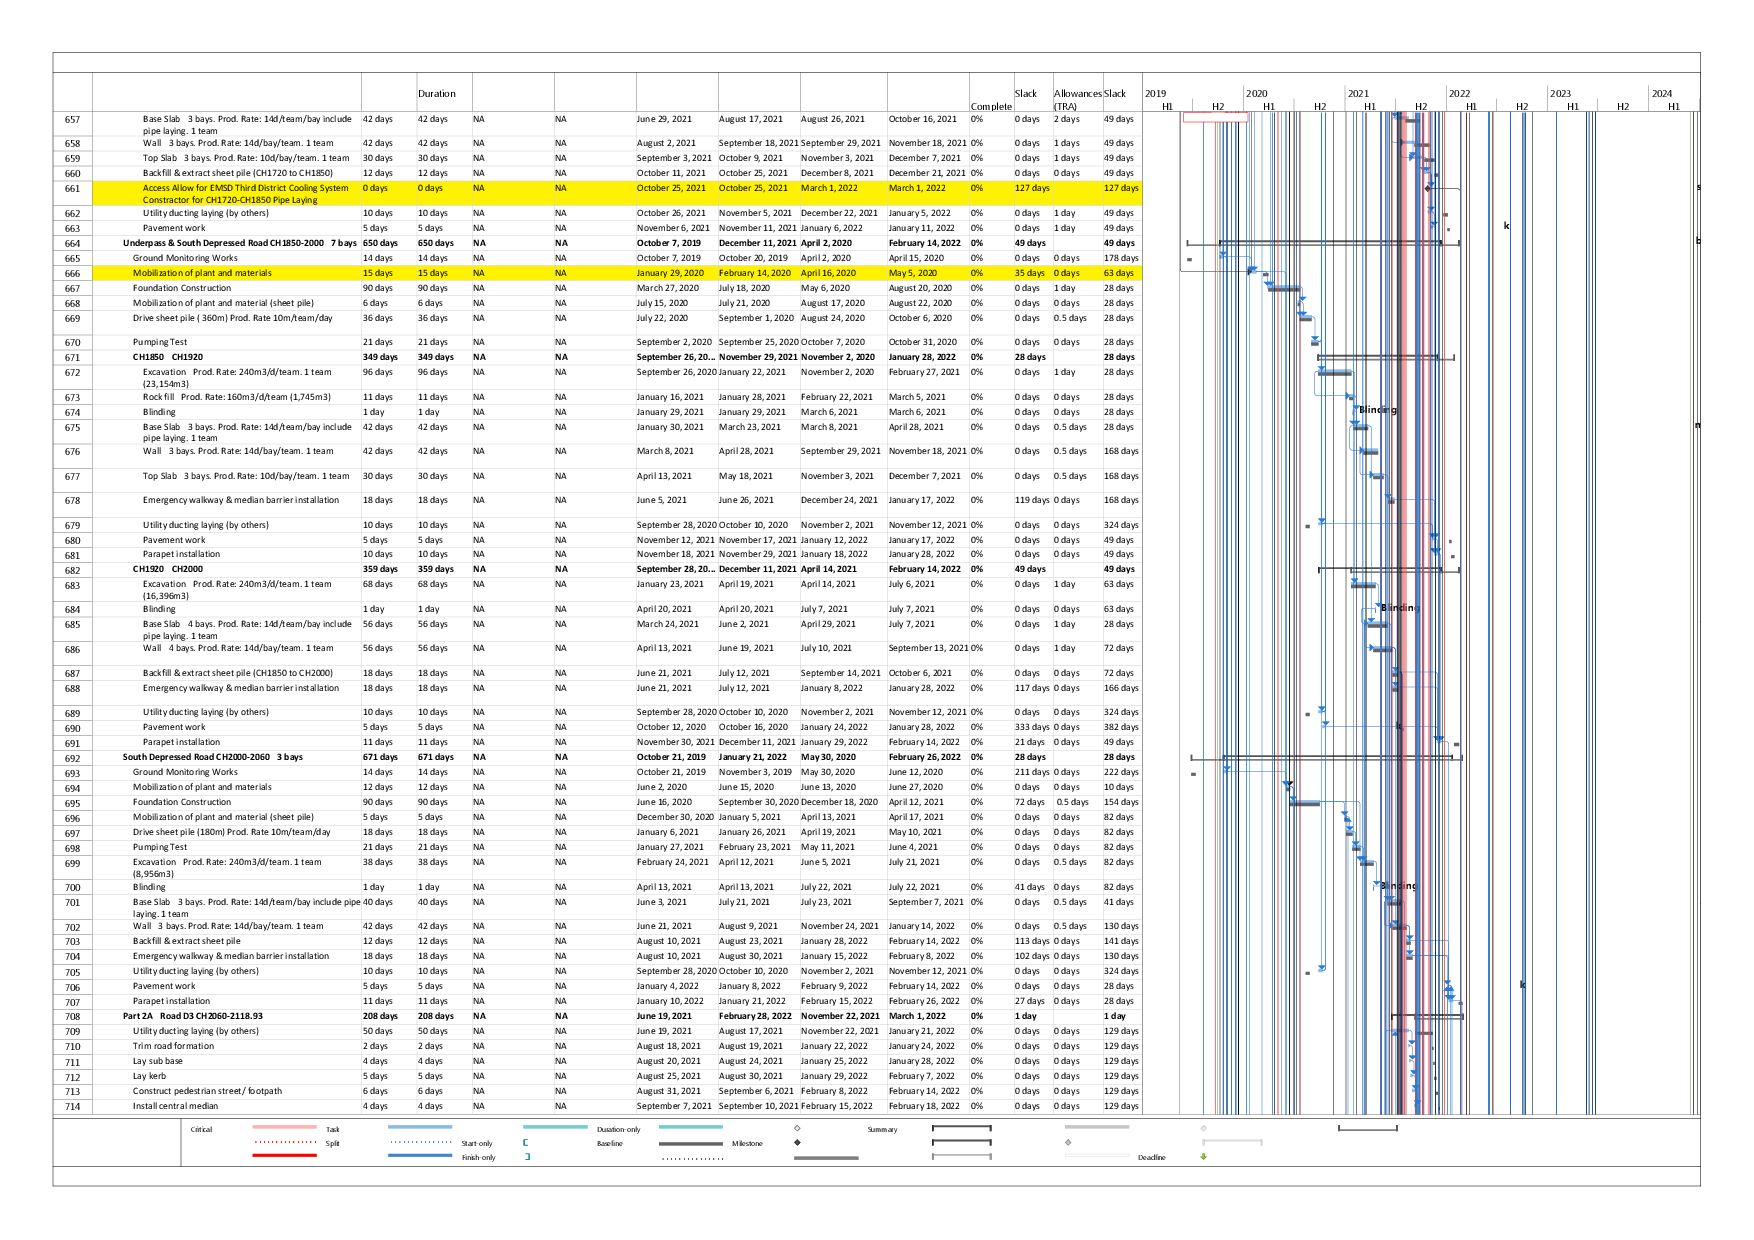
Appendix B – Construction Programme
Appendix C – Environmental monitoring schedules
Appendix F – Weather information
Appendix H – 1-hr TSP monitoring results and graphical presentation
Appendix I – Event and Action Plan for air quality
Appendix J – Calibration certificates, catalogue of noise monitoring equipment
Appendix K – Noise monitoring results and graphical presentation
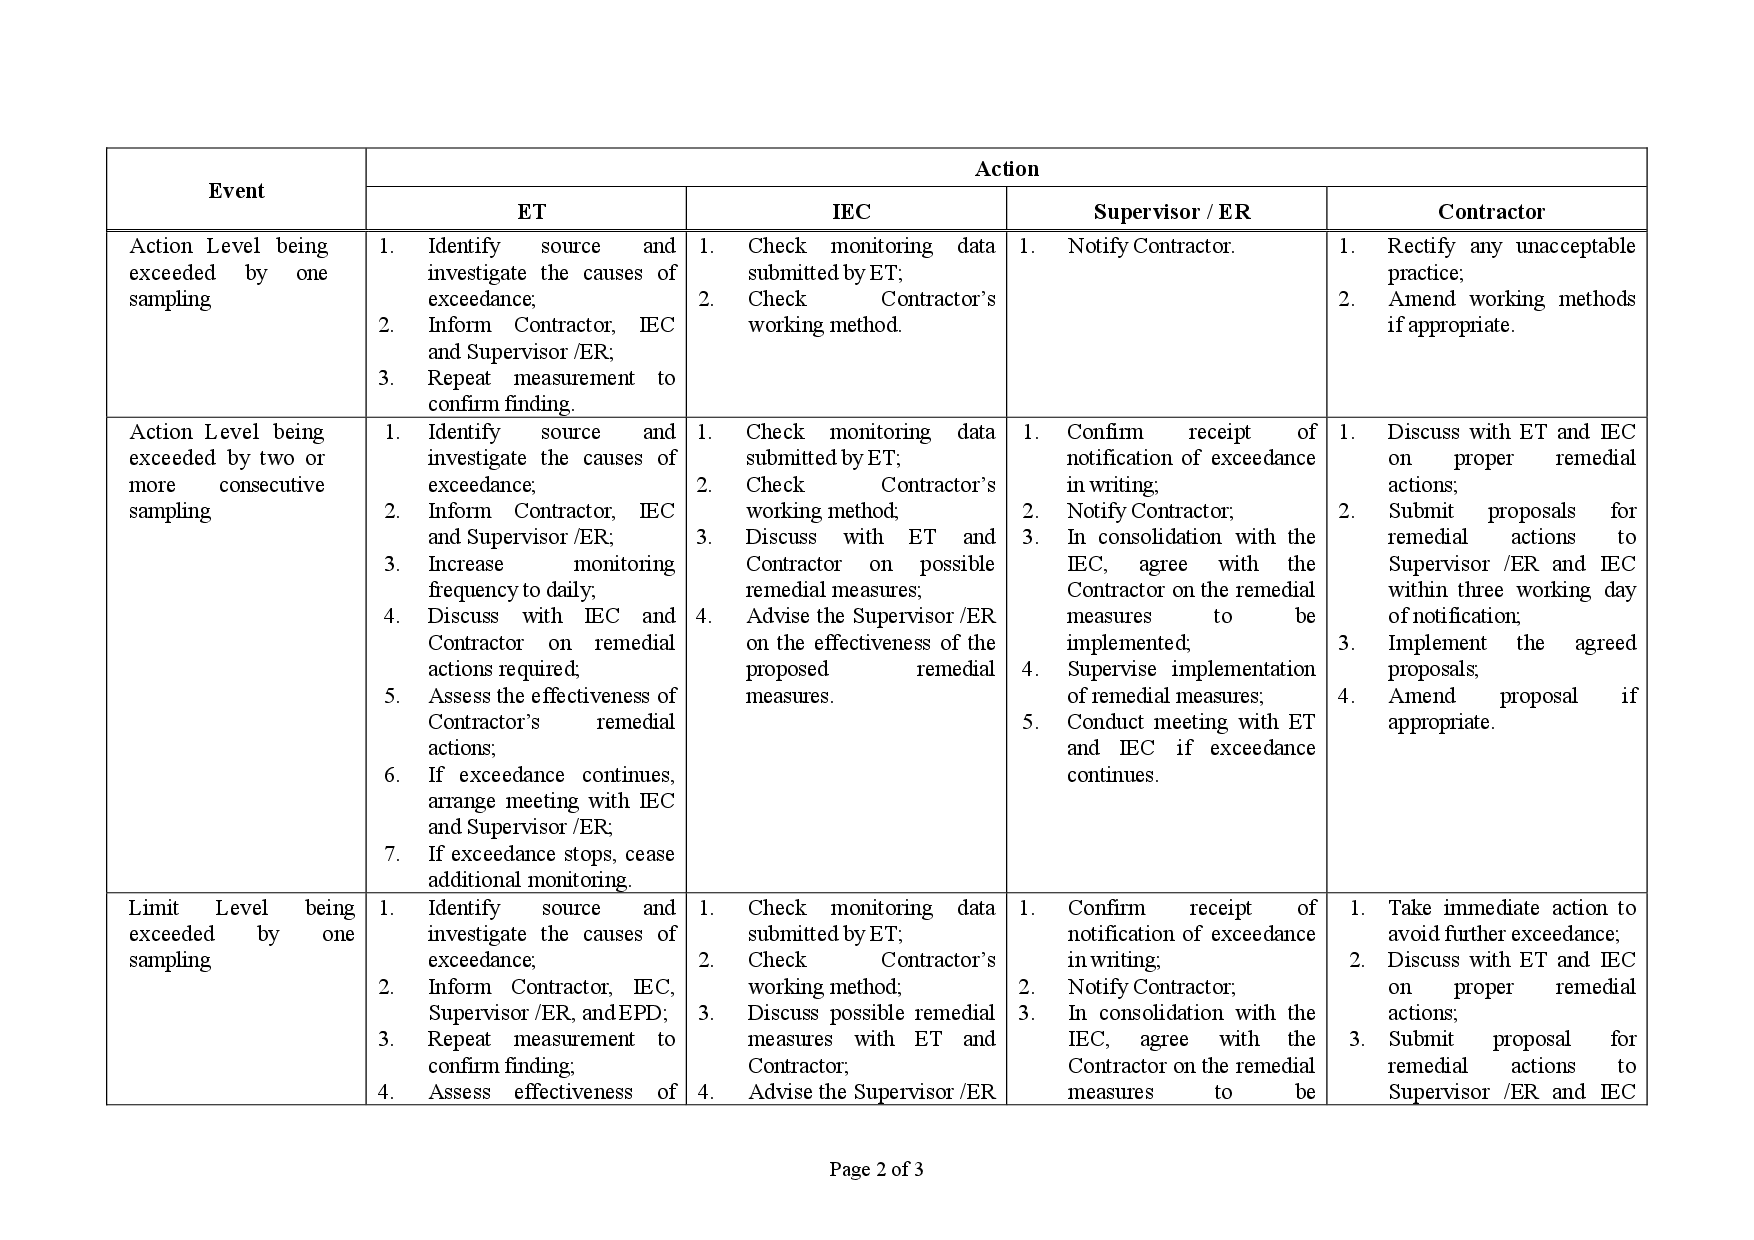
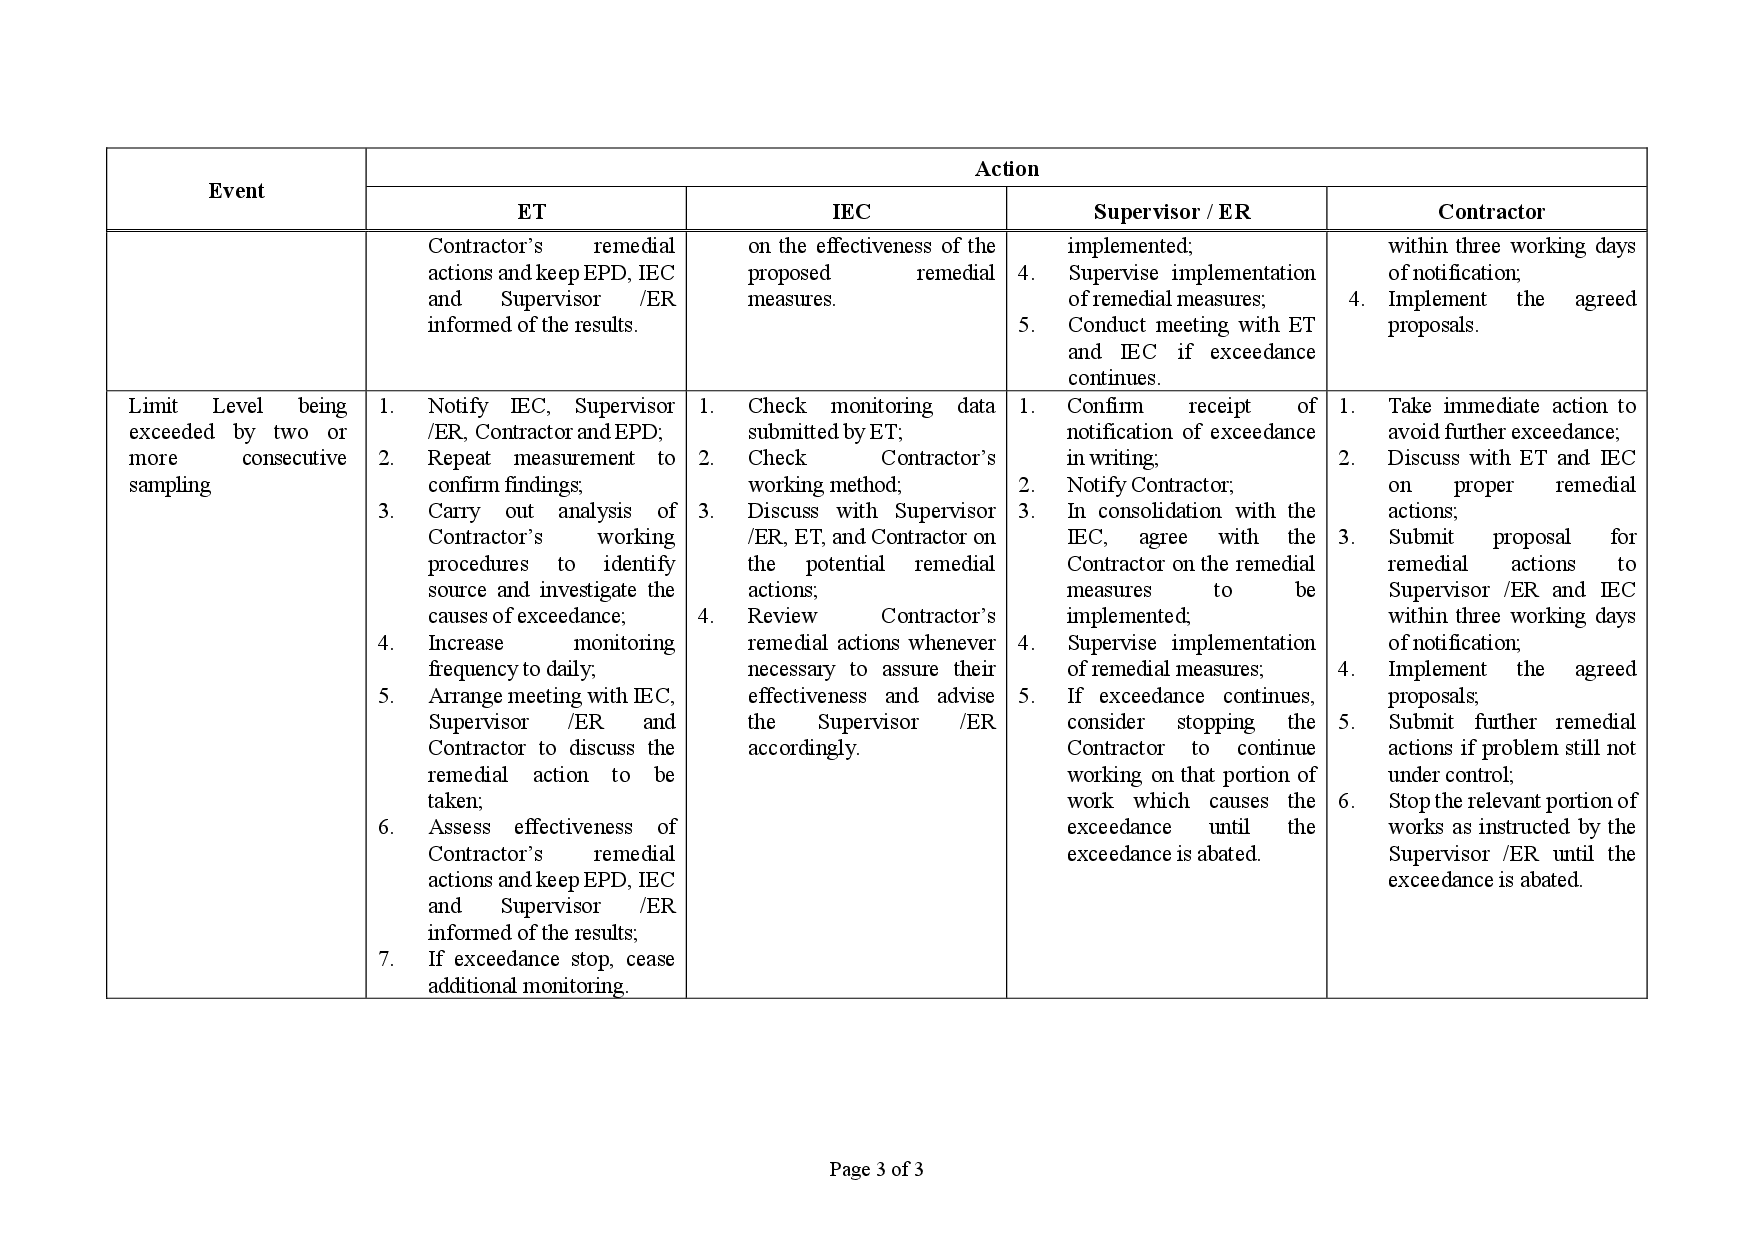
Appendix L – Event and Action Plan for noise
Appendix M – Event and Action Plan for Landscape and Visual Impact
Appendix N – Waste Flow Table
Appendix O – Environmental Licenses and Notification
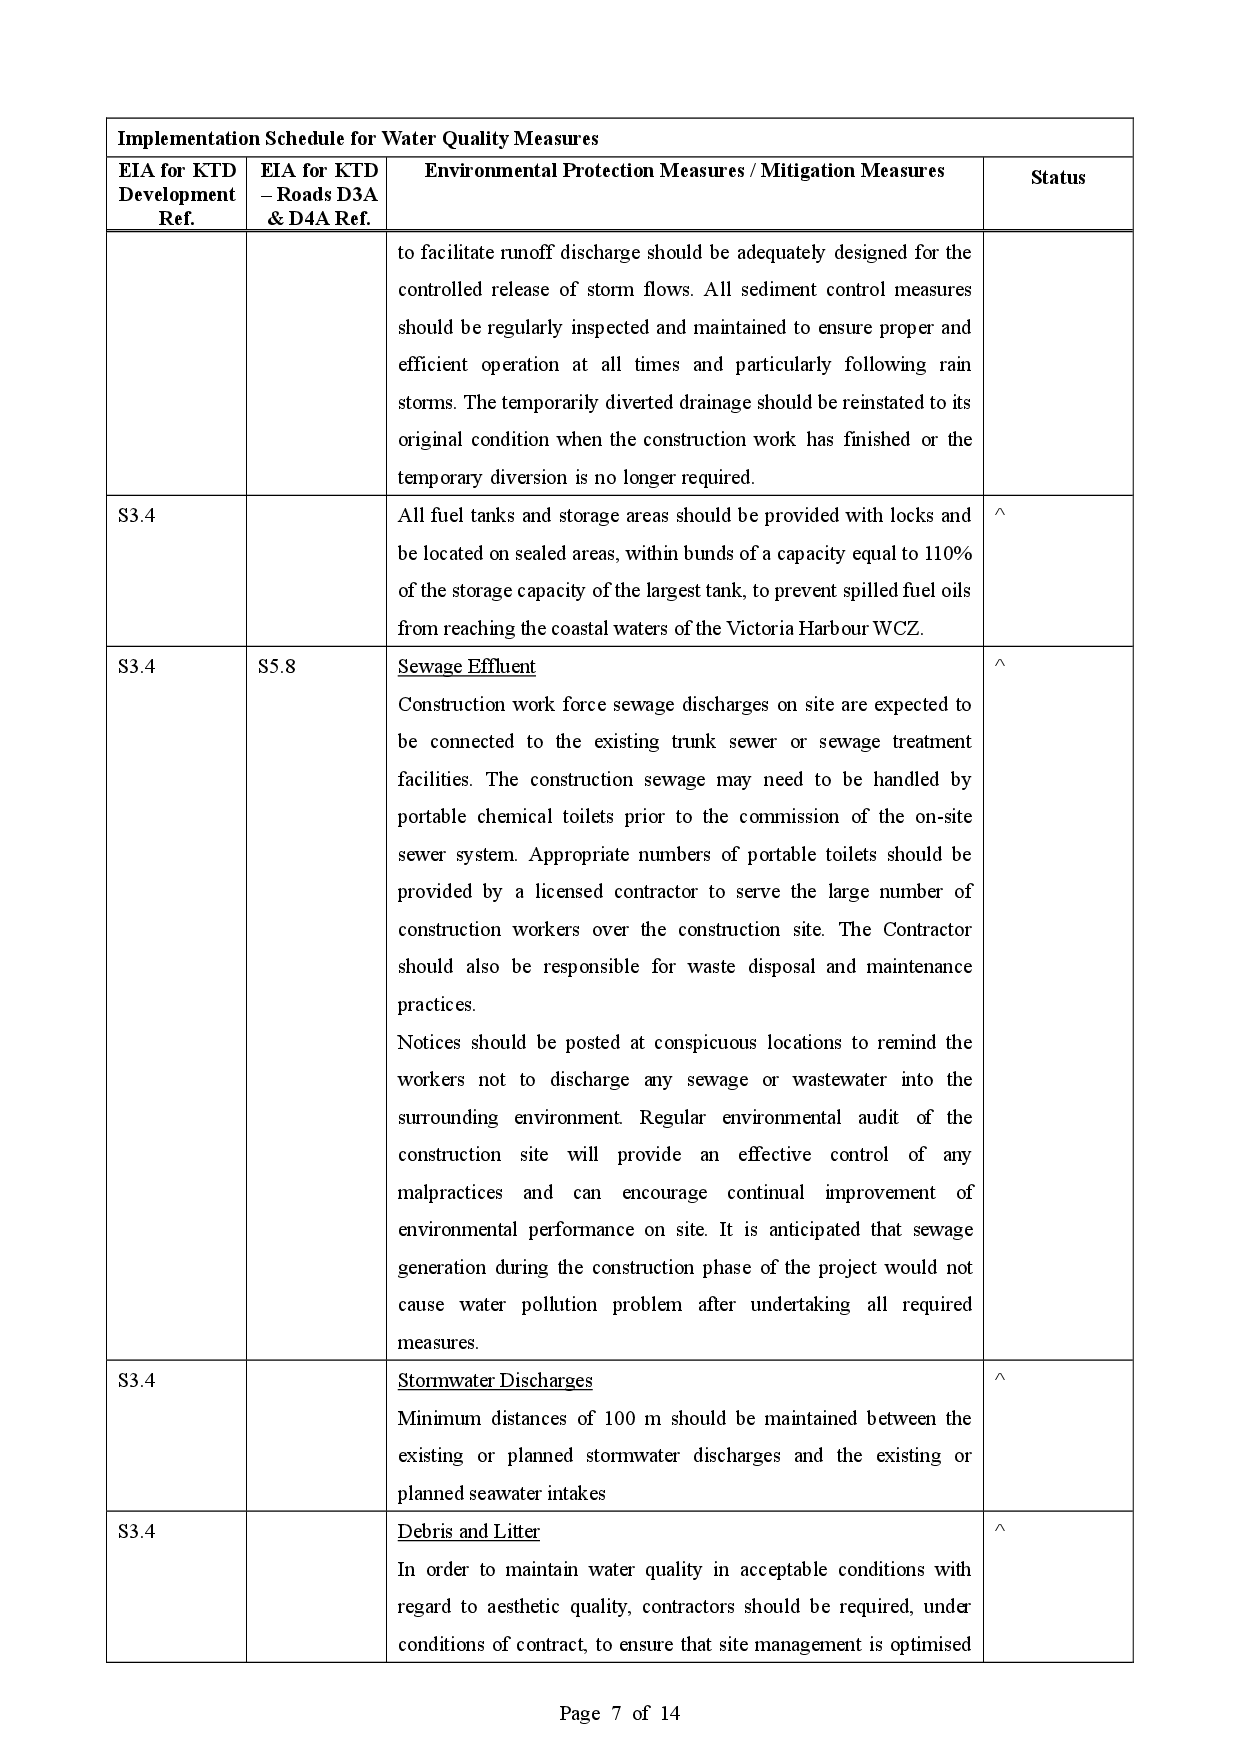
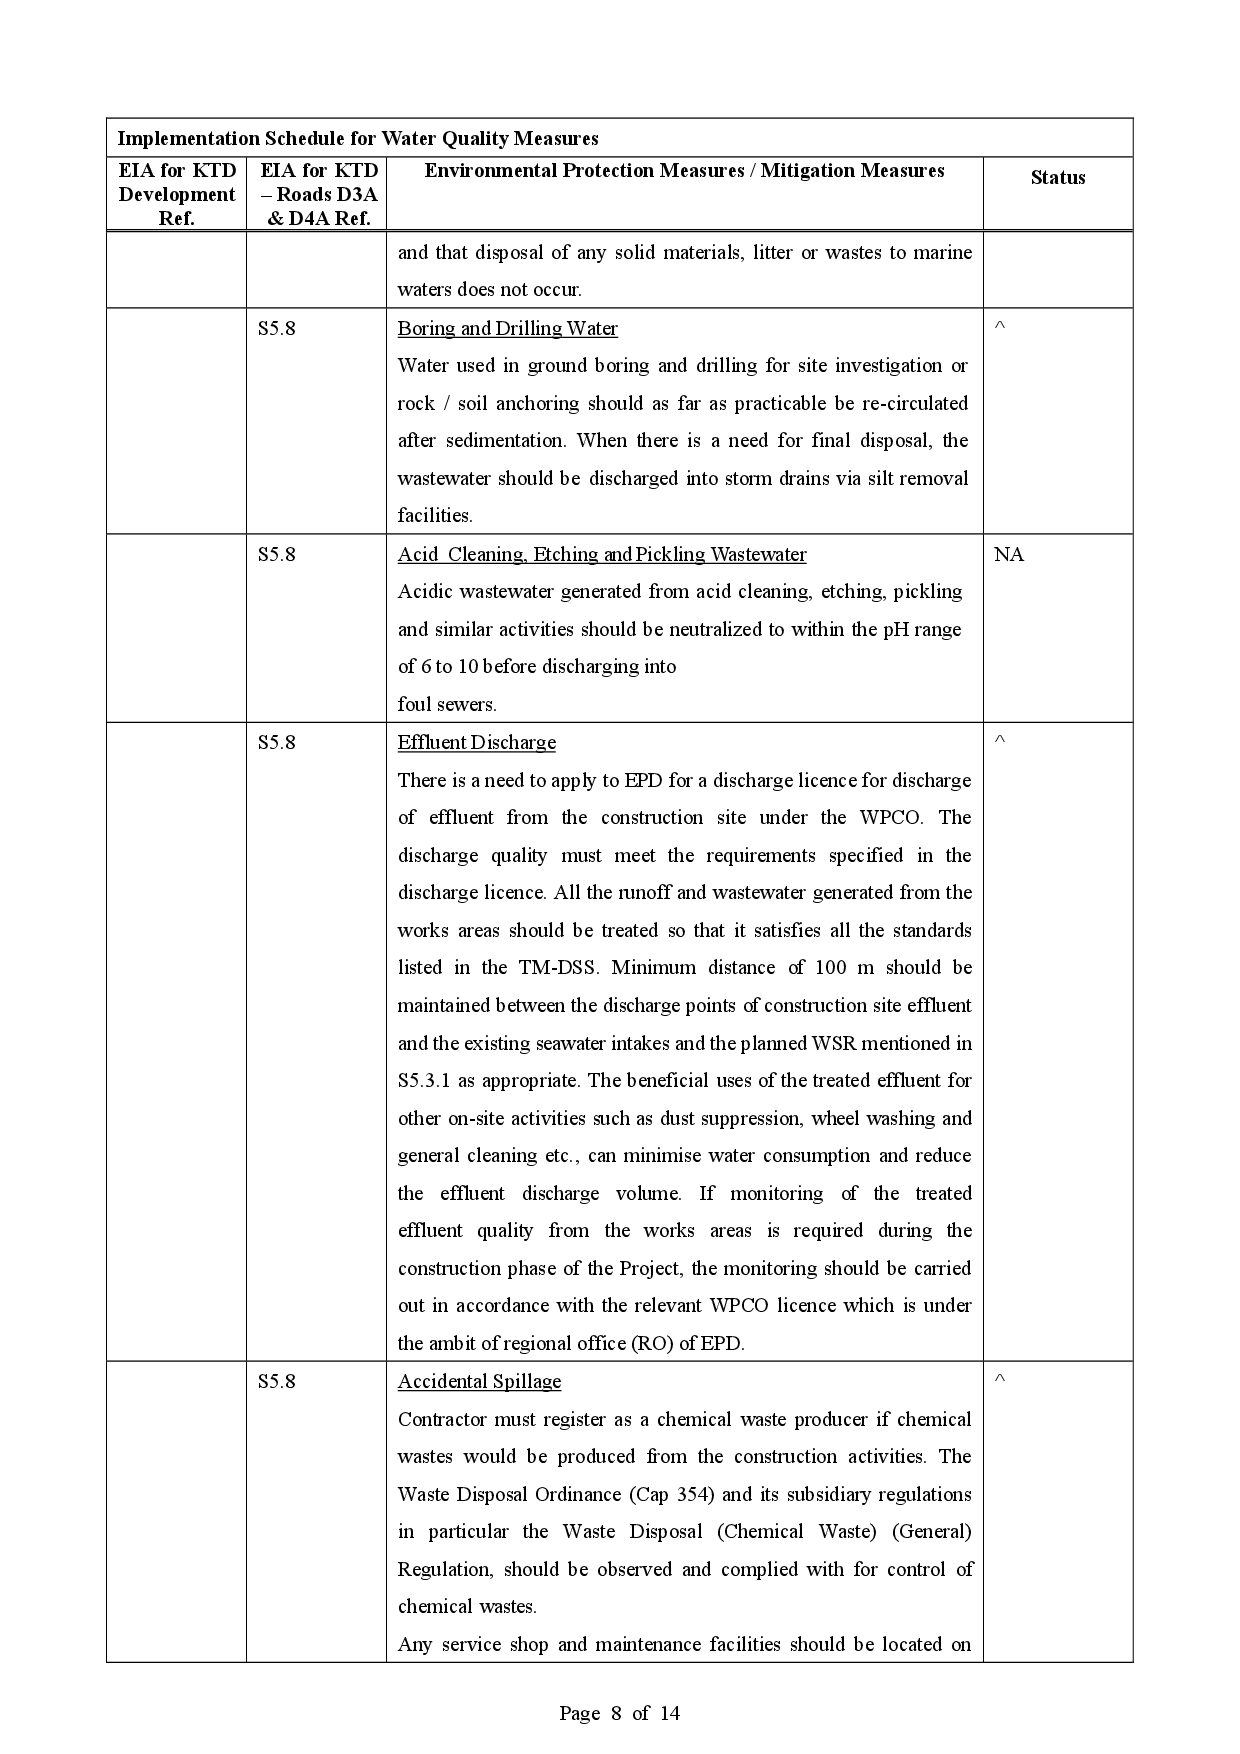
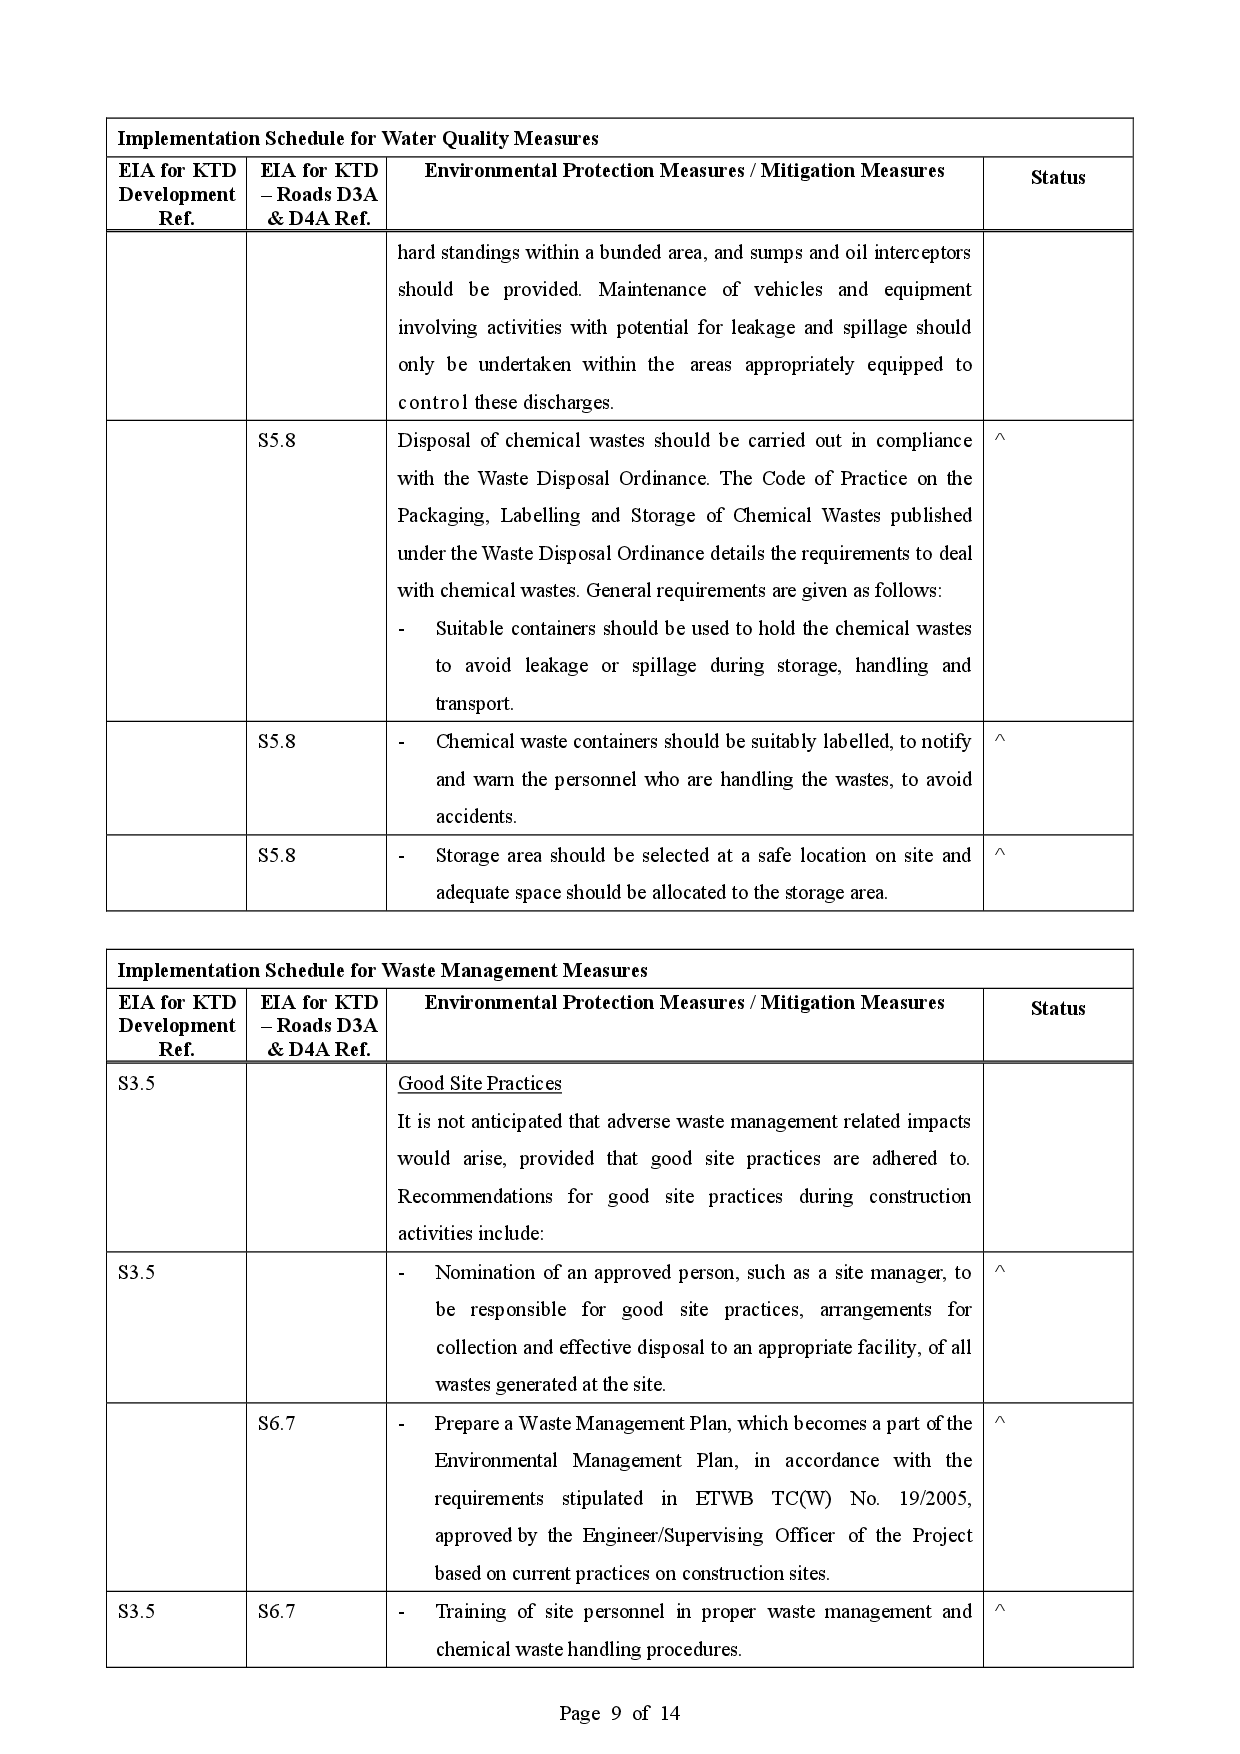
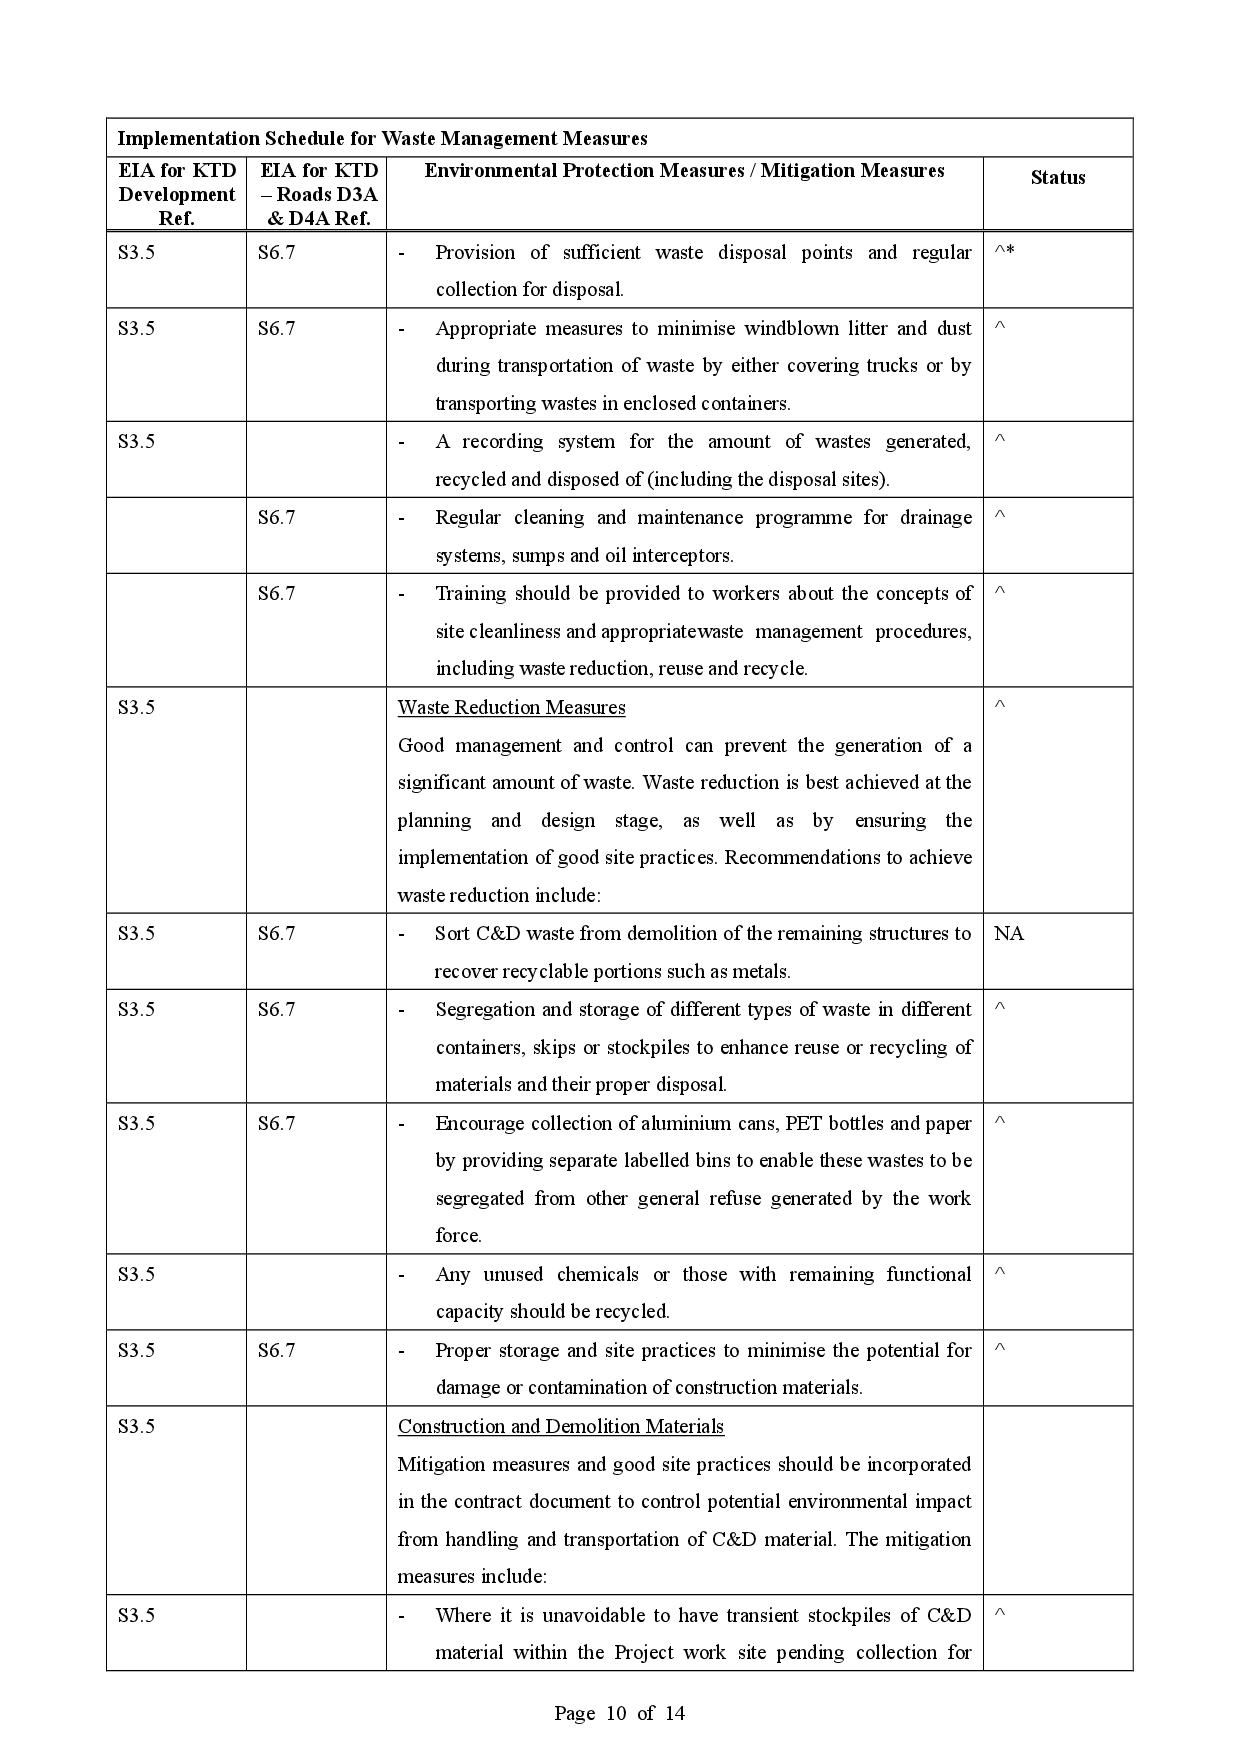
Appendix P – Environmental Mitigation Implementation Schedule (EMIS)
Appendix Q – Summaries of Environmental Complaint, Warning, Summon and Notification of Successful Prosecution
1. This is the 10th Monthly Environmental Monitoring & Audit (EM&A) report which summaries the findings of the EM&A Programme during the reporting period from 1 to 31 October 2020.
2. 1-hour TSP monitoring was conducted as scheduled in the reporting month. No Action/Limit Level exceedance was recorded.
3. 24-hour TSP monitoring was conducted as scheduled in the reporting month. No Action/Limit Level exceedance was recorded.
4. Construction noise monitoring was conducted as scheduled in the reporting month. No Action/Limit Level exceedance was recorded.
5. Summary of the non-compliance in the reporting month for the Project is tabulated in Table I.
|
Parameter |
No. of Exceedance |
Action Taken |
|
|
Action Level |
Limit Level |
||
|
1-hr TSP |
0 |
0 |
N/A |
|
24-hr TSP |
0 |
0 |
N/A |
|
Construction noise |
0 |
0 |
N/A |
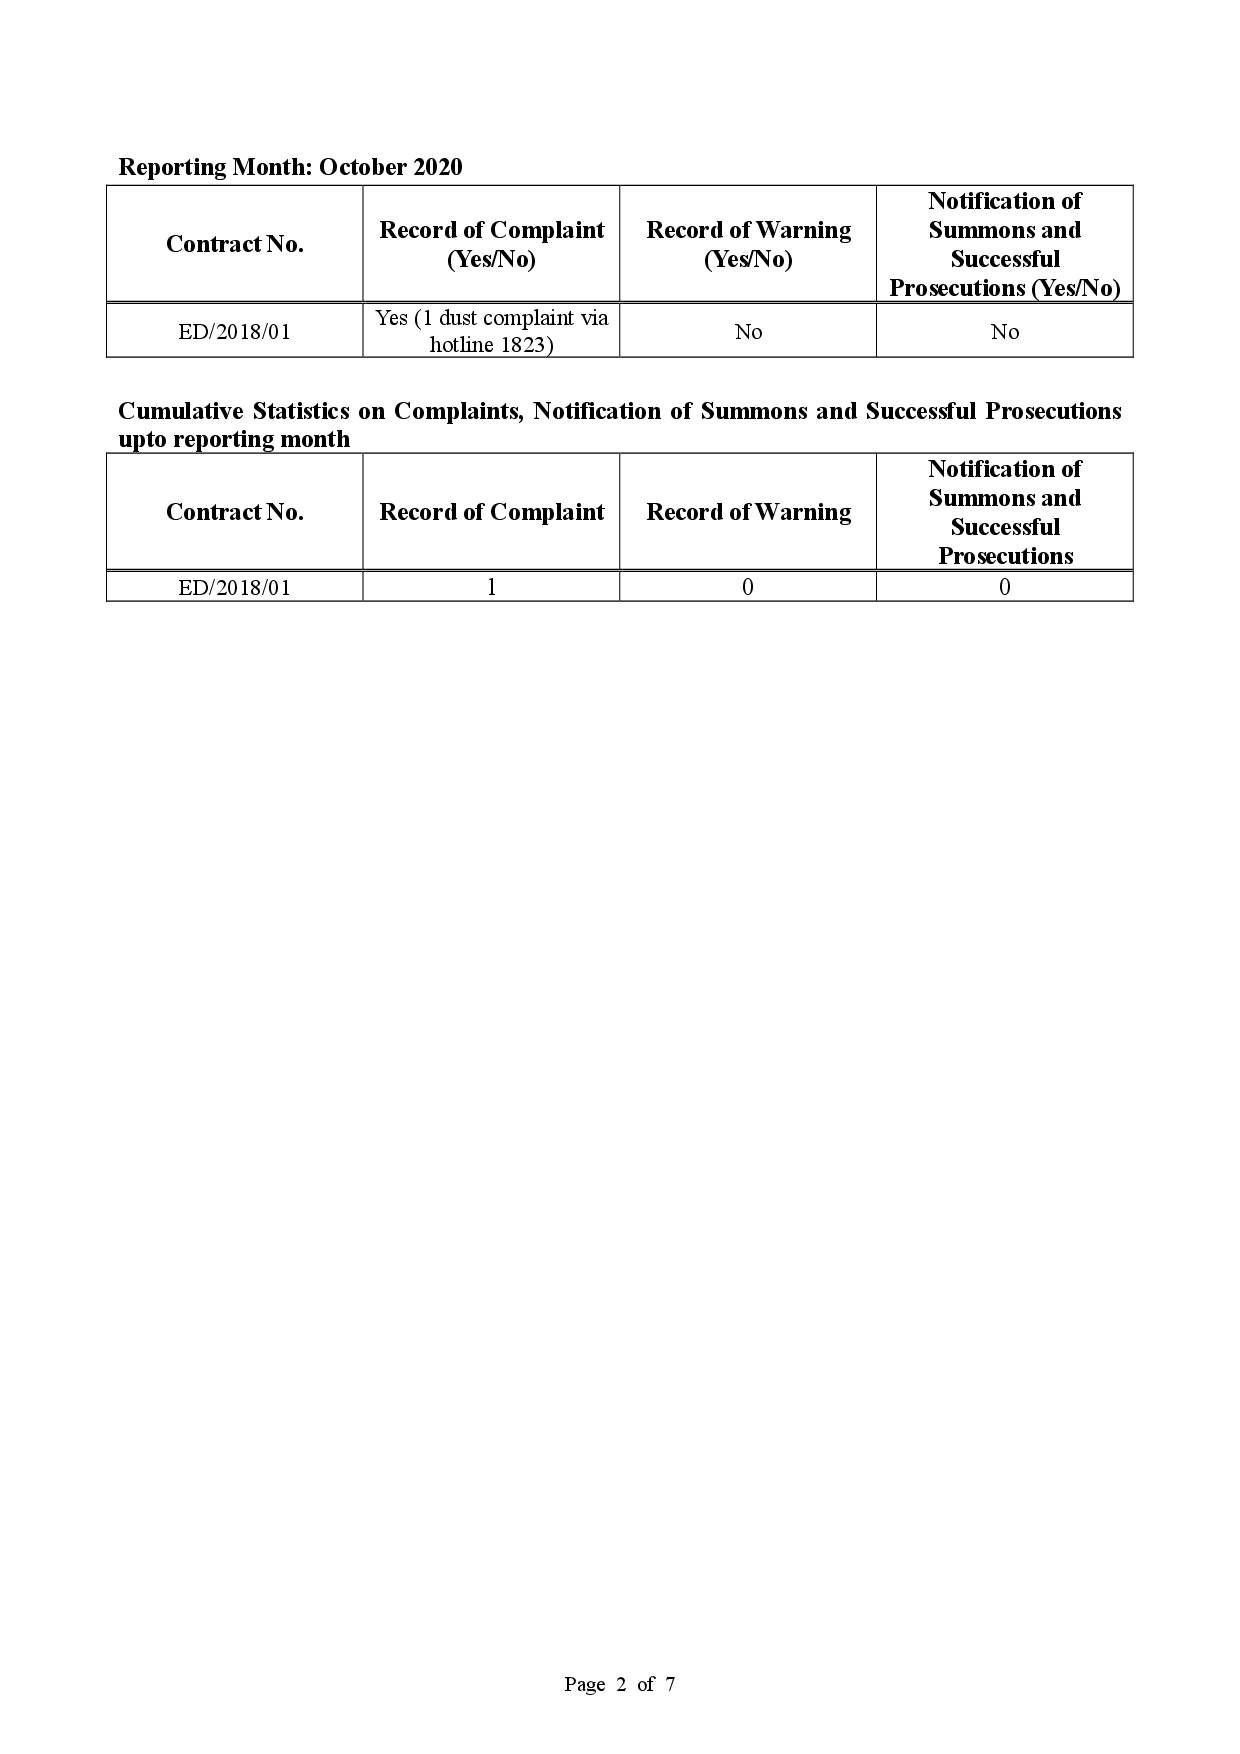
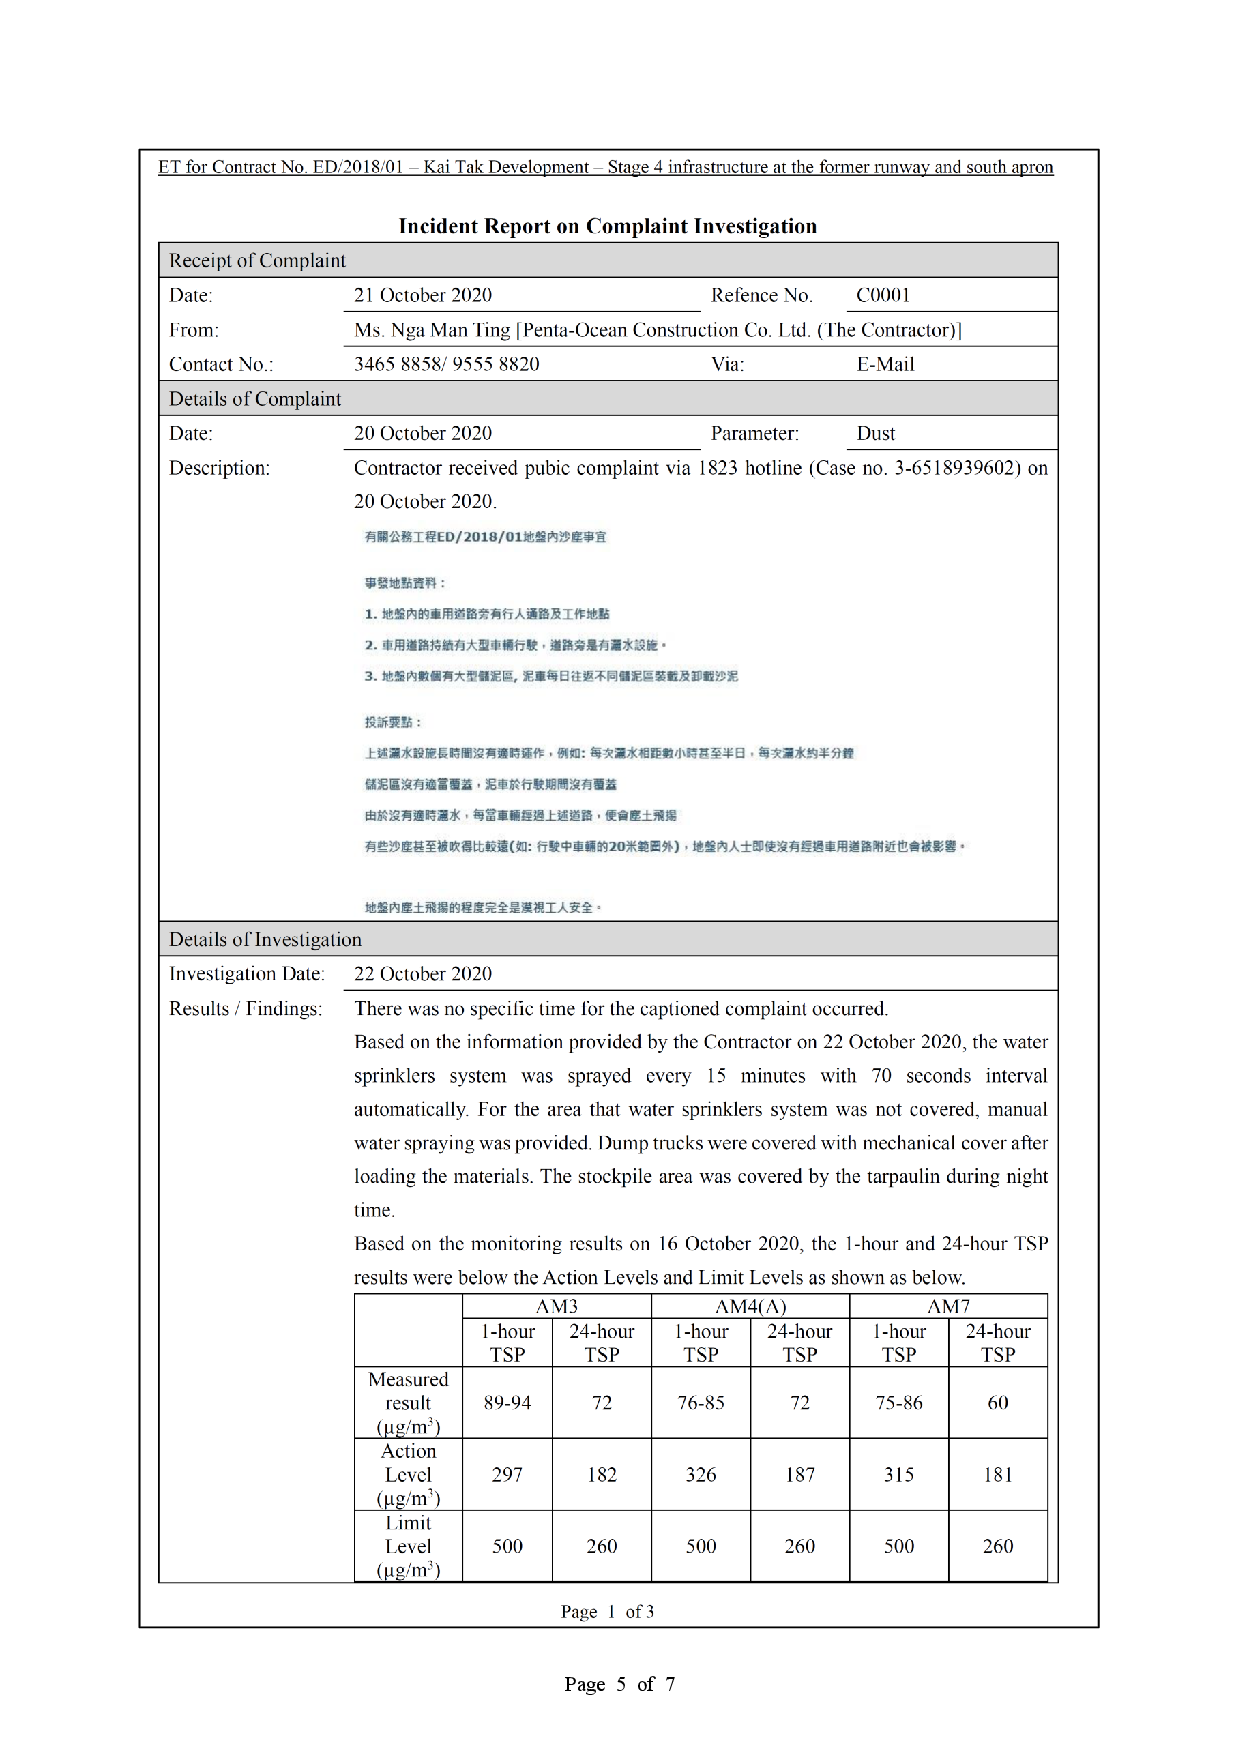
6. One dust complaint (received by hotline 1823 on 20 October 2020) was referred by the Contractor in the reporting month. Summary of complaints in the reporting month is tabulated in Table II.
|
Date of complaint received |
Date of complaint |
Description of complaint |
Investigation / Recommendations / Action take |
Close-out date / Status |
|
A dust complaint was referred from the Contractor on 21 October 2020. |
Contractor received pubic complaint via 1823 hotline (Case no. 3-6518939602) on 20 October 2020. |
1. The water spraying system was not operated in proper time. 2. Stockpile was not covered properly. 3. Haul road was not wetted. 4. Materials transported on trucks were not provided with mechanical covers. |
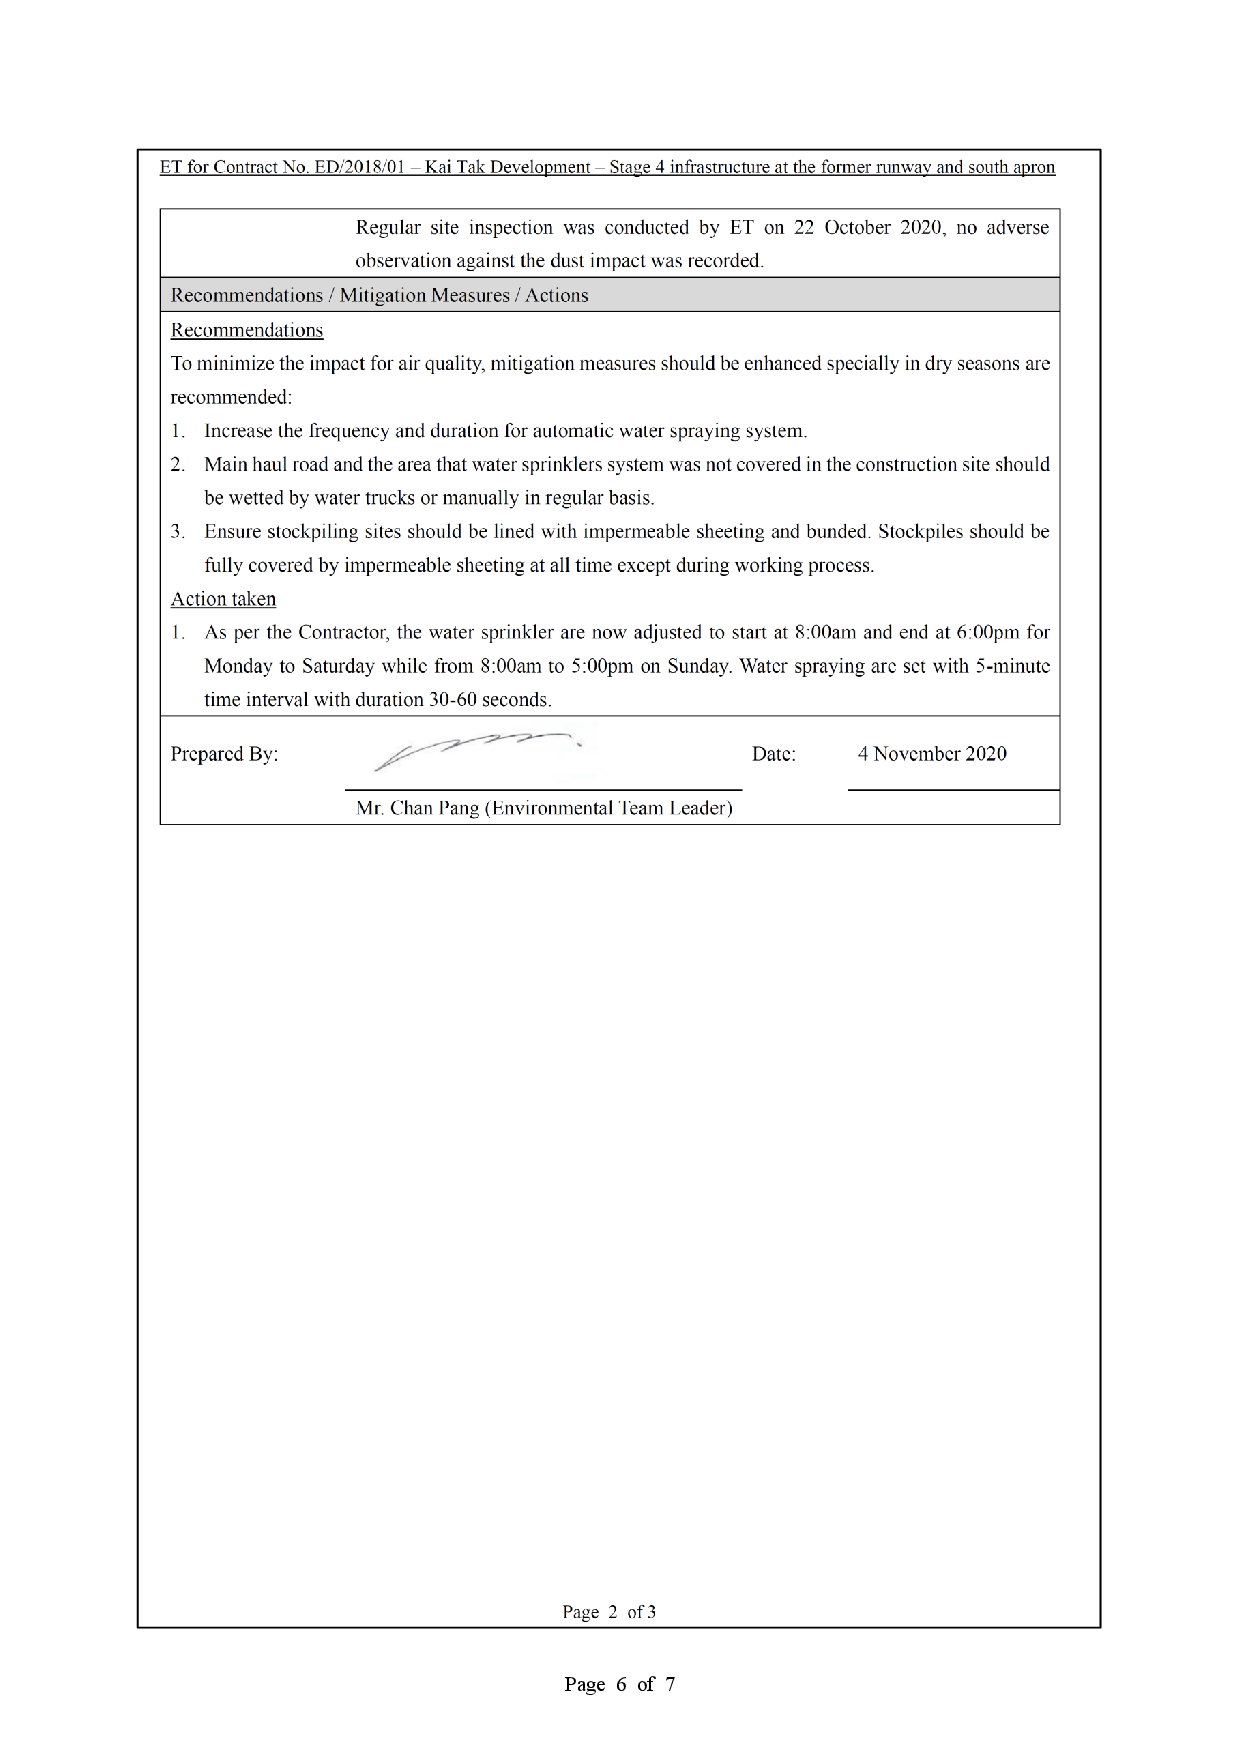
Investigation 1. Based on the information provided by the Contractor on 22 October 2020, the water sprinklers system was sprayed every 15 minutes with 70 seconds interval automatically. For the area that water sprinklers system was not covered, manual water spraying was provided. Dump trucks were covered with mechanical cover after loading the materials. The stockpile area was covered by the tarpaulin during night time. 2. Based on the monitoring results on 16 October 2020, the 1-hour and 24-hour TSP results were below the Action Levels and Limit Levels. 3. Regular site inspection was conducted by ET on 22 October 2020, no adverse observation against the dust impact was recorded.
Recommendations To minimize the impact for air quality, mitigation measures should be enhanced specially in dry seasons are recommended: 1. Increase the frequency and duration for automatic water spraying system. 2. Main haul road and the area that water sprinklers system was not covered in the construction site should be wetted by water trucks or manually in regular basis. 3. Ensure stockpiling sites should be lined with impermeable sheeting and bunded. Stockpiles should be fully covered by impermeable sheeting at all time except during working process.
Action taken As per the Contractor, the water sprinkler are now adjusted to start at 8:00am and end at 6:00pm for Monday to Saturday while from 8:00am to 5:00pm on Sunday. Water spraying are set with 5-minute time interval with duration 30-60 seconds. |
- Closed-out on 5 Nov 2020 - No further complaint was received. |
7. No notification of summons and successful prosecutions was received in the reporting month. Summary of summons and successful prosecutions in the reporting month is tabulated in Table III.
|
Date of receiving notification of summons or prosecutions |
Date of event |
Description of event |
Action take |
Close-out date / Status |
|
No notification of summons and successful prosecutions were received in the reporting month. |
NA |
NA |
NA |
NA |
8. There was no reporting change in the reporting month.
9. Major construction activities undertake during the reporting month included:
- Installation of Sheet Pile
- Pumping Test at North Depressed Road Cofferdam and South Depressed Road
- Construction of Bored Pile of Bridge D3 and Landscape Deck
- ELS Installation & Excavation for South Depressed Road
- Construction of base slab, walls and columns for North Approach Ramp
- Permanent Structure Construction for North Depressed Road
- Permanent Structure Construction for Pile Cap of Bridge D3
- Construction of Hoarding
10. The future key issues and potential impact in the coming month are given in Table IV.
|
Future key issues in the coming month |
Potential impact |
|
Installation of Sheet Pile |
Noise and Air Quality |
|
Pumping Test at North Depressed Road Cofferdam and South Depressed Road |
Noise |
|
Permanent Structure Construction for Pile Cap |
Noise and Air Quality |
|
ELS Installation & Excavation for South Depressed Road |
Noise and Air Quality |
|
Construction of base slab, walls and columns for North Approach Ramp |
Noise and Air Quality |
|
Permanent Structure Construction for North Depressed Road |
Noise and Air Quality |
|
Erection of Temporary Working Platform |
Noise and Air Quality |
1.1 The Kai Tak Development (KTD) is located in the south-eastern part of Kowloon Peninsula of the HKSAR, comprising the apron and runway areas of the former Kai Tak Airport and existing waterfront areas at To Kwa Wan, Ma Tau Kok, Kowloon Bay, Kwun Tong and Cha Kwo Ling.
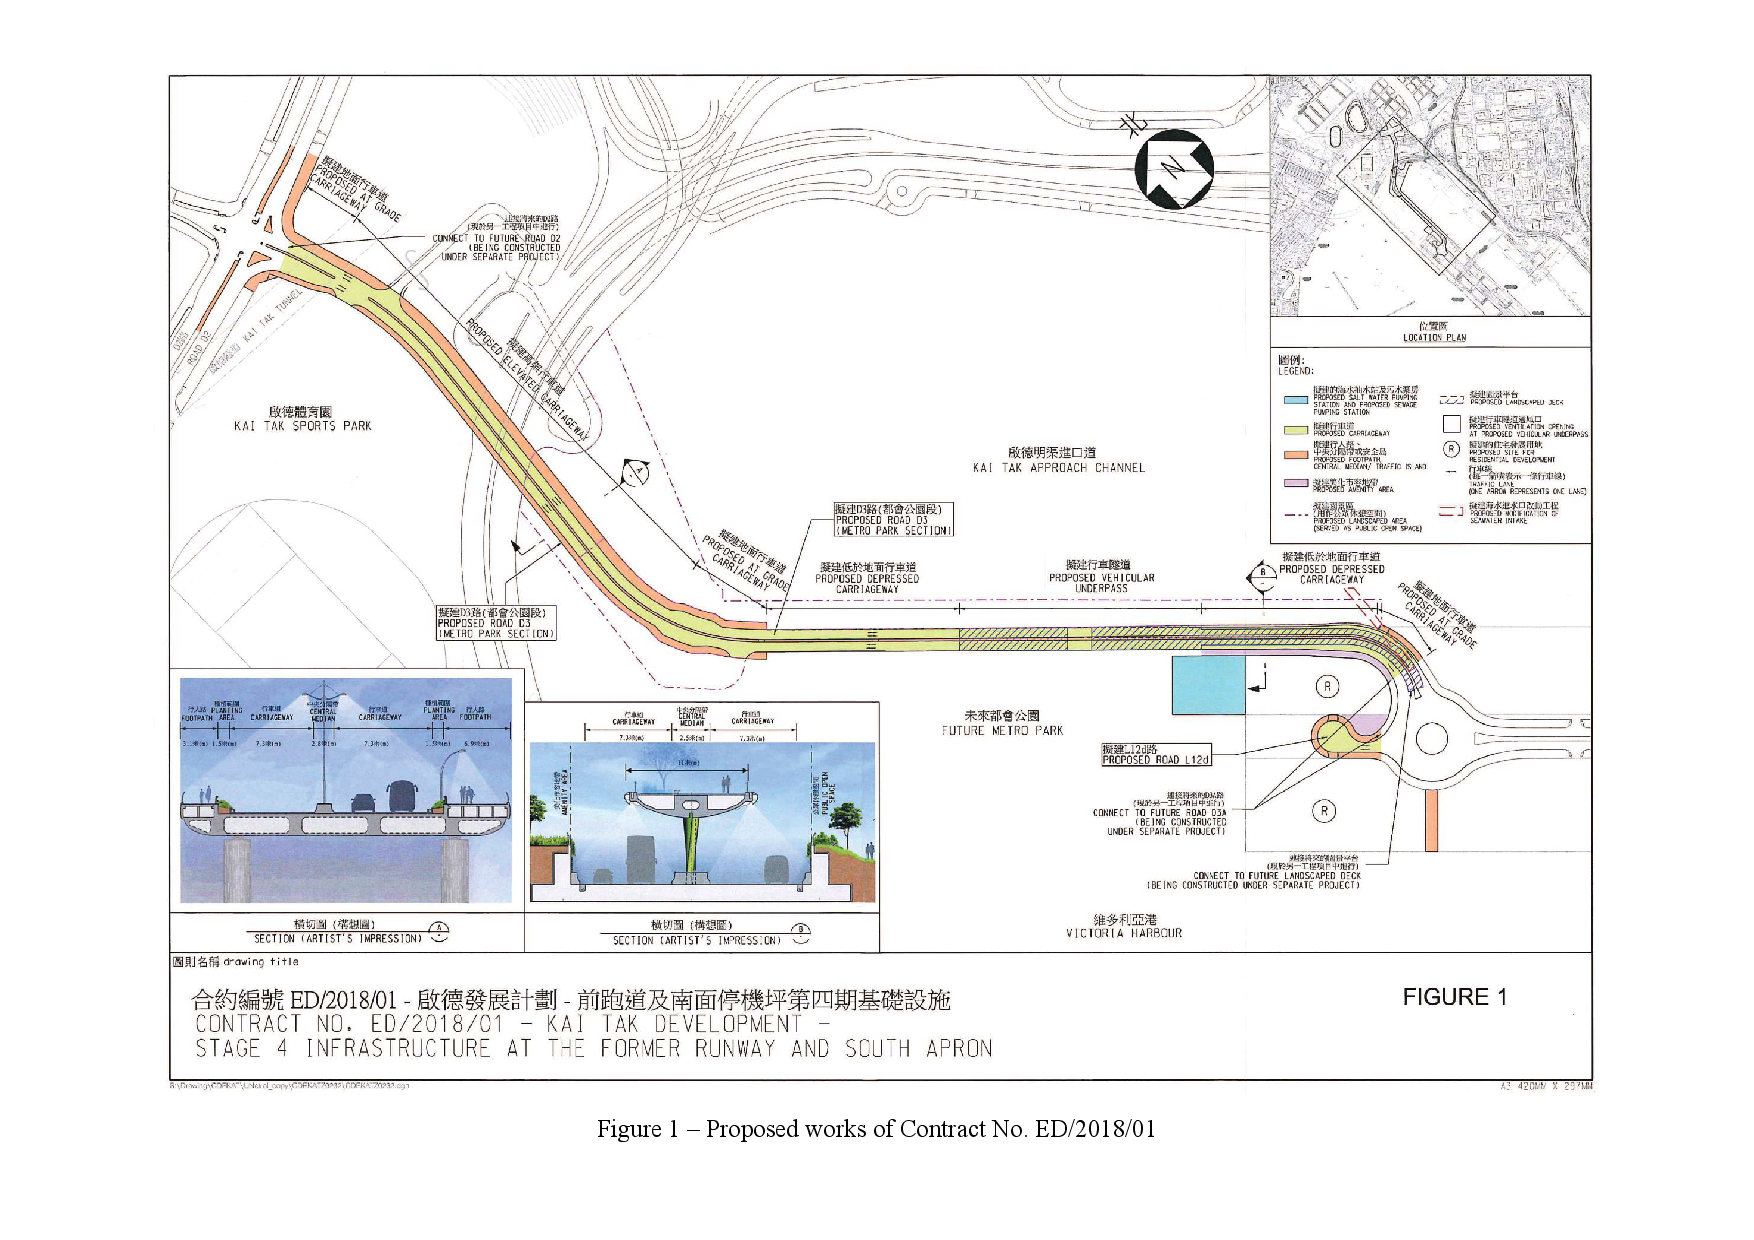
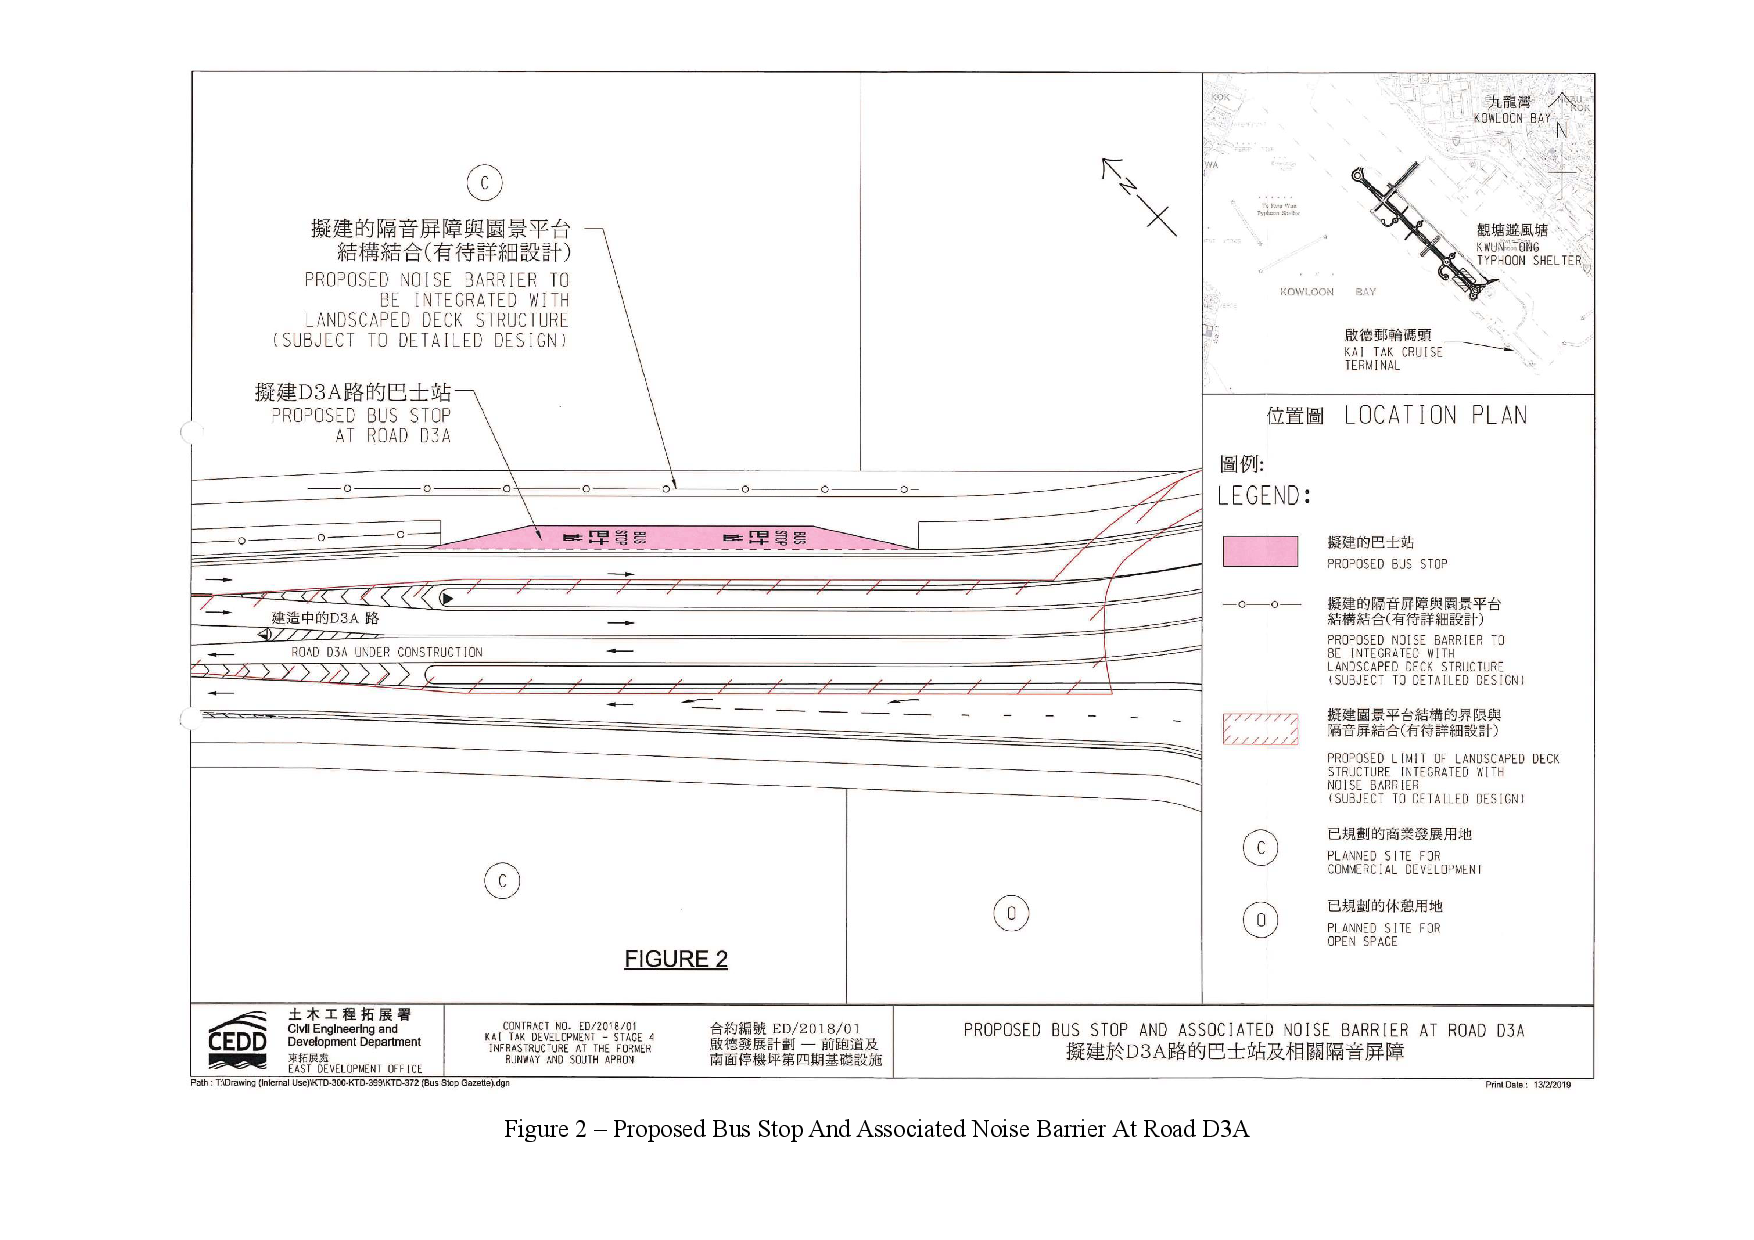
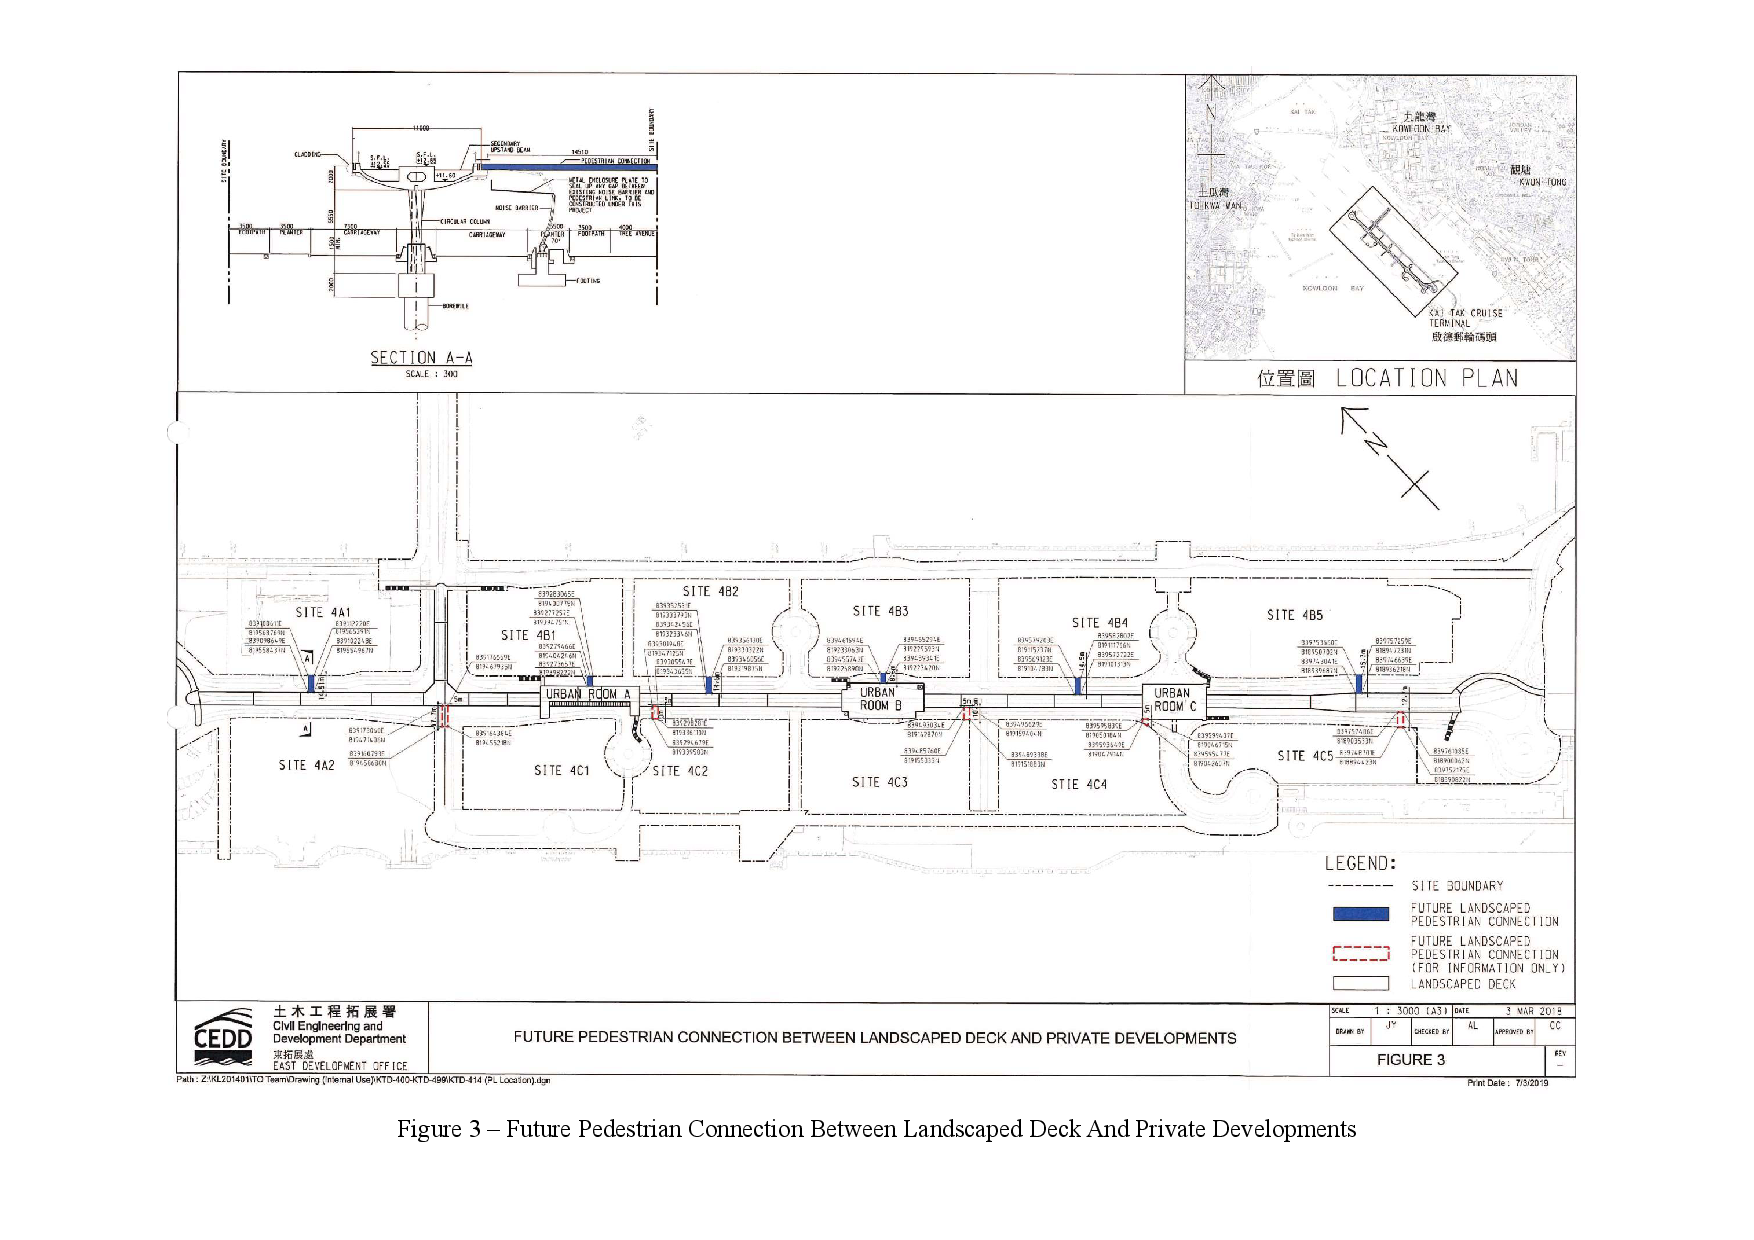
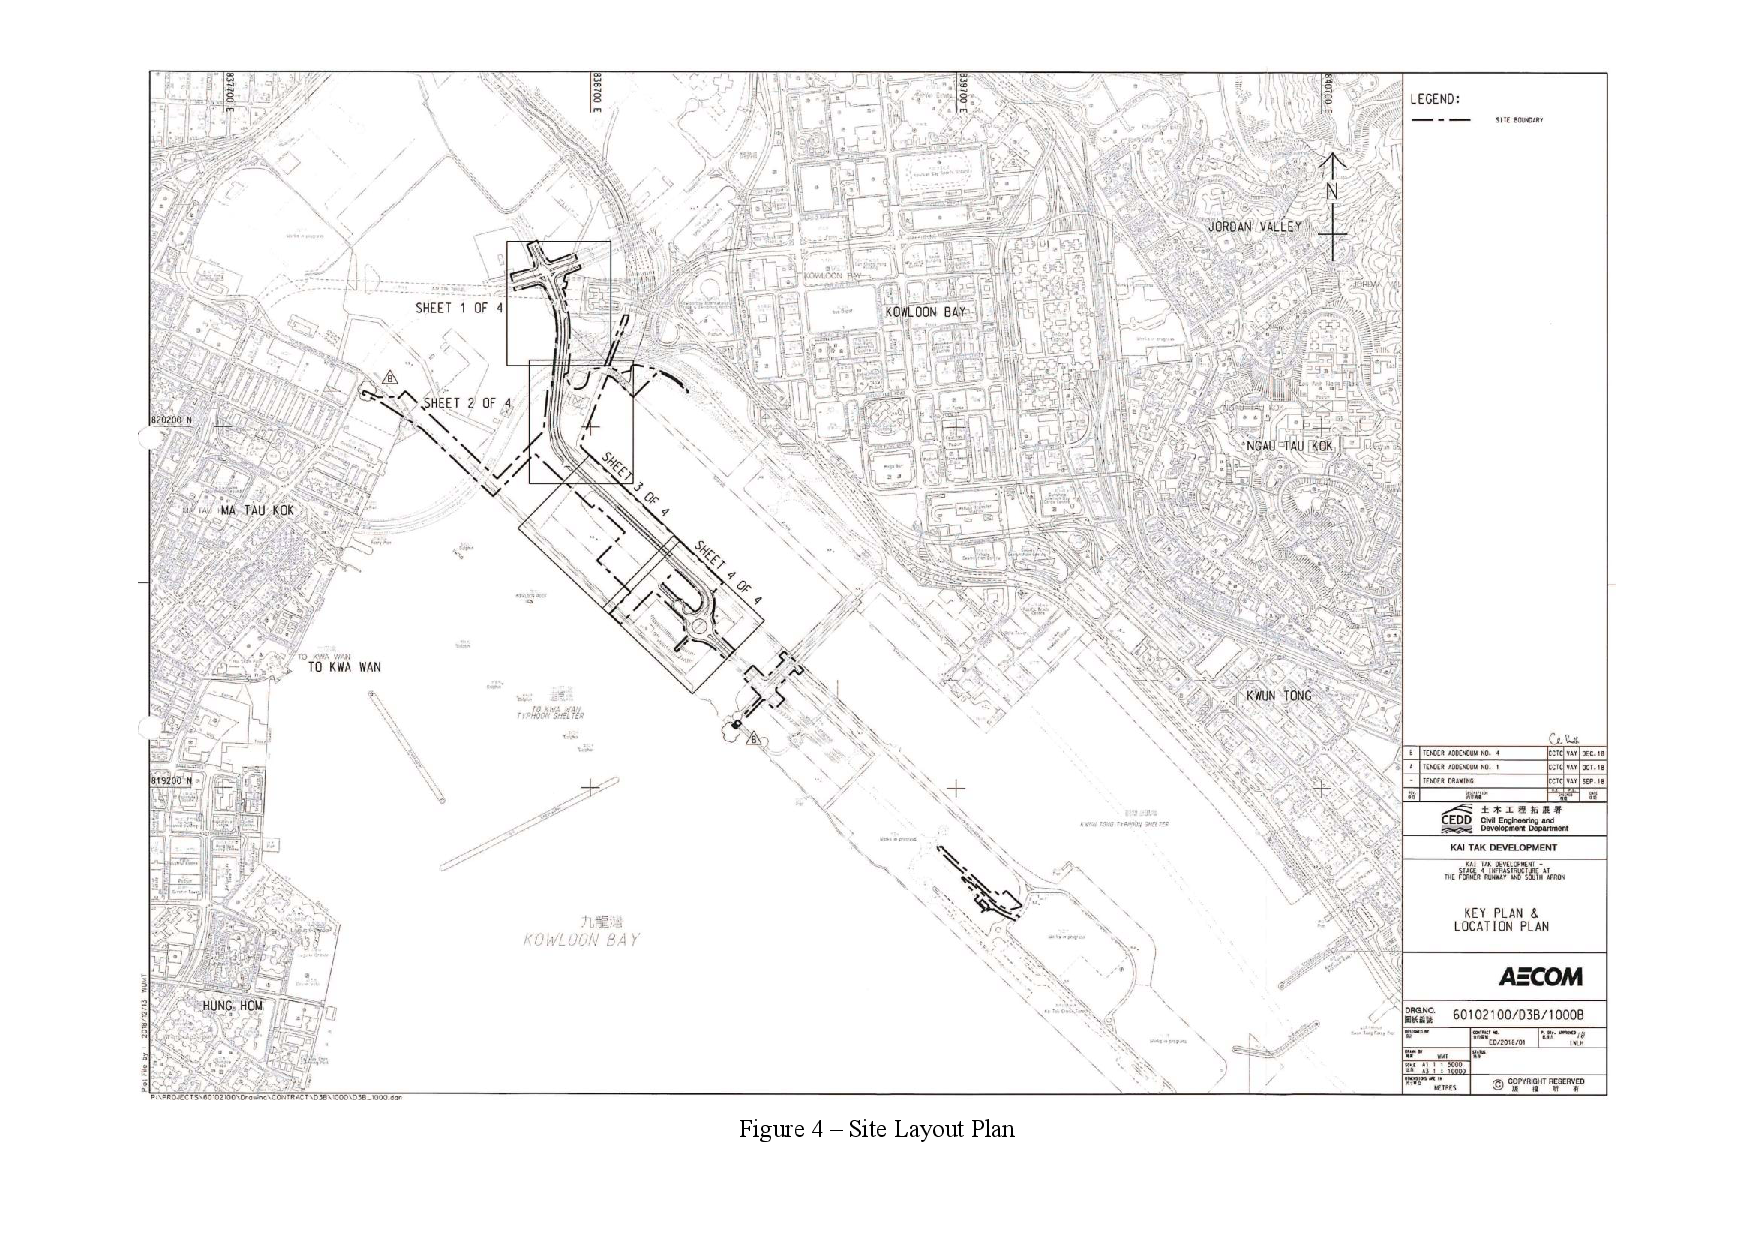
1.2 Contract No. ED/2018/01 - Kai Tak Development – stage 4 infrastructure at the former runway and south apron (The Project), comprises mainly the design and construction of a dual two- lane Road D3 (Metro Park Section), a single 2-lane Road L12d, a salt water pumping station, a sewage pumping station, landscaped deck and promenade above and adjoining Road D3 (Metro Park Section) respectively, some remaining road works at Road L14, noise barrier at Road D3A, and other associated works at the former runway and south apron. The proposed works are shown in Figure 1 and Figure 2. During the course of the Contract No. ED/2018/01, there may be modification of noise barriers in association with the construction of footbridges connecting to the landscaped deck of Road D3A by developers of adjacent lands (Figure 3). The proposed works and site boundary are shown in Figure 4.
1.3 Civil Engineering and Development Department (CEDD) had completed an Environmental Impact Assessment (EIA) and is the Permit Holder.
1.4 The construction work under ED/2018/01 comprises the EM&A Manuals (EIA Register Nos. AEIAR-130/2009 for Kai Tak Development and EIA Register Nos. AEIAR-170/2013 for Roads D3A and D4A) and Environmental Permit (EP) Nos. EP-337/2009, EP-445/2013 and Variation to the EP (VEP) No. EP-445/2013/A.
1.5 Air quality and noise monitoring has been proposed in the EM&A Manual with EIA Register Nos. AEIAR-130/2009 for Kai Tak Development while no air quality and noise monitoring are proposed in EM&A Manual with EIA Register Nos. AEIAR-170/2013 for Roads D3A and D4A.
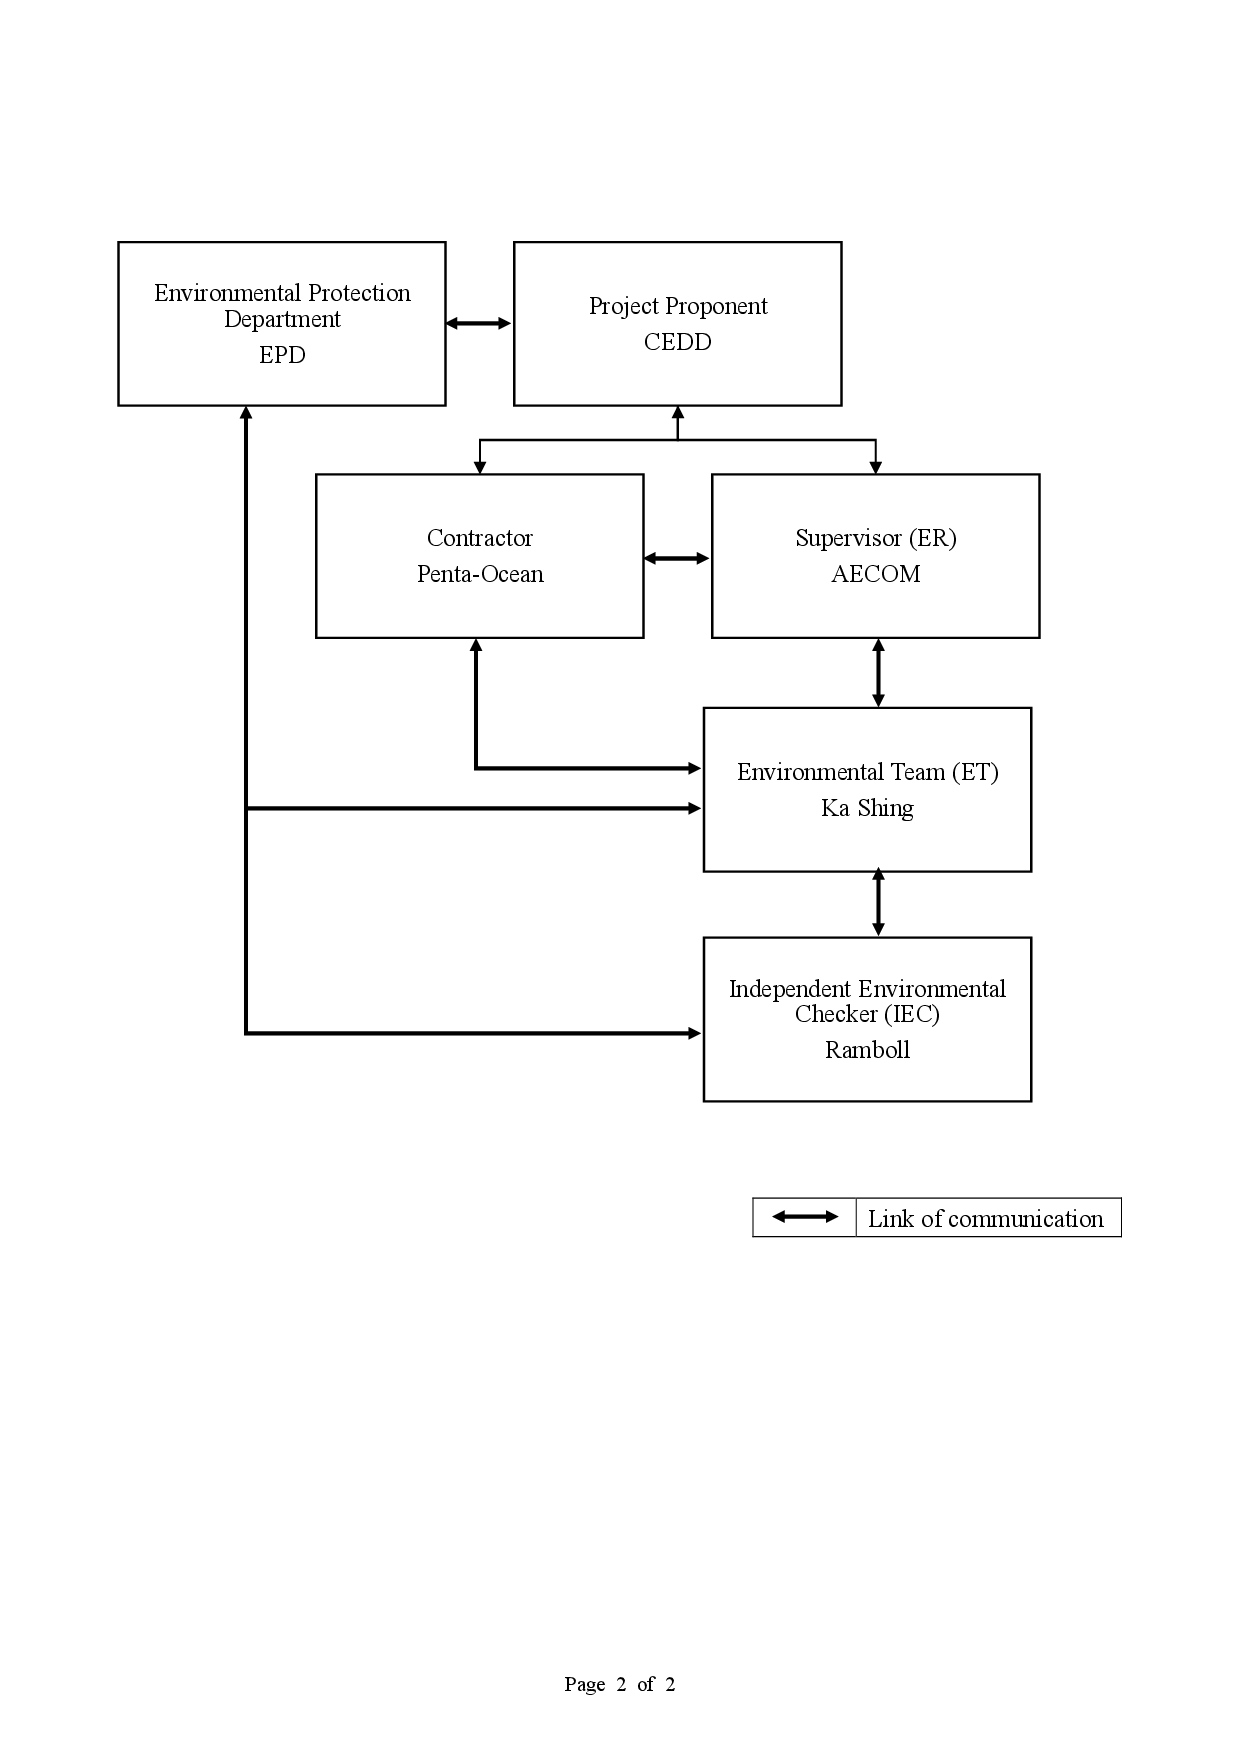
1.6 The project organization chart and with respect to the EM&A programme is shown in Appendix A. Information of key personnel contact names and telephone numbers are summarized in Table 1.1.
|
Party |
Role |
Contact Person |
Position |
Phone No. |
Fax No. |
|
Civil Engineering and Development Department (CEDD) |
Project Proponent |
Mr. Ronald Siu |
Senior Engineer |
3579 2452 |
2739 0076 |
|
Mr. Edwin Chan |
Engineer |
3579 2458 |
2739 0076 |
||
|
AECOM Asia Co. Ltd. (AECOM) |
Supervisor (act as Engineers’ Representative (ER) listed in EM&A Manual) |
Mr. Clive Cheng |
CRE |
3911 4201 |
3911 4288 |
|
Ramboll Hong Kong Limited (Ramboll) |
Independent Environmental Checker (IEC) |
Mr. Manson Yeung |
IEC |
9700 6767 |
3465 2899 |
|
Ka Shing Management Consultant Limited (Ka Shing) |
Environmental Team (ET) |
Mr. Chan Pang |
ET Leader |
6082 2973 |
2120 7752 |
|
Penta-Ocean Construction Co., Ltd. (Penta-Ocean) |
Contractor |
Ms. Juliet Ting |
Environmental Officer |
9555 8820 |
3465 8898 |
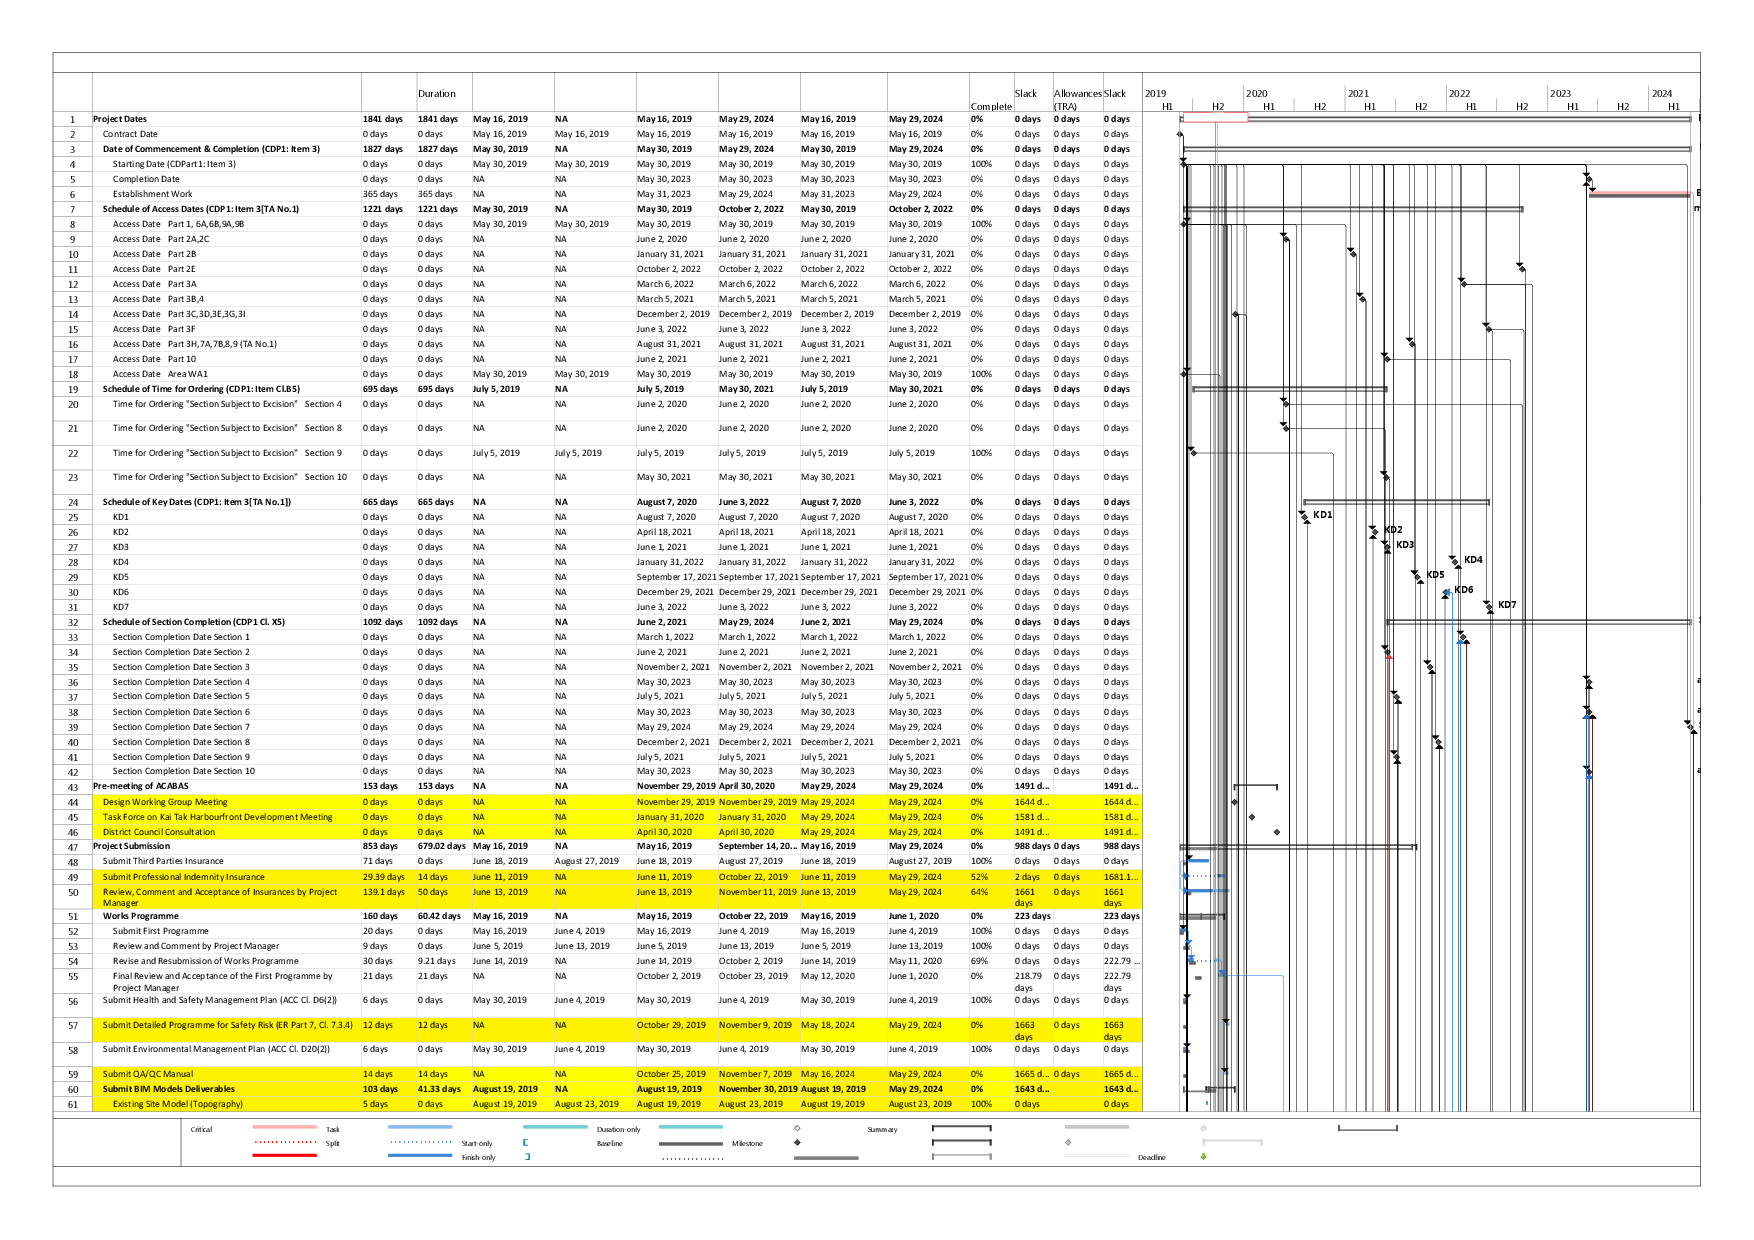
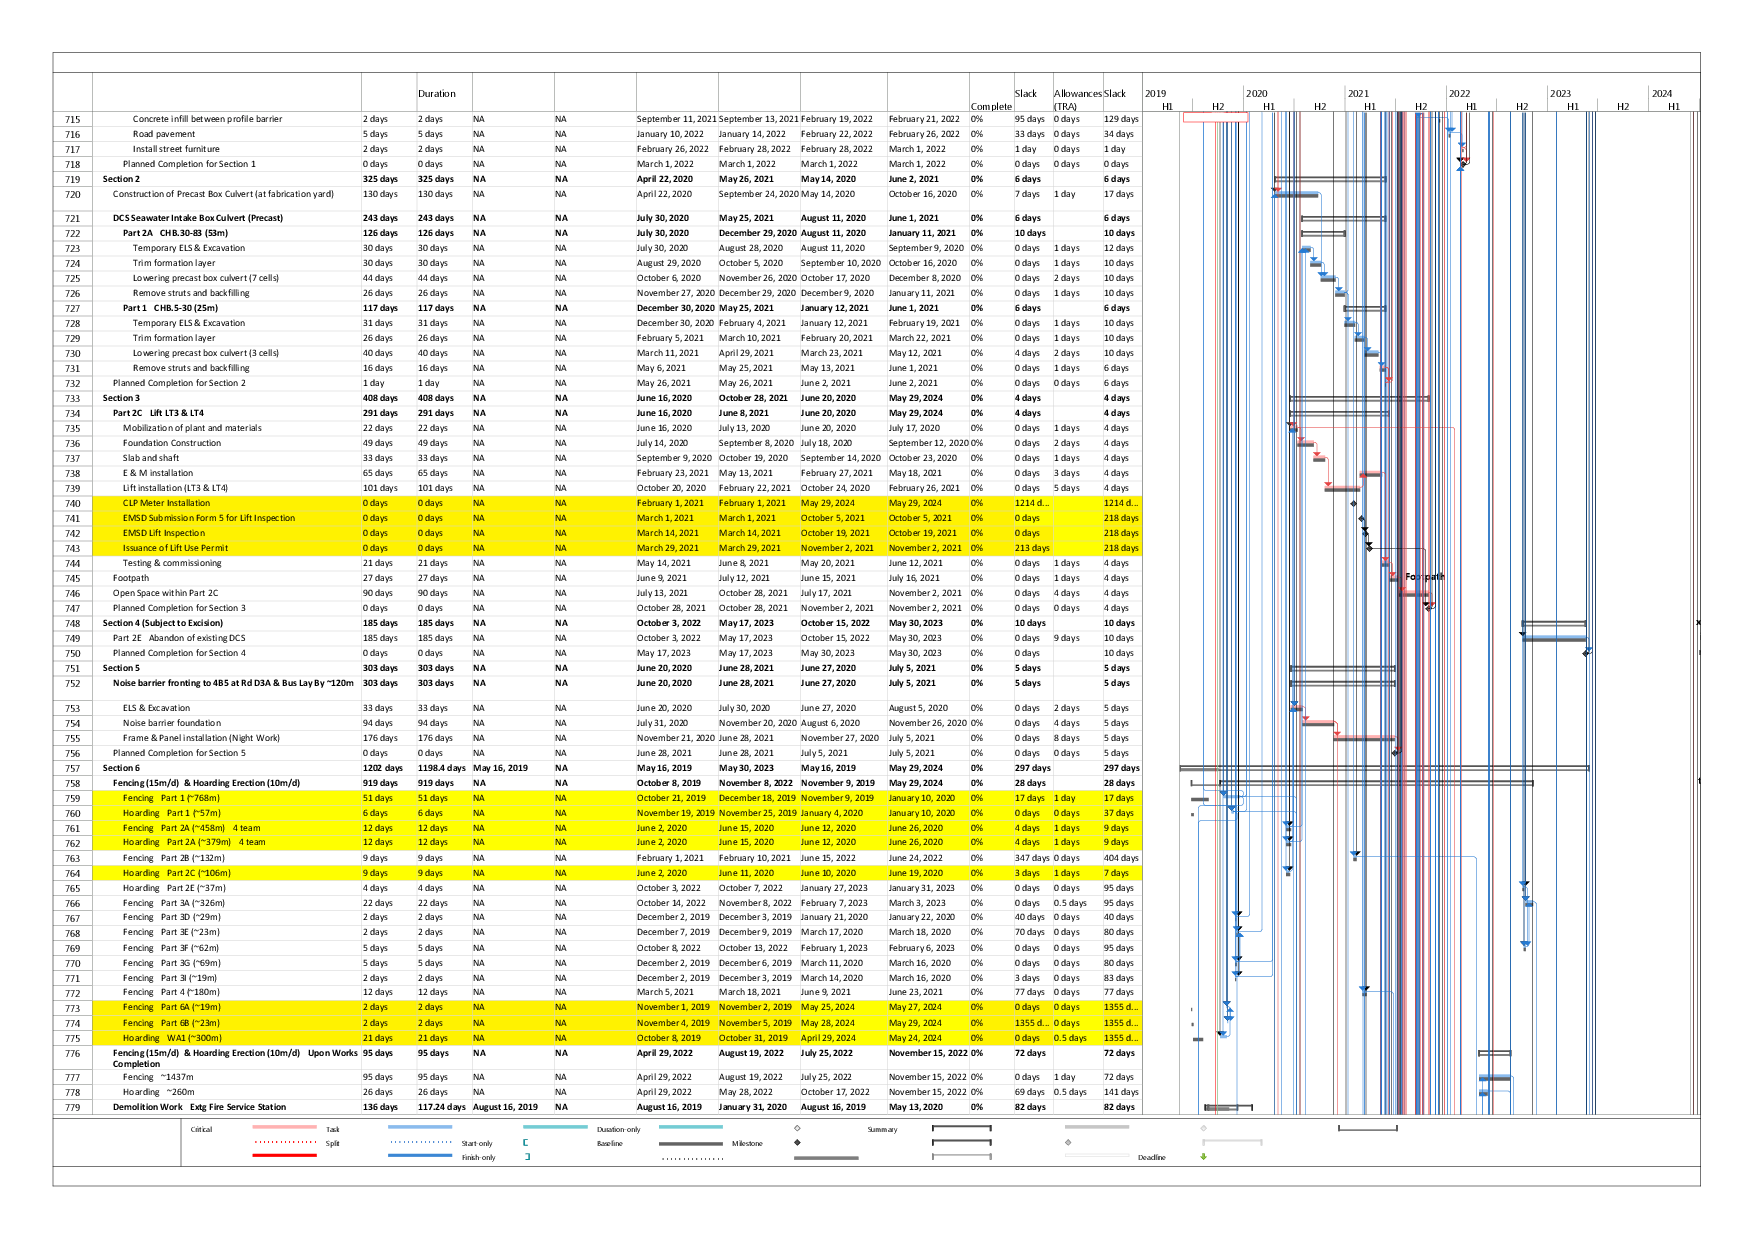
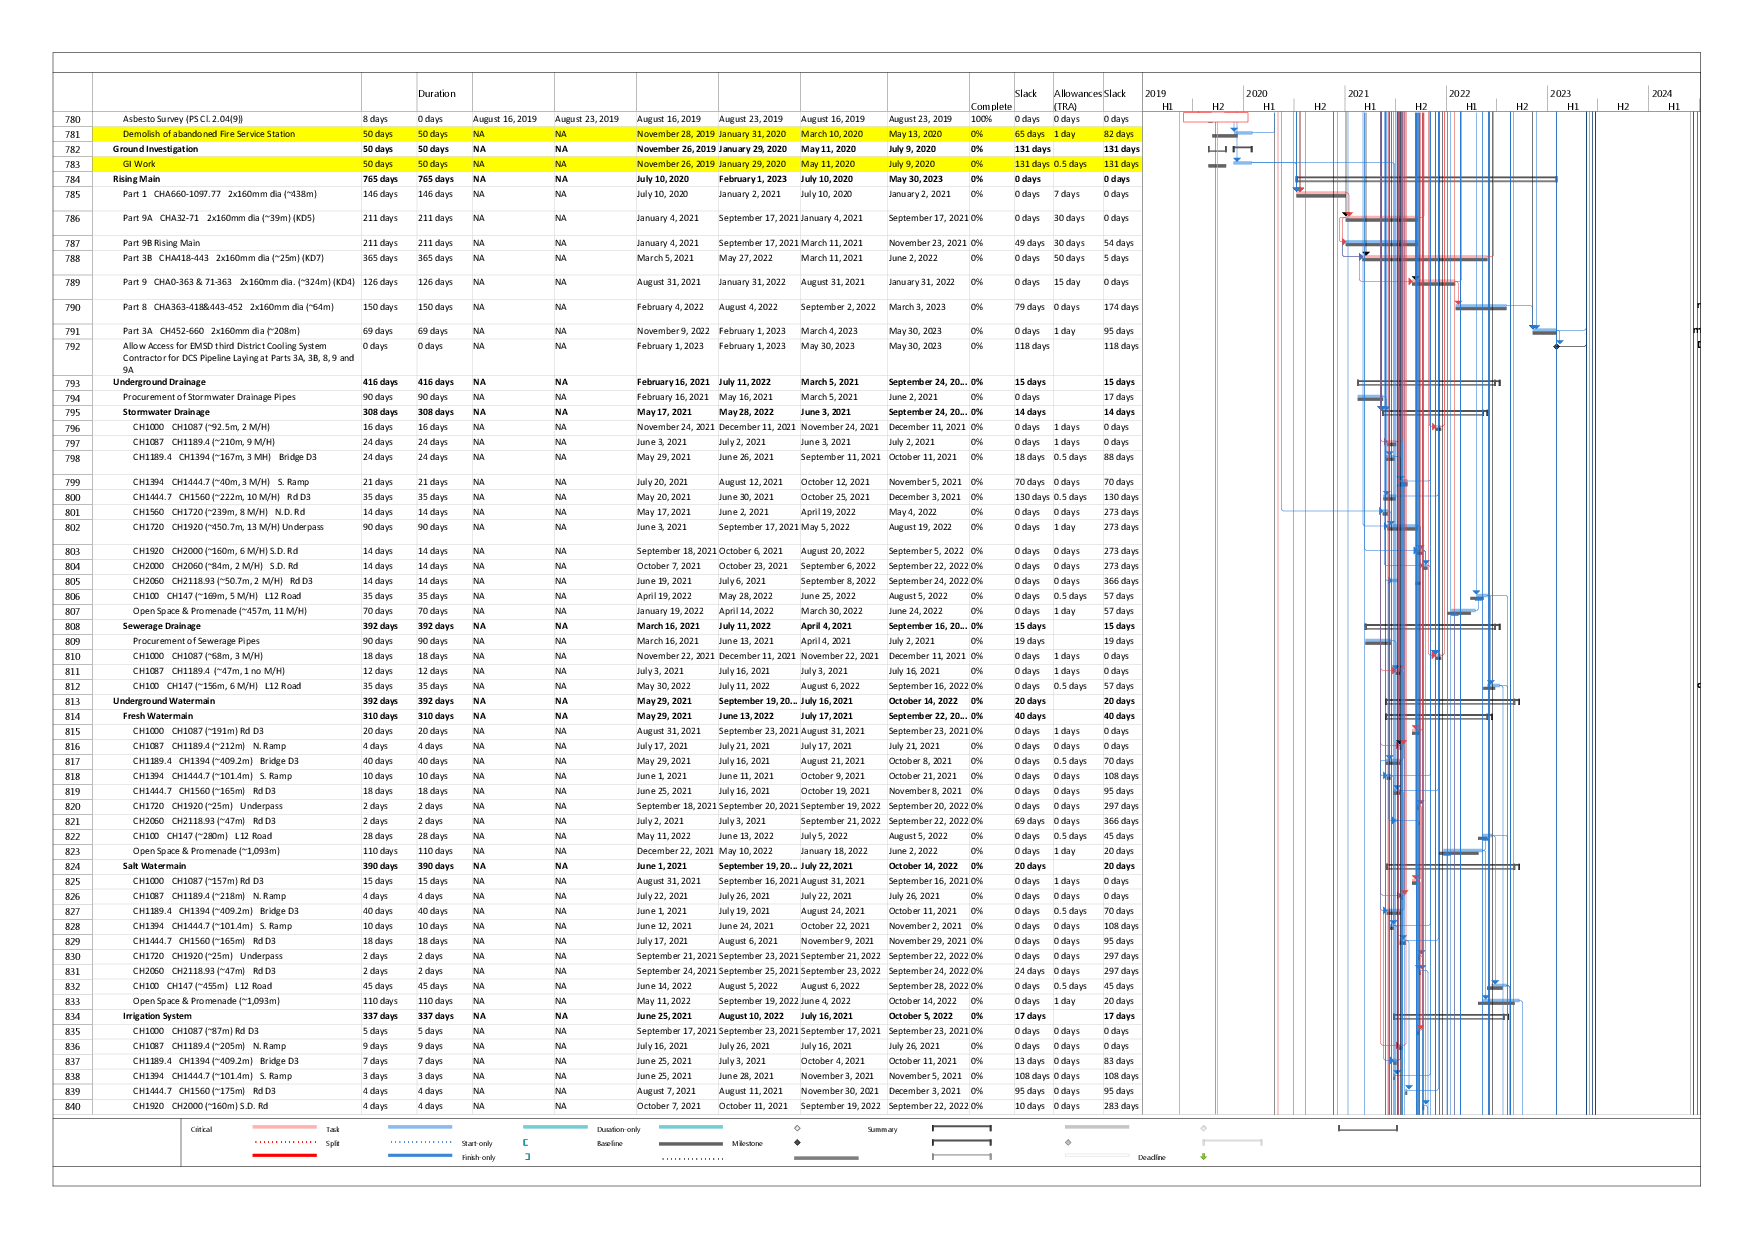
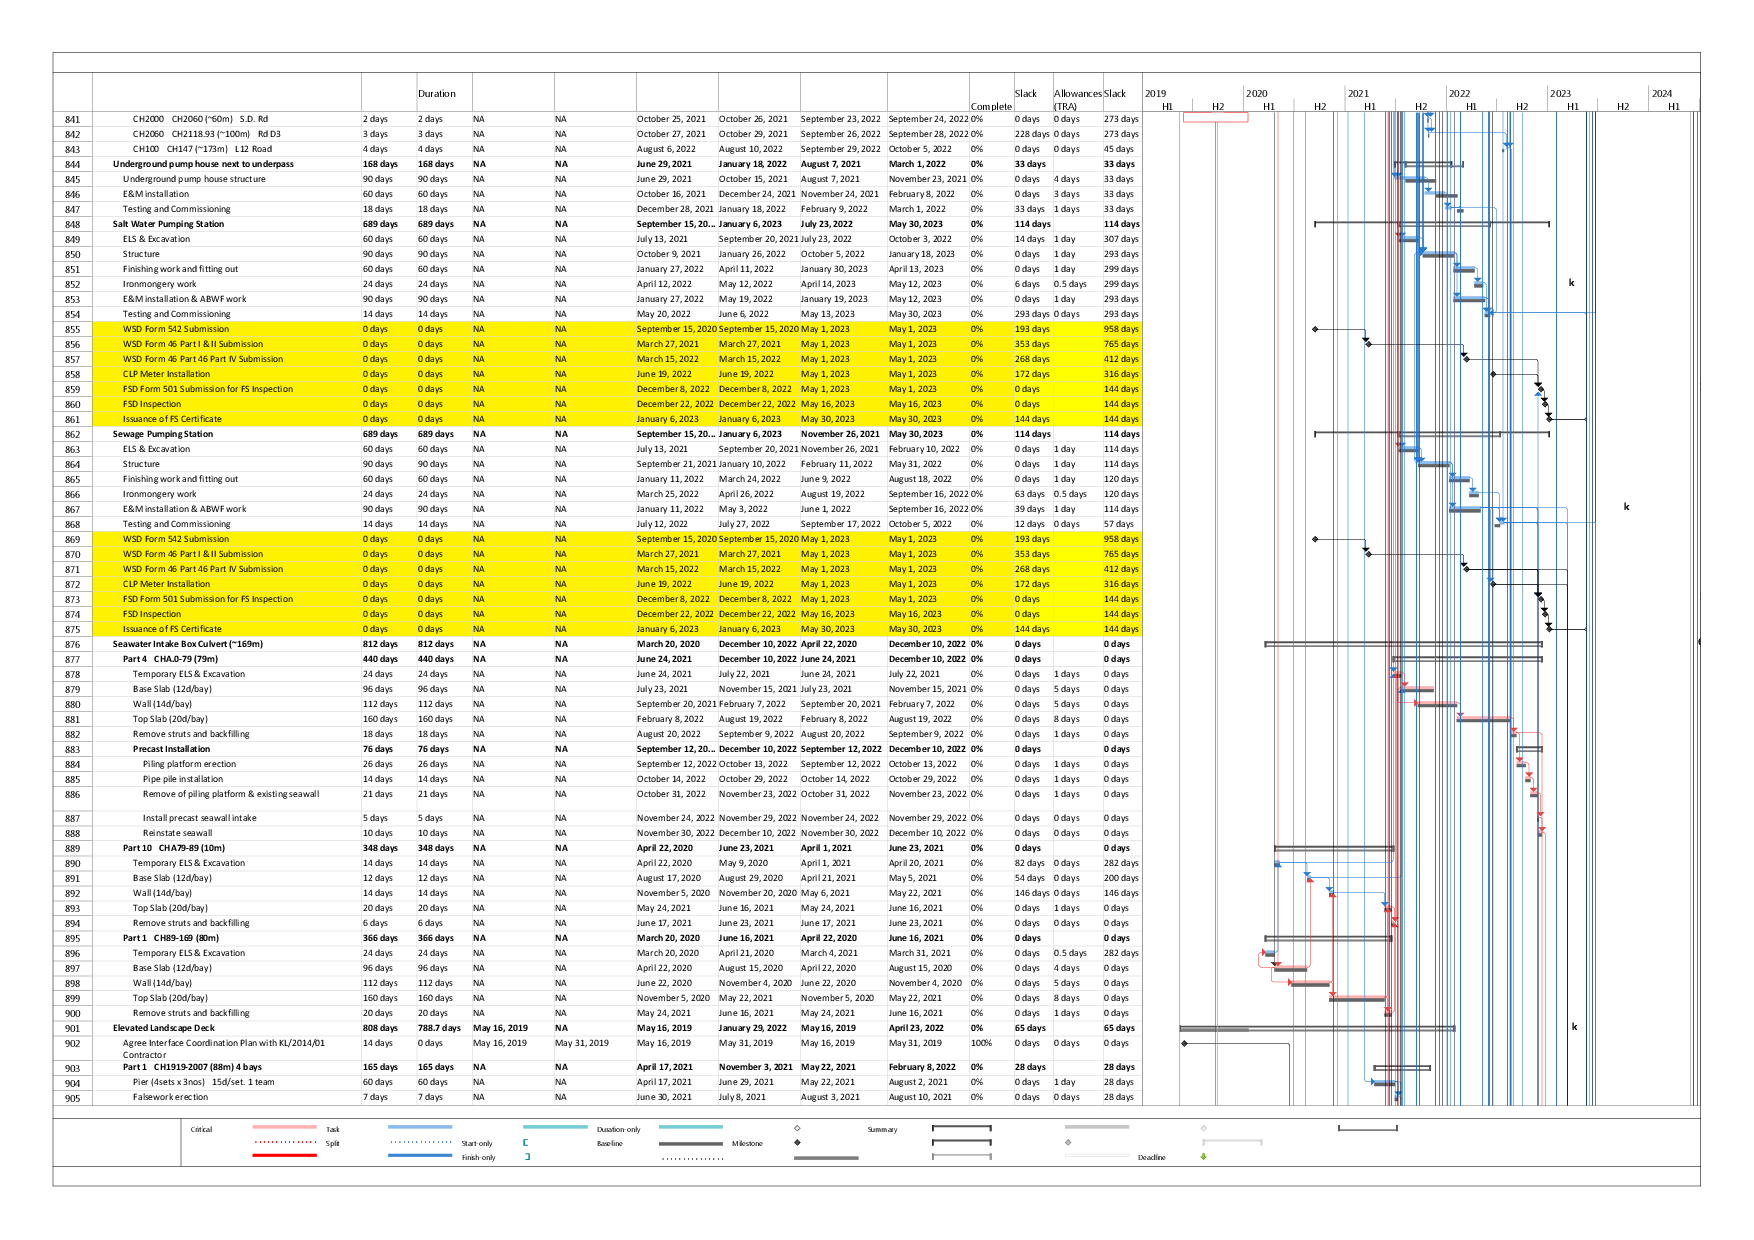
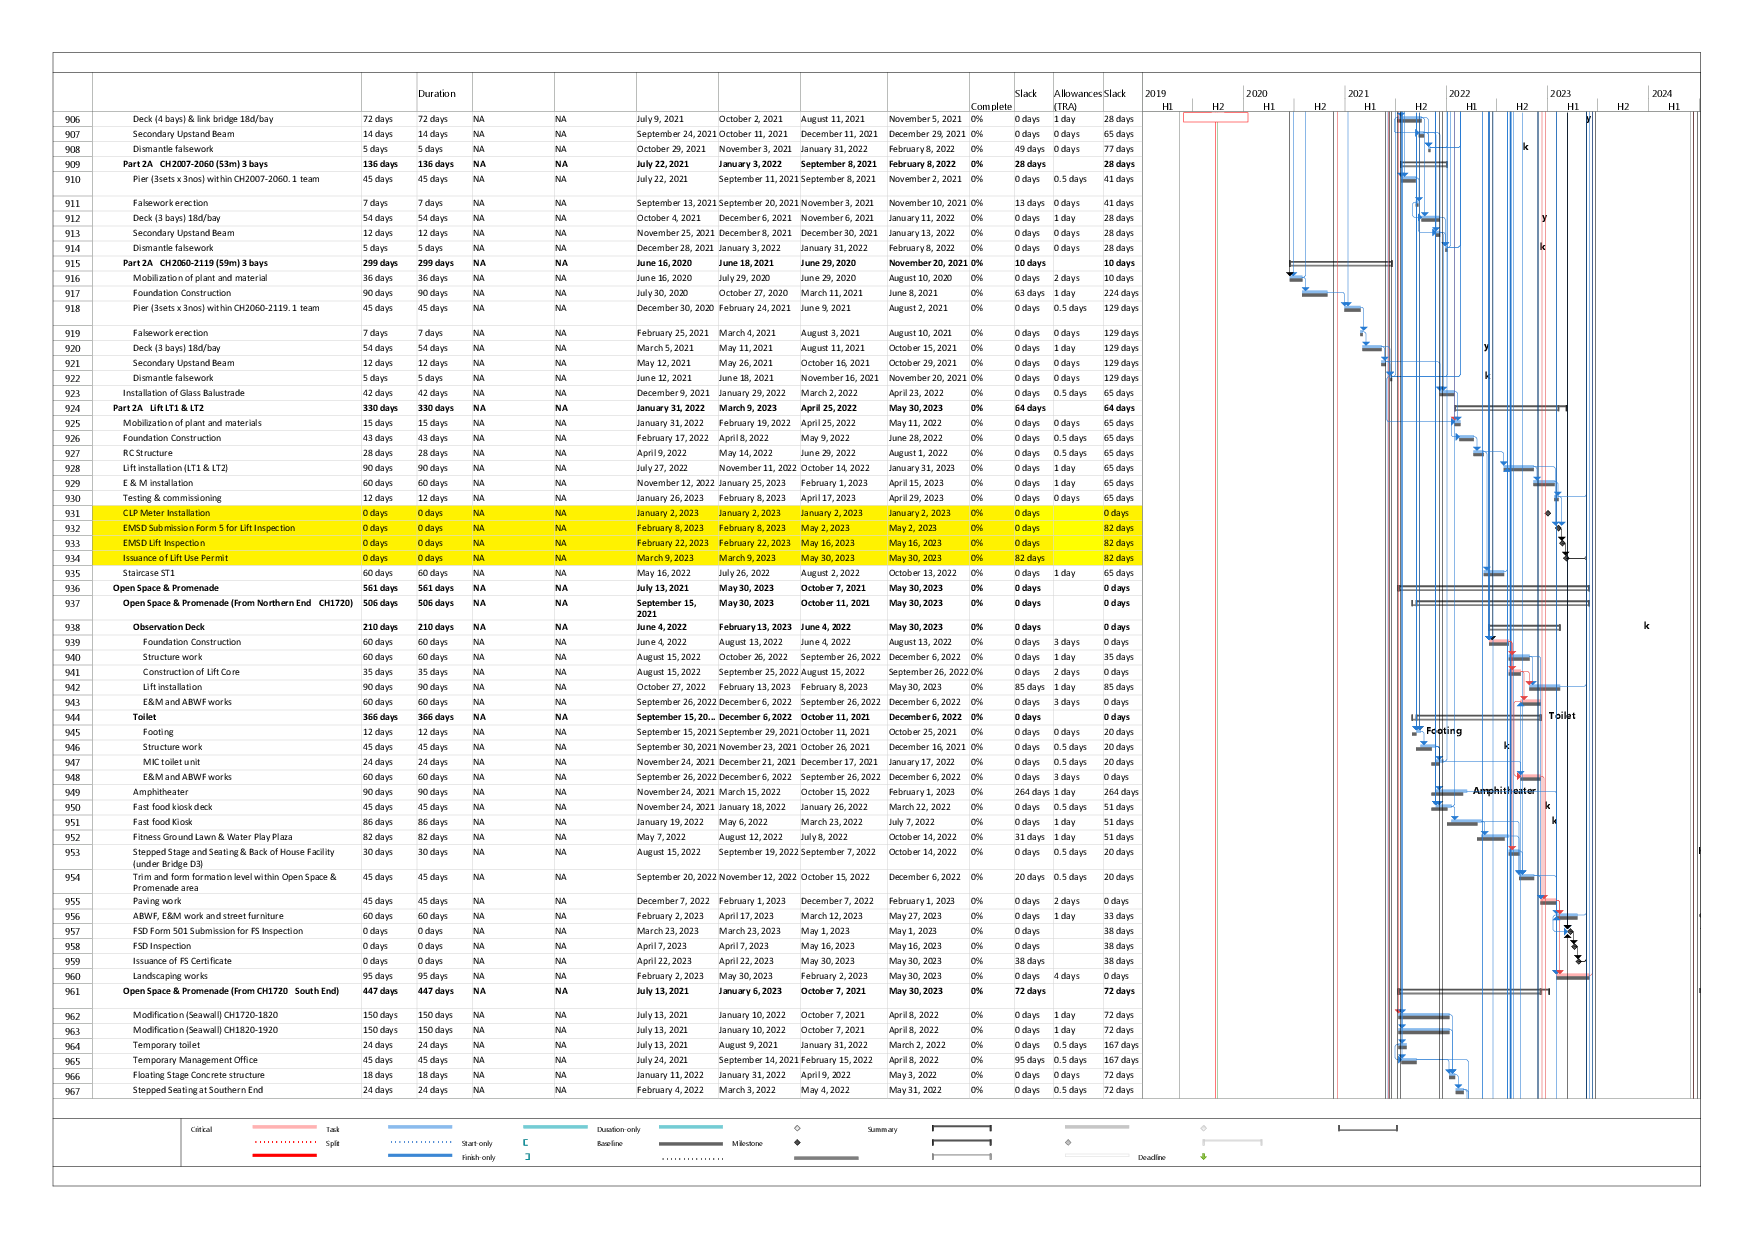
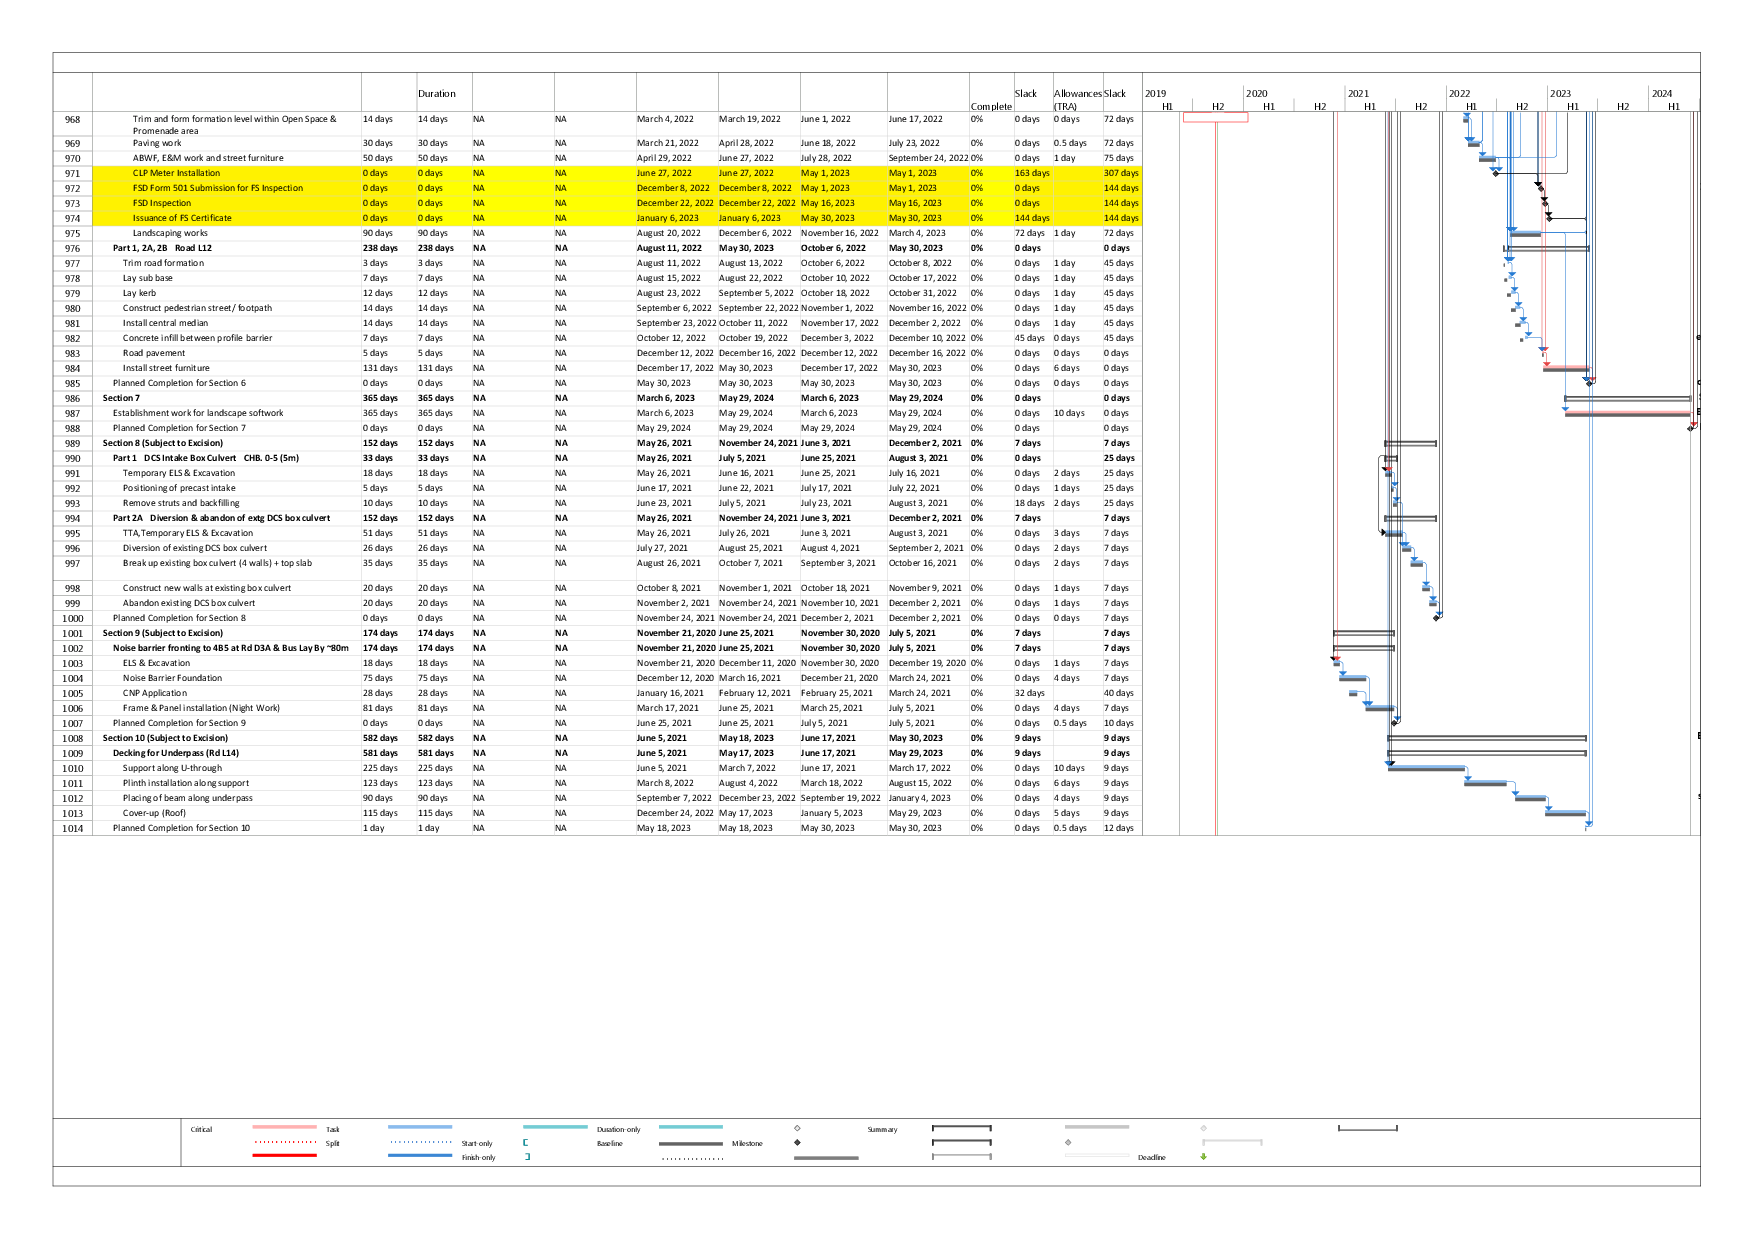
1.7 The construction works commenced on 20 January 2020.The construction programme of the Project is given in Appendix B.
1.8 Major construction works of the Project in the reporting month are summarized in Table 1.2:
|
Installation of Sheet Pile  |
Pumping Test at North Depressed Road Cofferdam and South Depressed Road  |
|
Construction of Bored Pile of Bridge D3 and Landscape Deck 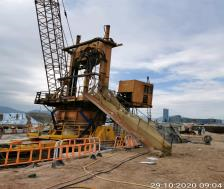 |
ELS Installation & Excavation for South Depressed Road 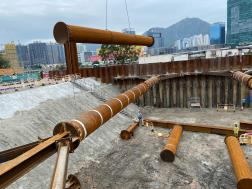 |
|
Construction of base slab, walls and columns for North Approach Ramp 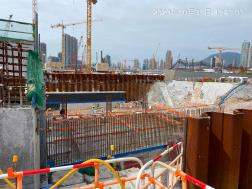 |
Permanent Structure Construction for North Depressed Road 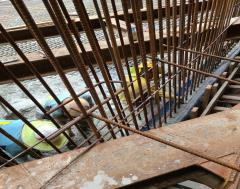 |
|
Permanent Structure Construction for Pile Cap of Bridge D3 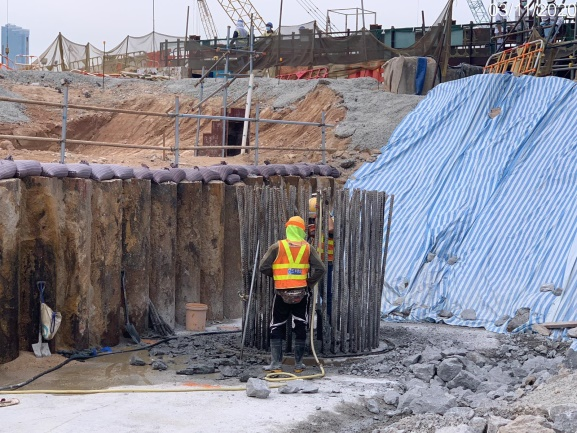
|
Construction of Hoarding 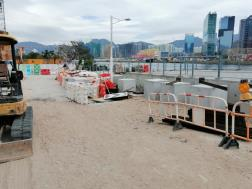 |
1.9 The status of required submission under Environmental Permit (EP) conditions under EP-337/2009, EP-445/2013 and Variation to the EP (VEP) No. EP-445/2013/A are summarized in Table 1.3.
|
EP Condition EP-337/2009 |
EP Condition EP-445/2013 |
EP Condition EP-445/2013/A |
Submission |
Submission Date |
|
Condition 1.11 |
Condition 1.12 |
Condition 1.12 |
Notification of Commencement Date of Construction of the Project |
6 Jan 2020 |
|
Condition 2.3 |
Condition 2.3 |
Condition 2.3 |
Management Organization of Main Construction Companies |
9 Sep 2019 |
|
Condition 2.3 |
Condition 2.3 |
Condition 2.3 |
Updated Management Organization of Main Construction Companies |
28 May 2020 |
|
Condition 2.4 |
Condition 2.4 |
Condition 2.4 |
Design Drawings |
6 Jan 2020 |
|
Condition 2.11 |
Condition 2.5 |
Condition 2.5 |
Landscape Mitigation Plans |
2 Jan 2020 |
|
Condition 3.2 |
NA |
NA |
Baseline Monitoring Report |
2 Jan 2020 |
|
Condition 3.2 |
NA |
NA |
Revised Baseline Monitoring Report |
28 Mar 2020 |
|
Condition 3.3 |
Condition 3.2 |
Condition 3.2 |
Monthly EM&A Report (September 2020) |
14 October 2020 |
2.1 In accordance with EM&A Manuals (EIA Register Nos. AEIAR-130/2009), impact air quality monitoring shall be carried out during the construction phase of the Project. For regular impact monitoring, a sampling frequency of at least once in every six says will be strictly observed at all of the monitoring stations for 24-hour TSP. For 1-hour TSP monitoring, the sampling frequency of at least three times in every six days will be undertaken when the highest dust impact occurs.
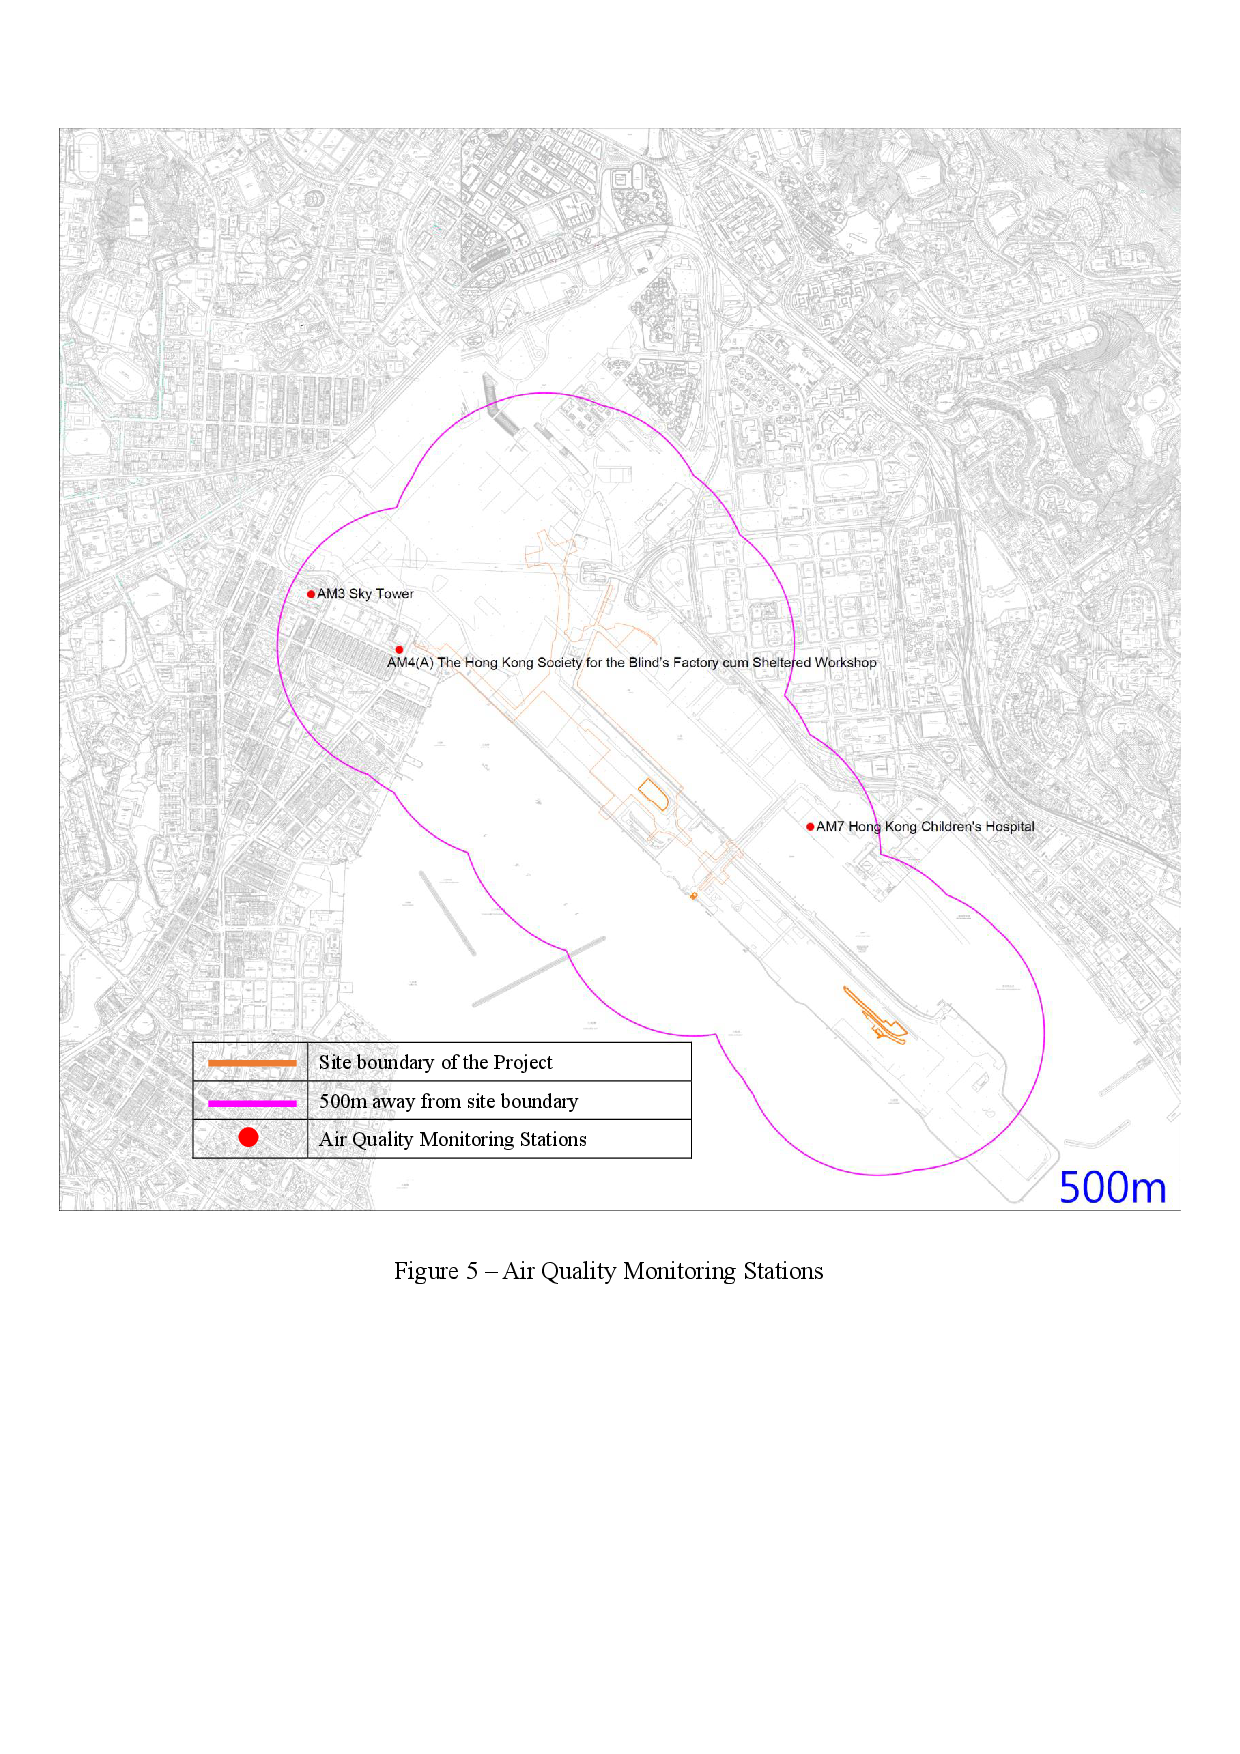
2.2 Three designated monitoring stations were selected for air quality monitoring programme. Impact air quality monitoring was conducted at three air quality monitoring stations in the reporting month. Table 2.1 describes the air quality monitoring locations, which are also depicted in Figure 5.
|
Air Quality Monitoring Locations for the Project |
Location of Measurement |
|
AM3 - Sky Tower |
Podium floor near T7 |
|
AM4(A) - The Hong Kong Society for the Blind’s Factory cum Sheltered Workshop |
Rooftop |
|
AM7 – Hong Kong Children’s Hospital |
Rooftop |
2.3 The air quality monitoring locations and monitoring frequency are listed in Table 2.2.
|
Air Monitoring Station |
Location for Measurement |
Parameter |
Duration |
Frequency |
|
AM3 - Sky Tower |
Podium floor near T7 |
- 24-hour average TSP
- 1-hour average TSP |
- 24 hours
- 1 hour |
- Once every 6 days
- Three times every 6 days |
|
AM4(A) - The Hong Kong Society for the Blind’s Factory cum Sheltered Workshop |
Rooftop |
|||
|
AM7 - Hong Kong Children’s Hospital |
Rooftop |
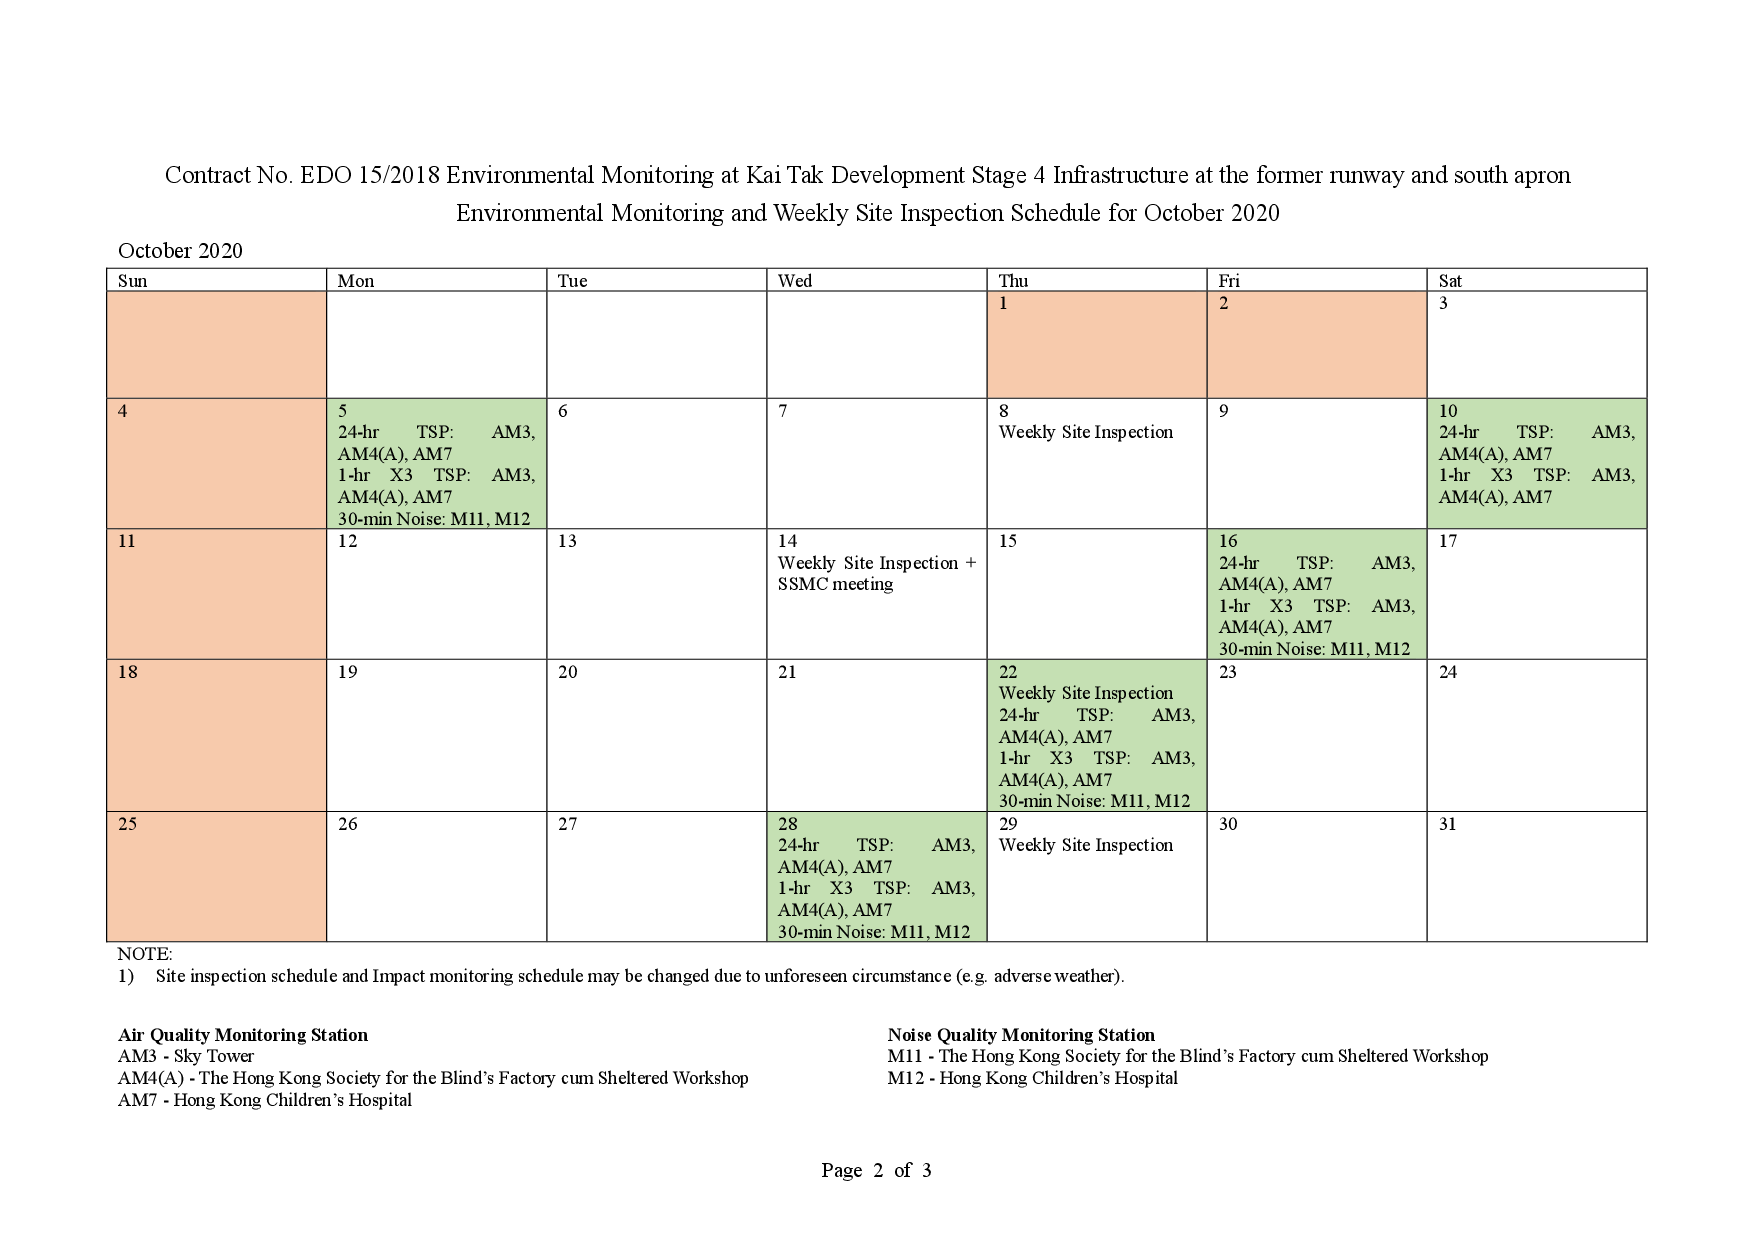
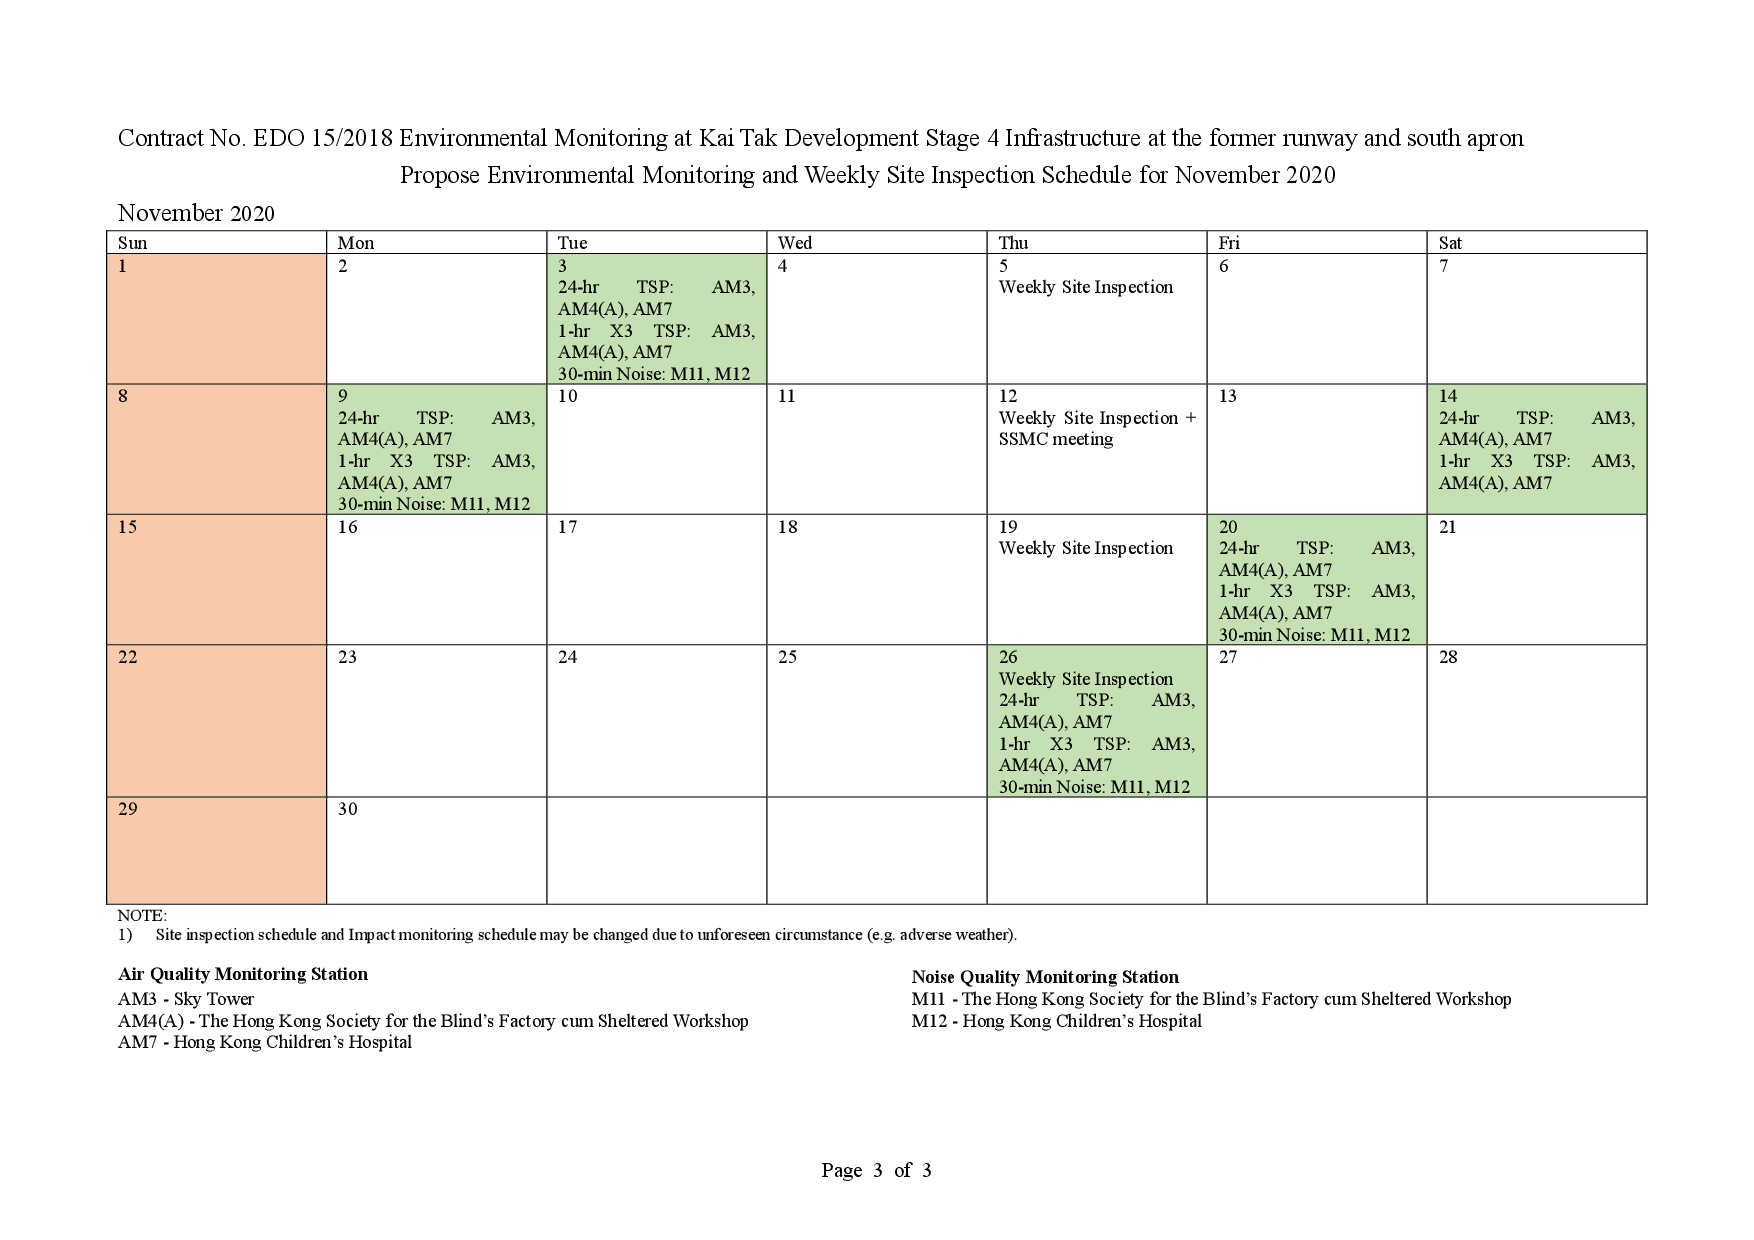
2.4 The monitoring schedule for reporting month and next month is presented in Appendix C.
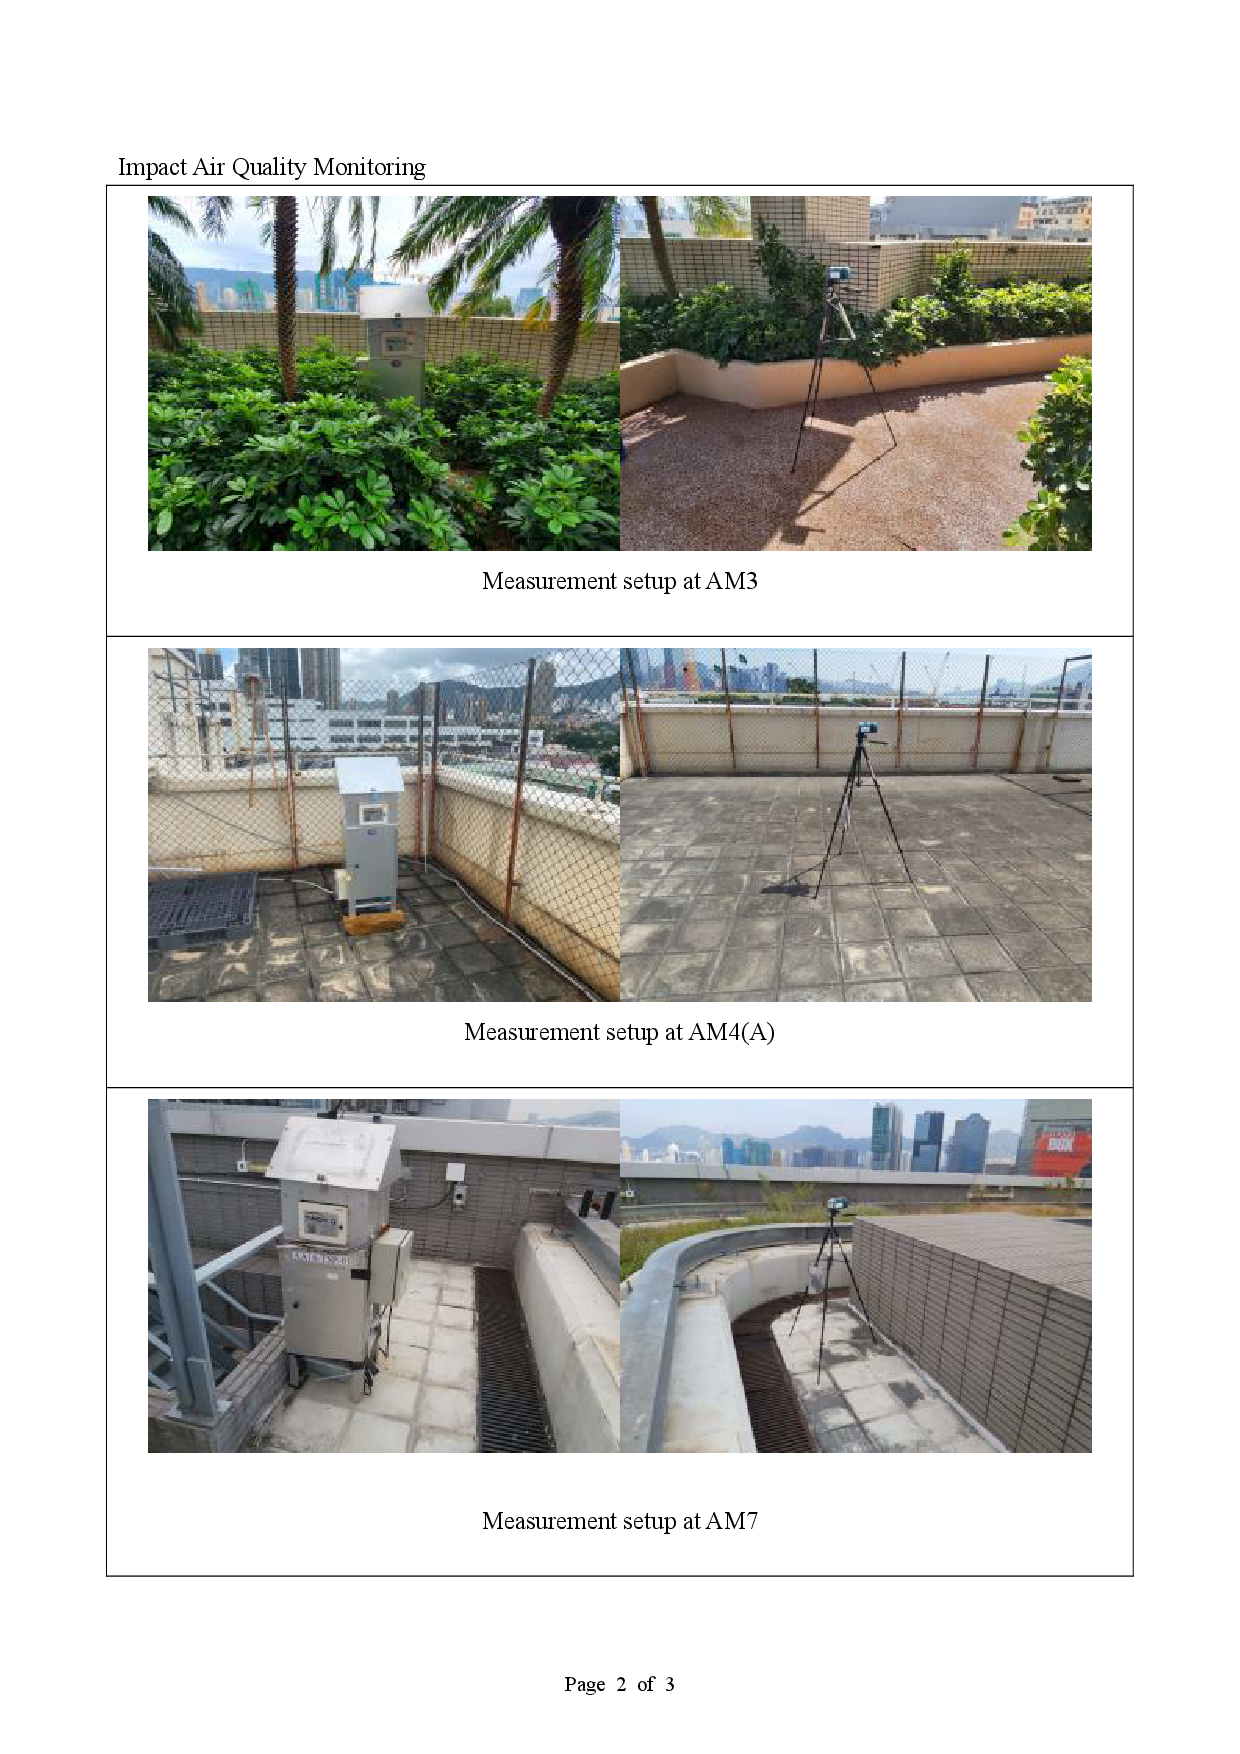
2.5 Photographic records of the impact monitoring setup are shown in Appendix D.
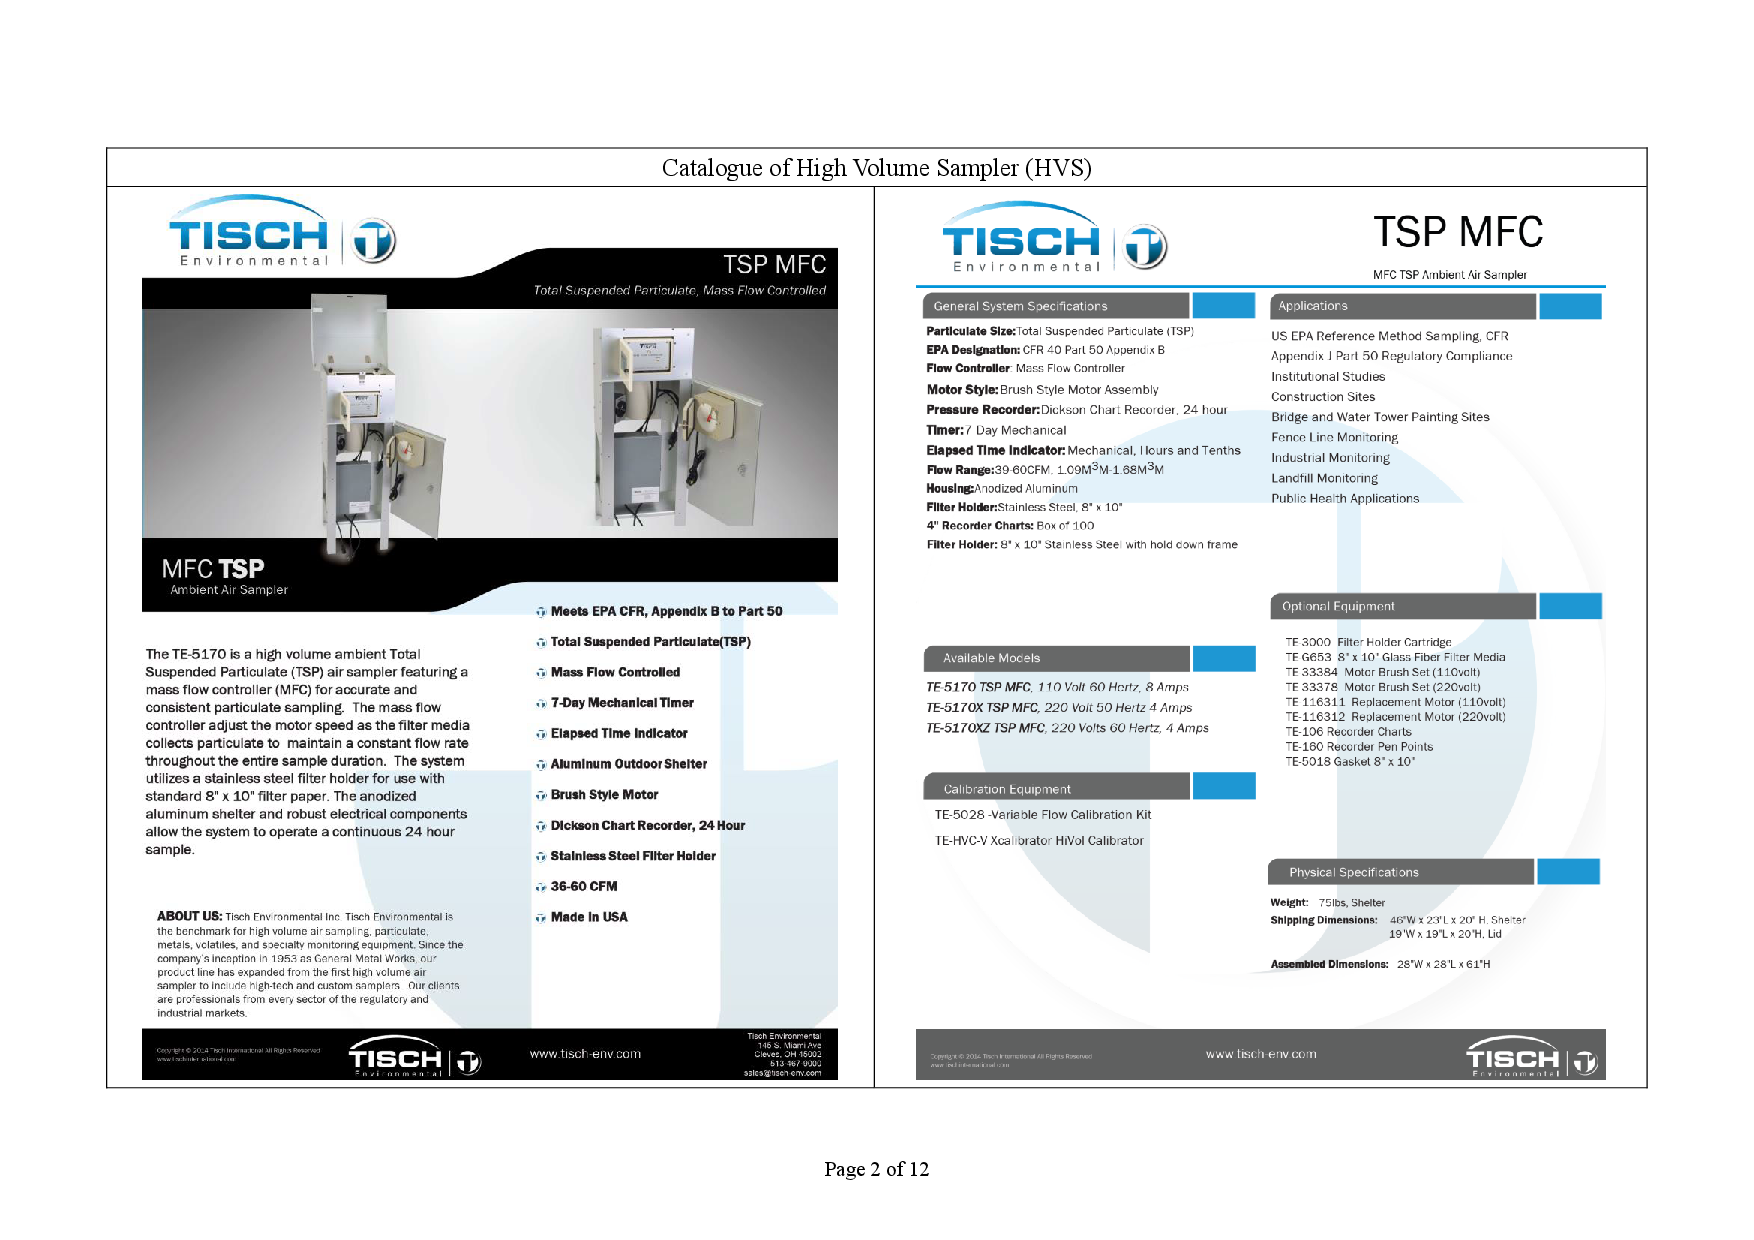
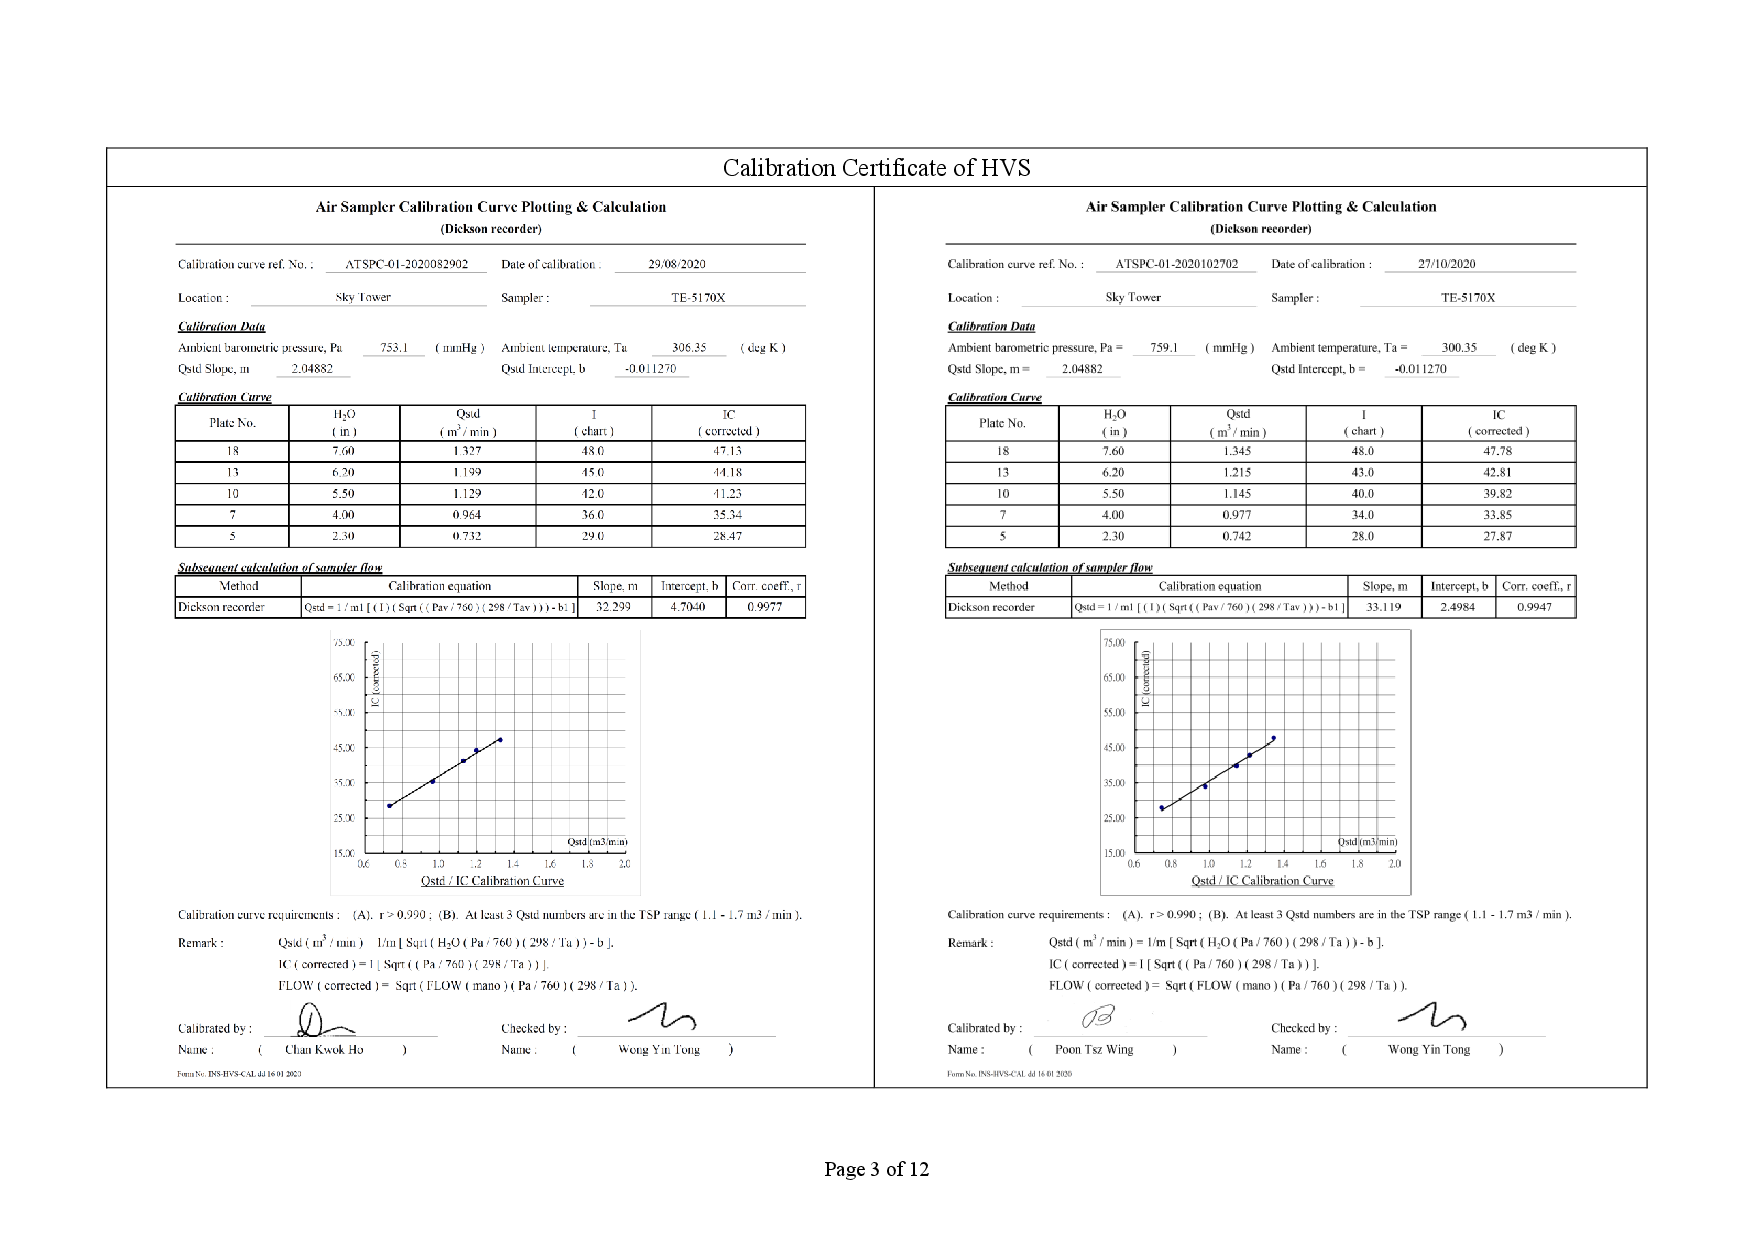
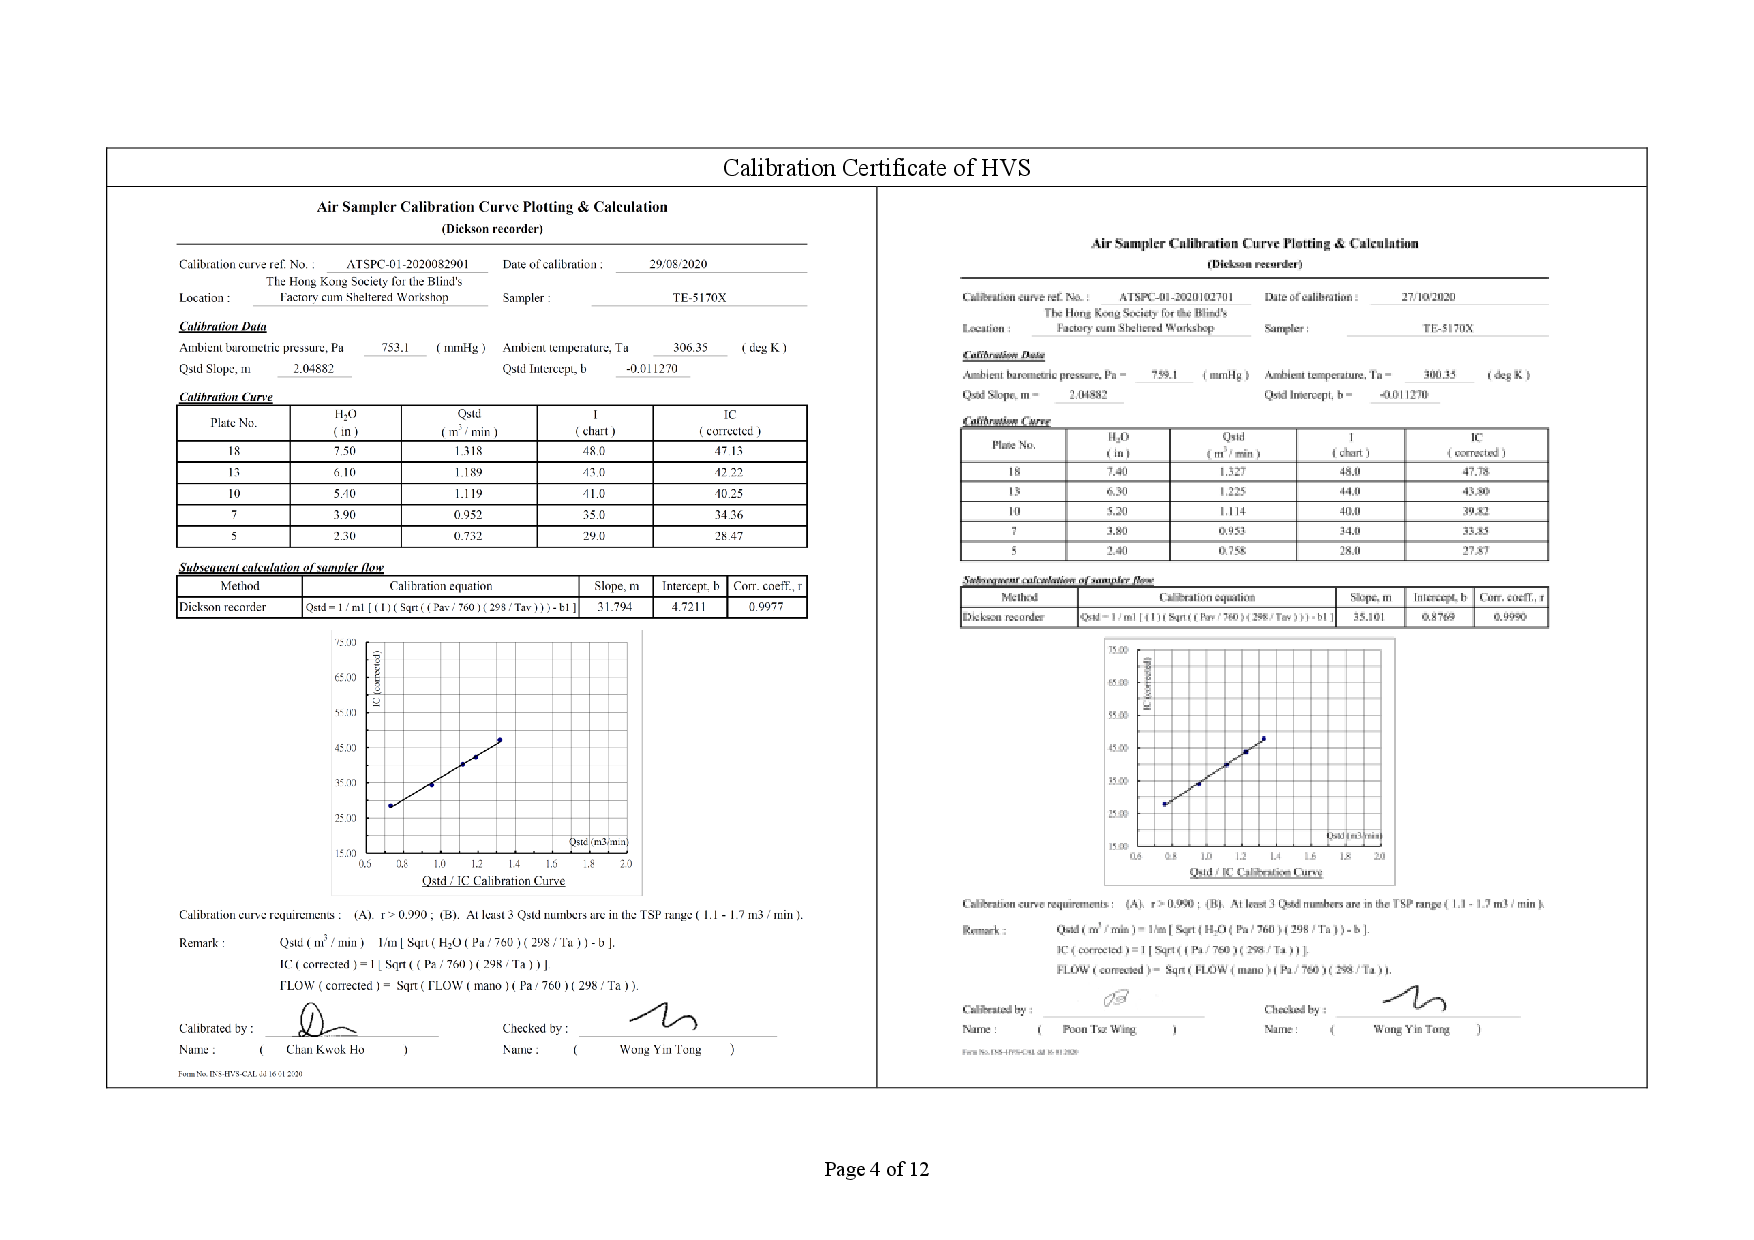
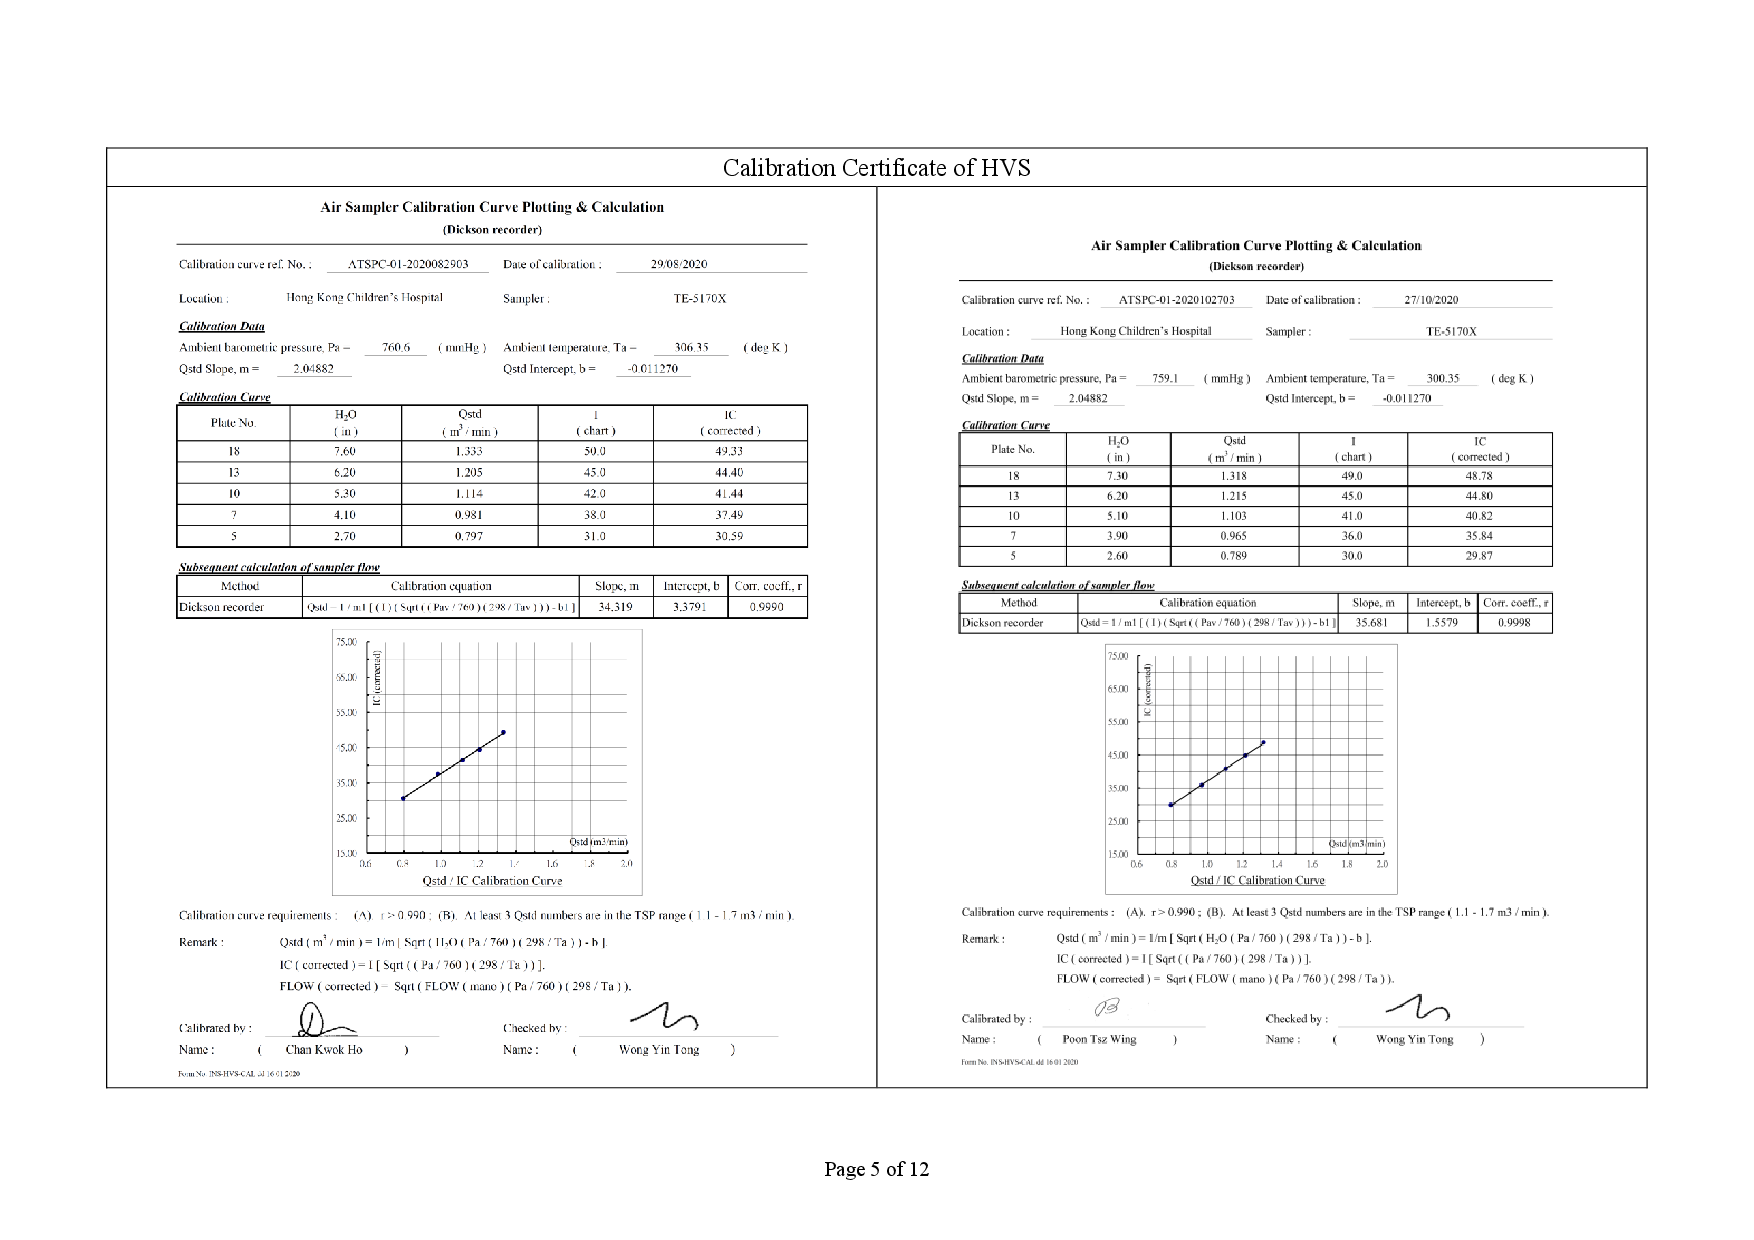
2.6 24-hour average TSP and 1-hour average TSP levels were measured for impact monitoring. 24-hour average TSP levels were measured by the High Volume Samplers (HVS) and 1-hour average TSP levels were measured by direct reading method to indicate short-term impacts. Wind data monitoring equipment was set up at conspicuous locations for logging wind speed and wind direction near to the dust monitoring locations. Table 2.3 summarizes the equipment to be used in the air quality monitoring.
|
Equipment |
Model |
Quantity |
|
HVS Sampler |
TE-5170 X c/w of TSP sampling inlet |
3 |
|
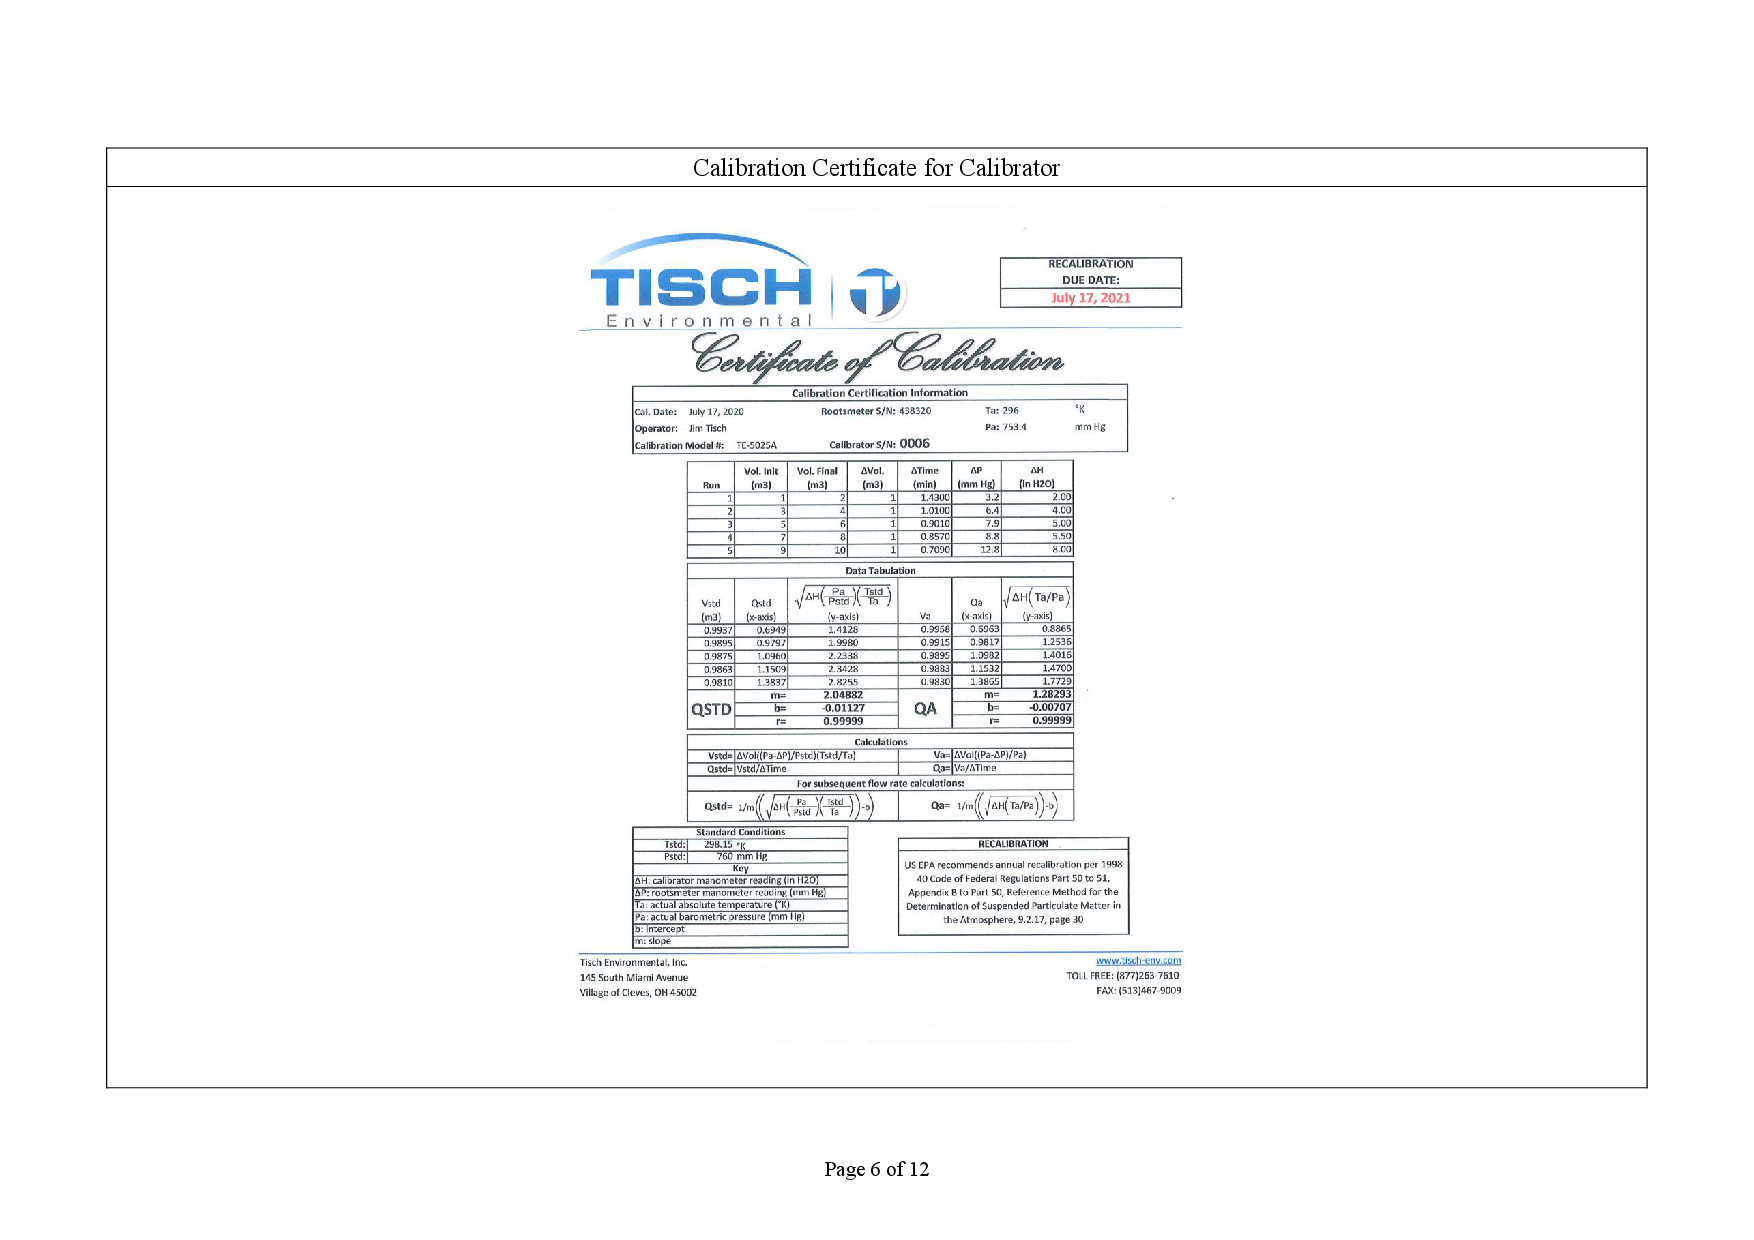
Calibrator |
TISCH TE-5025A |
1 |
|
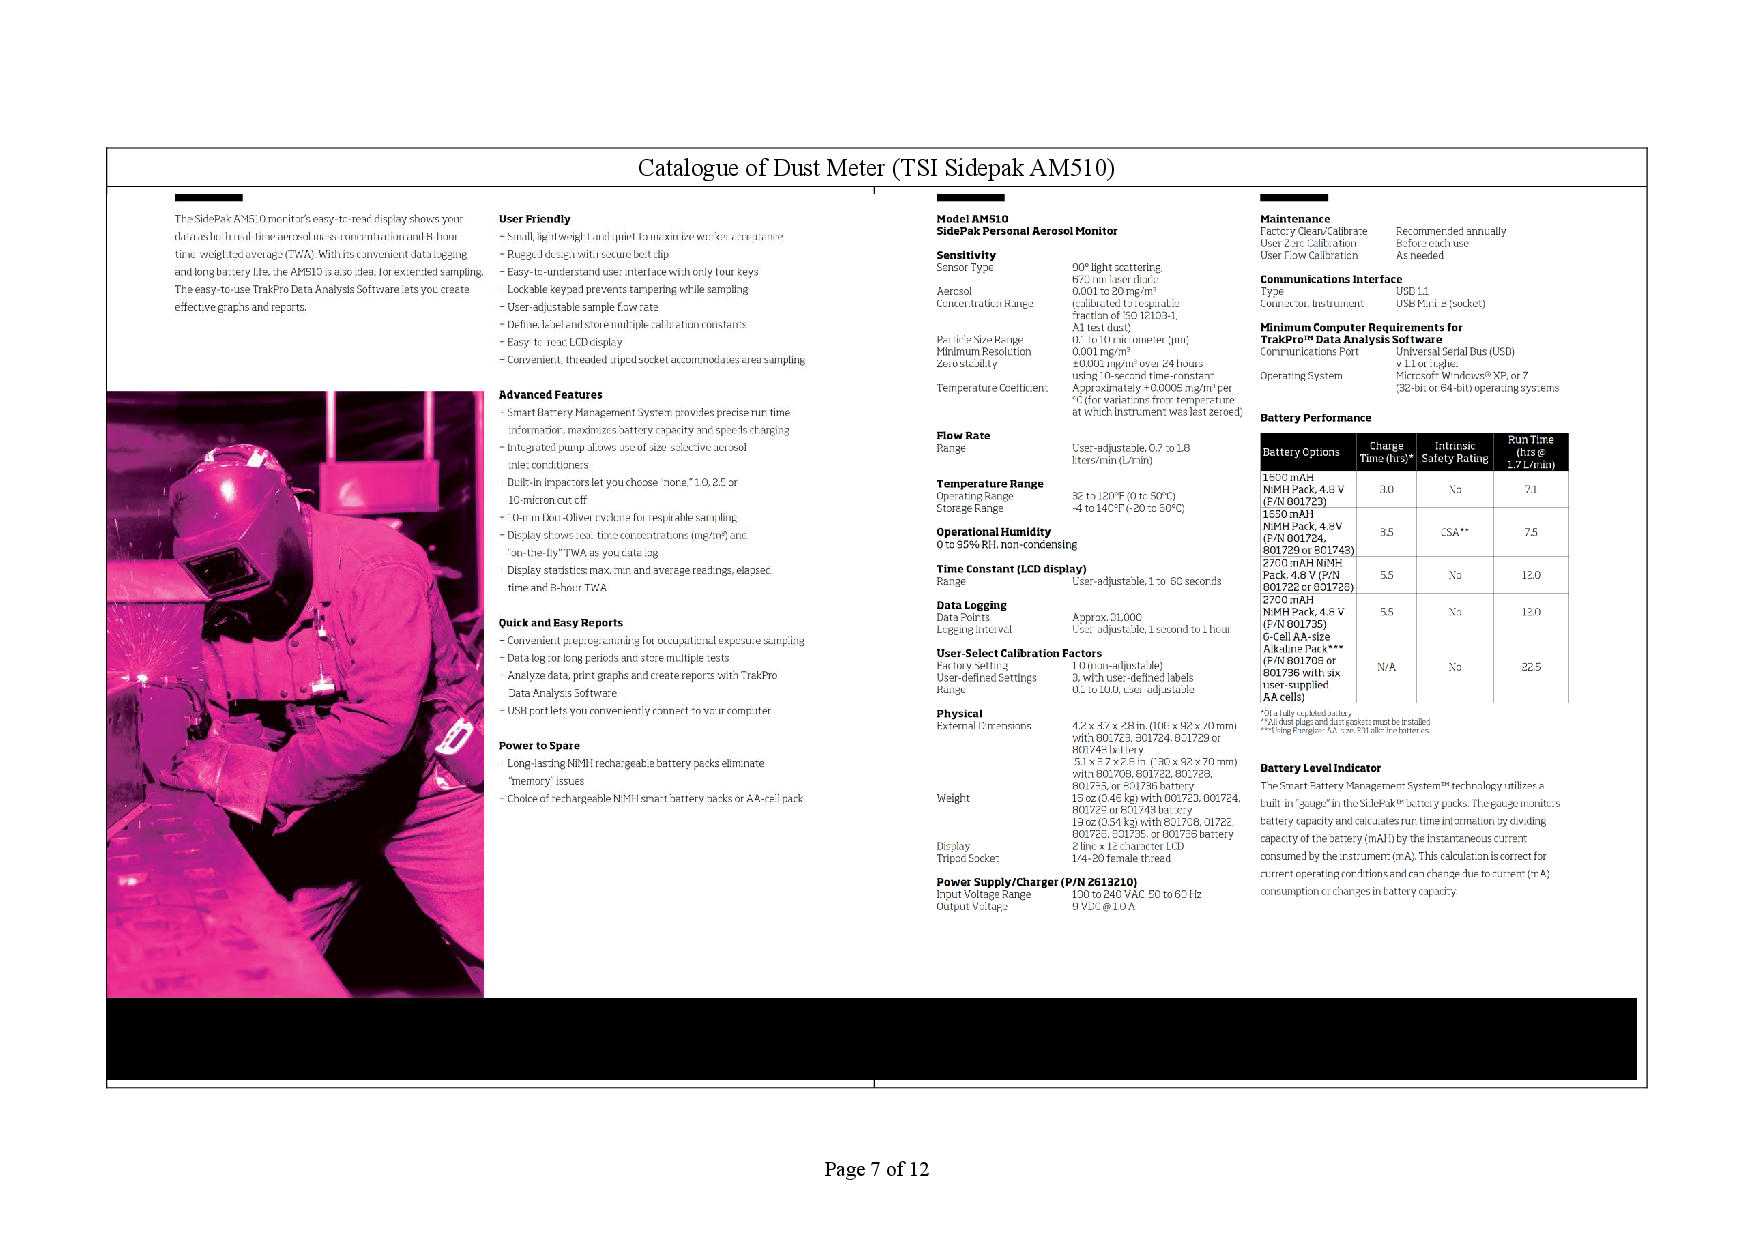
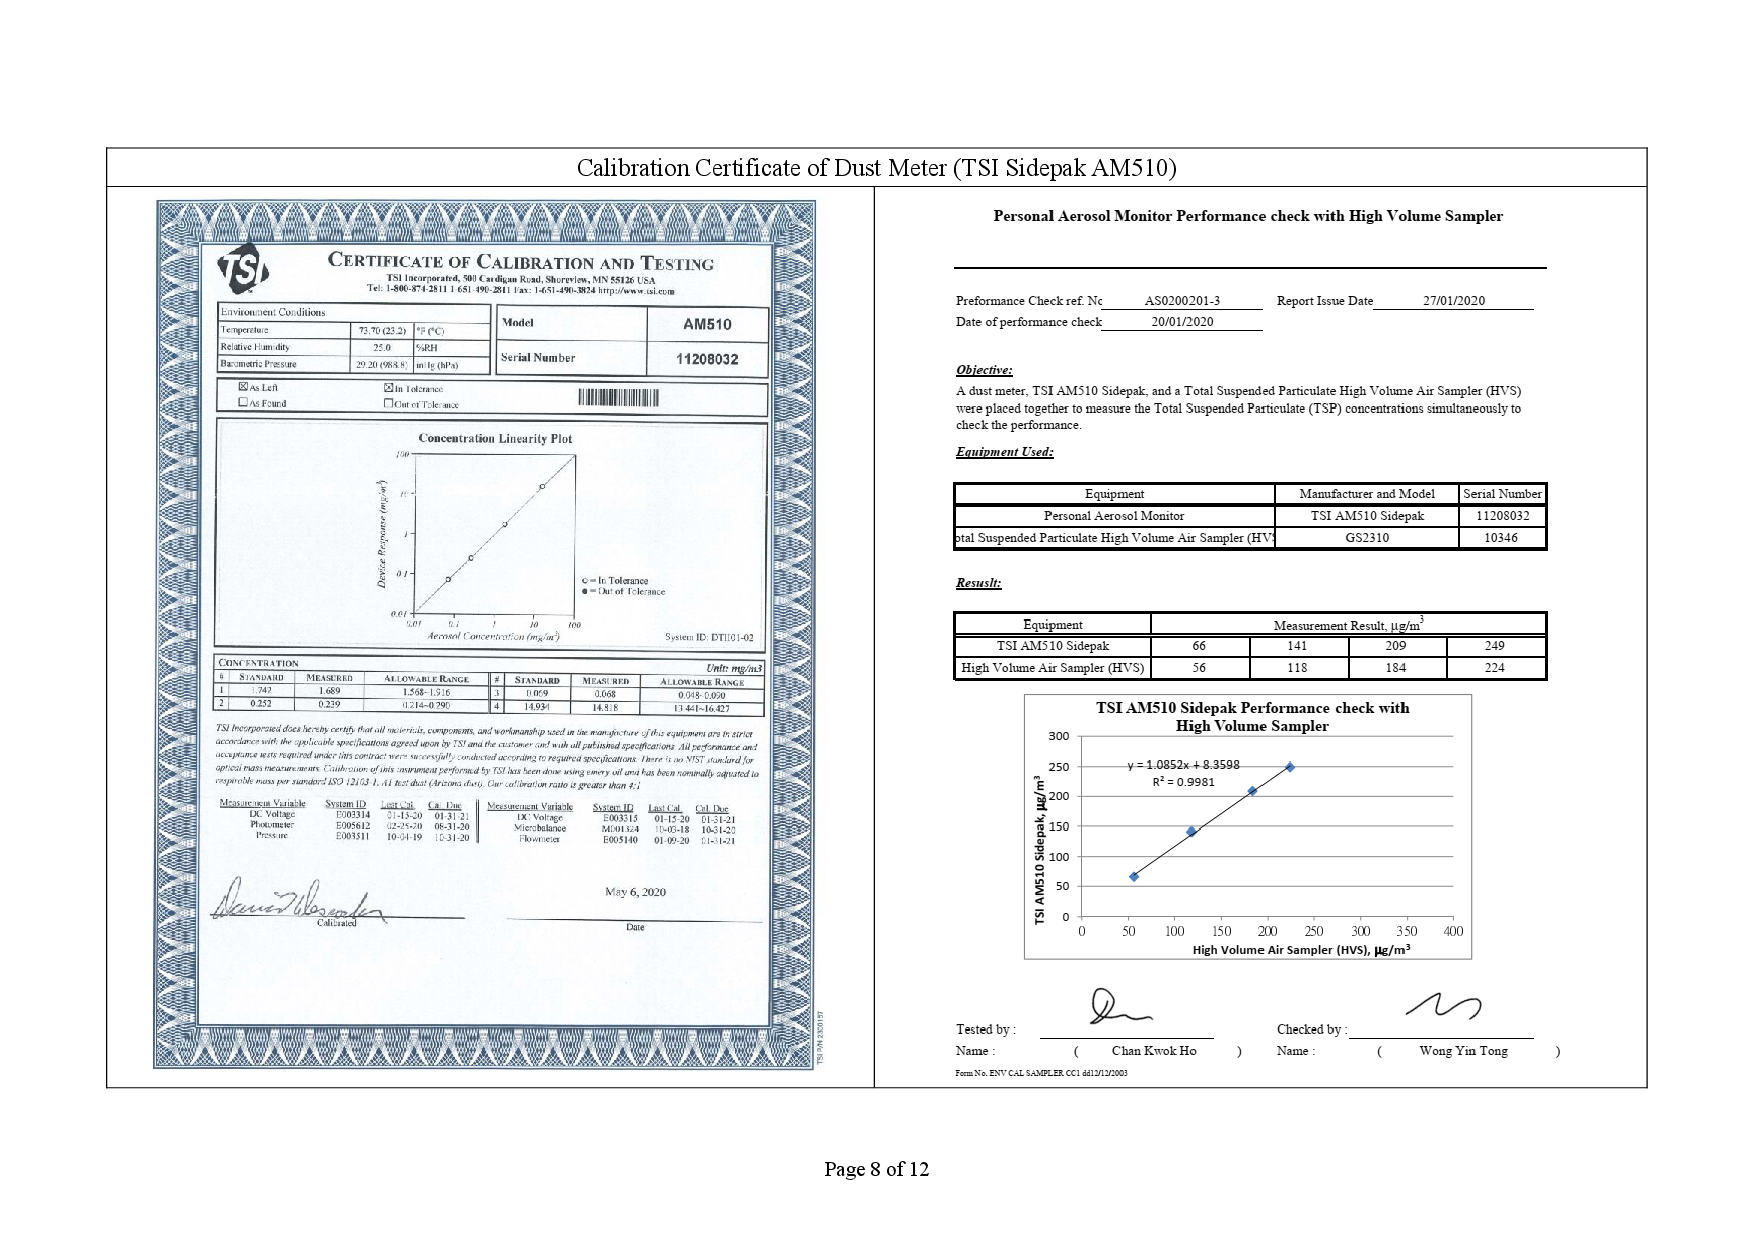
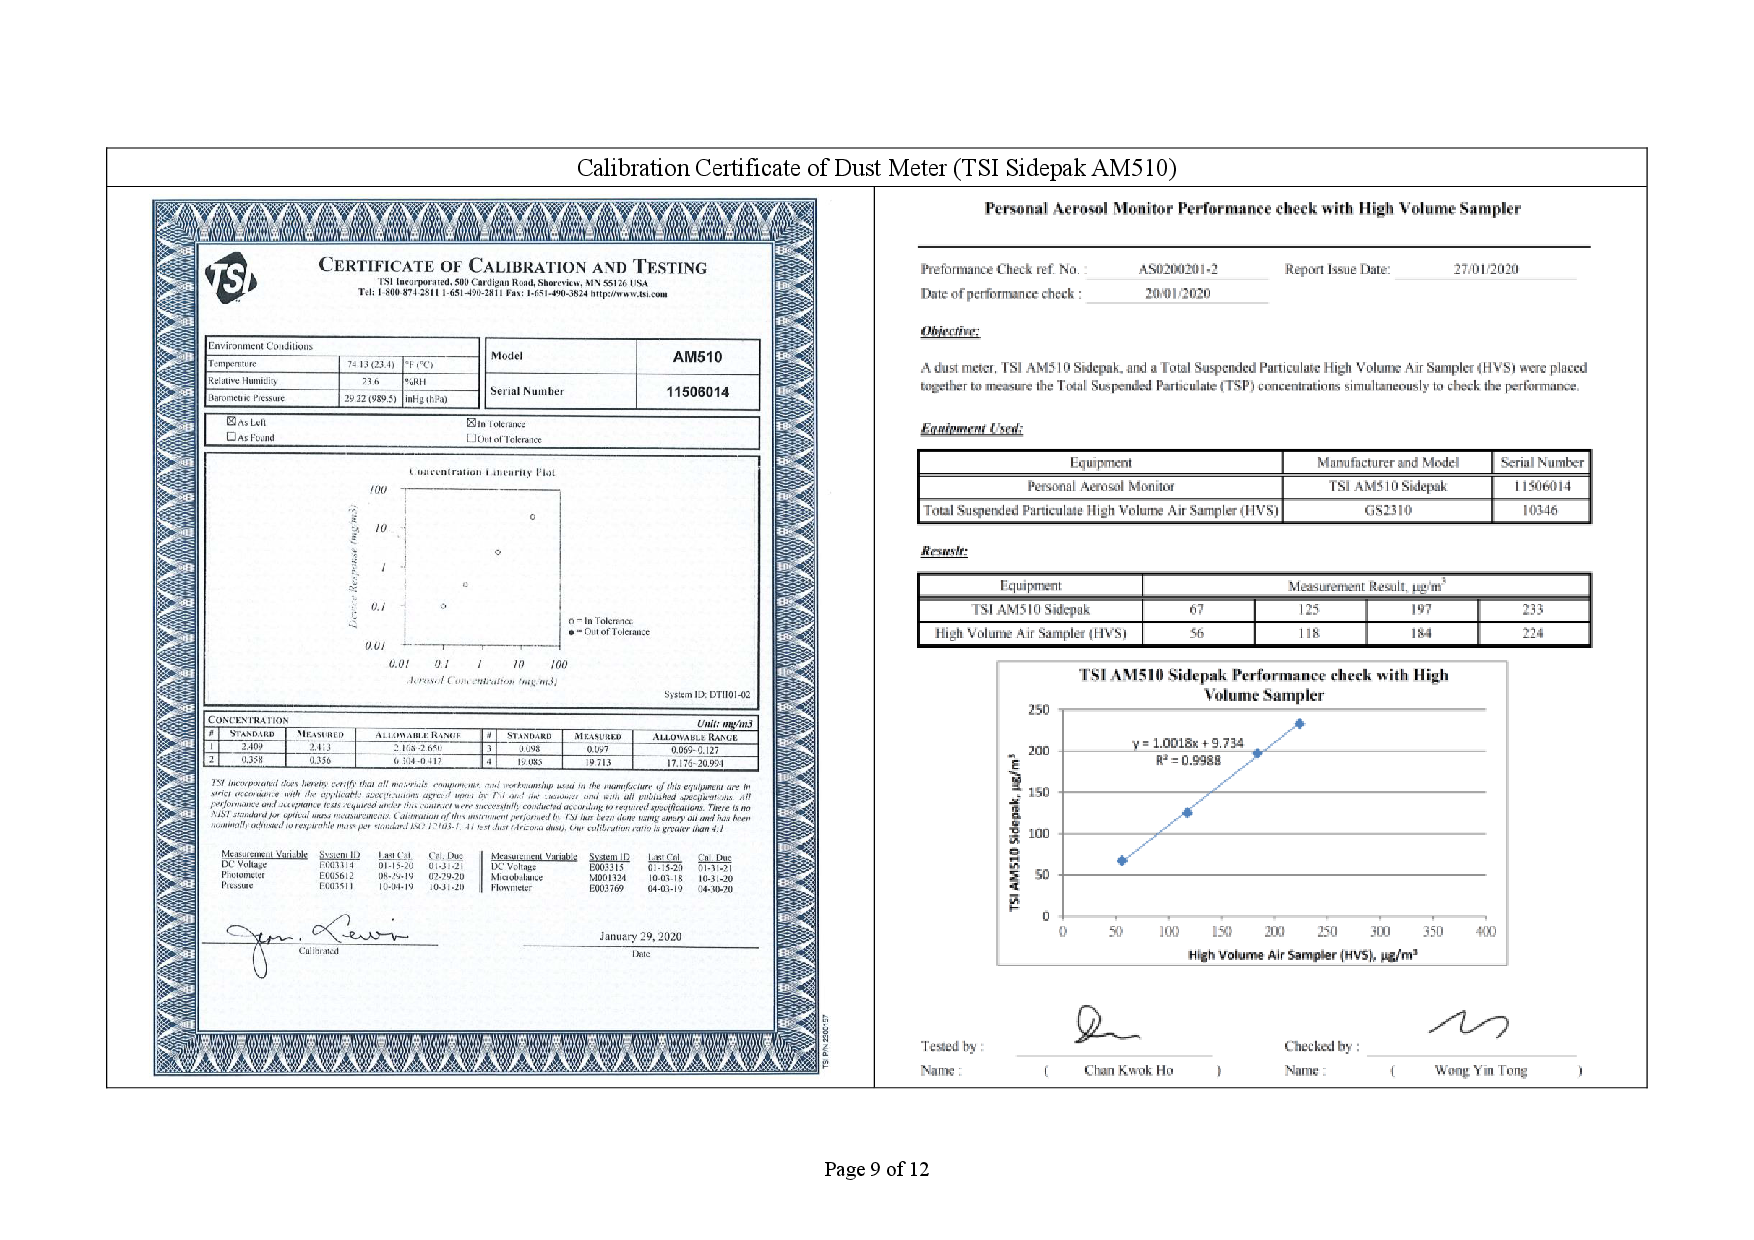
1-hour TSP Dust Meter |
TSI Model AM510 SidePak Personal Aerosol Monitor |
2 |
|
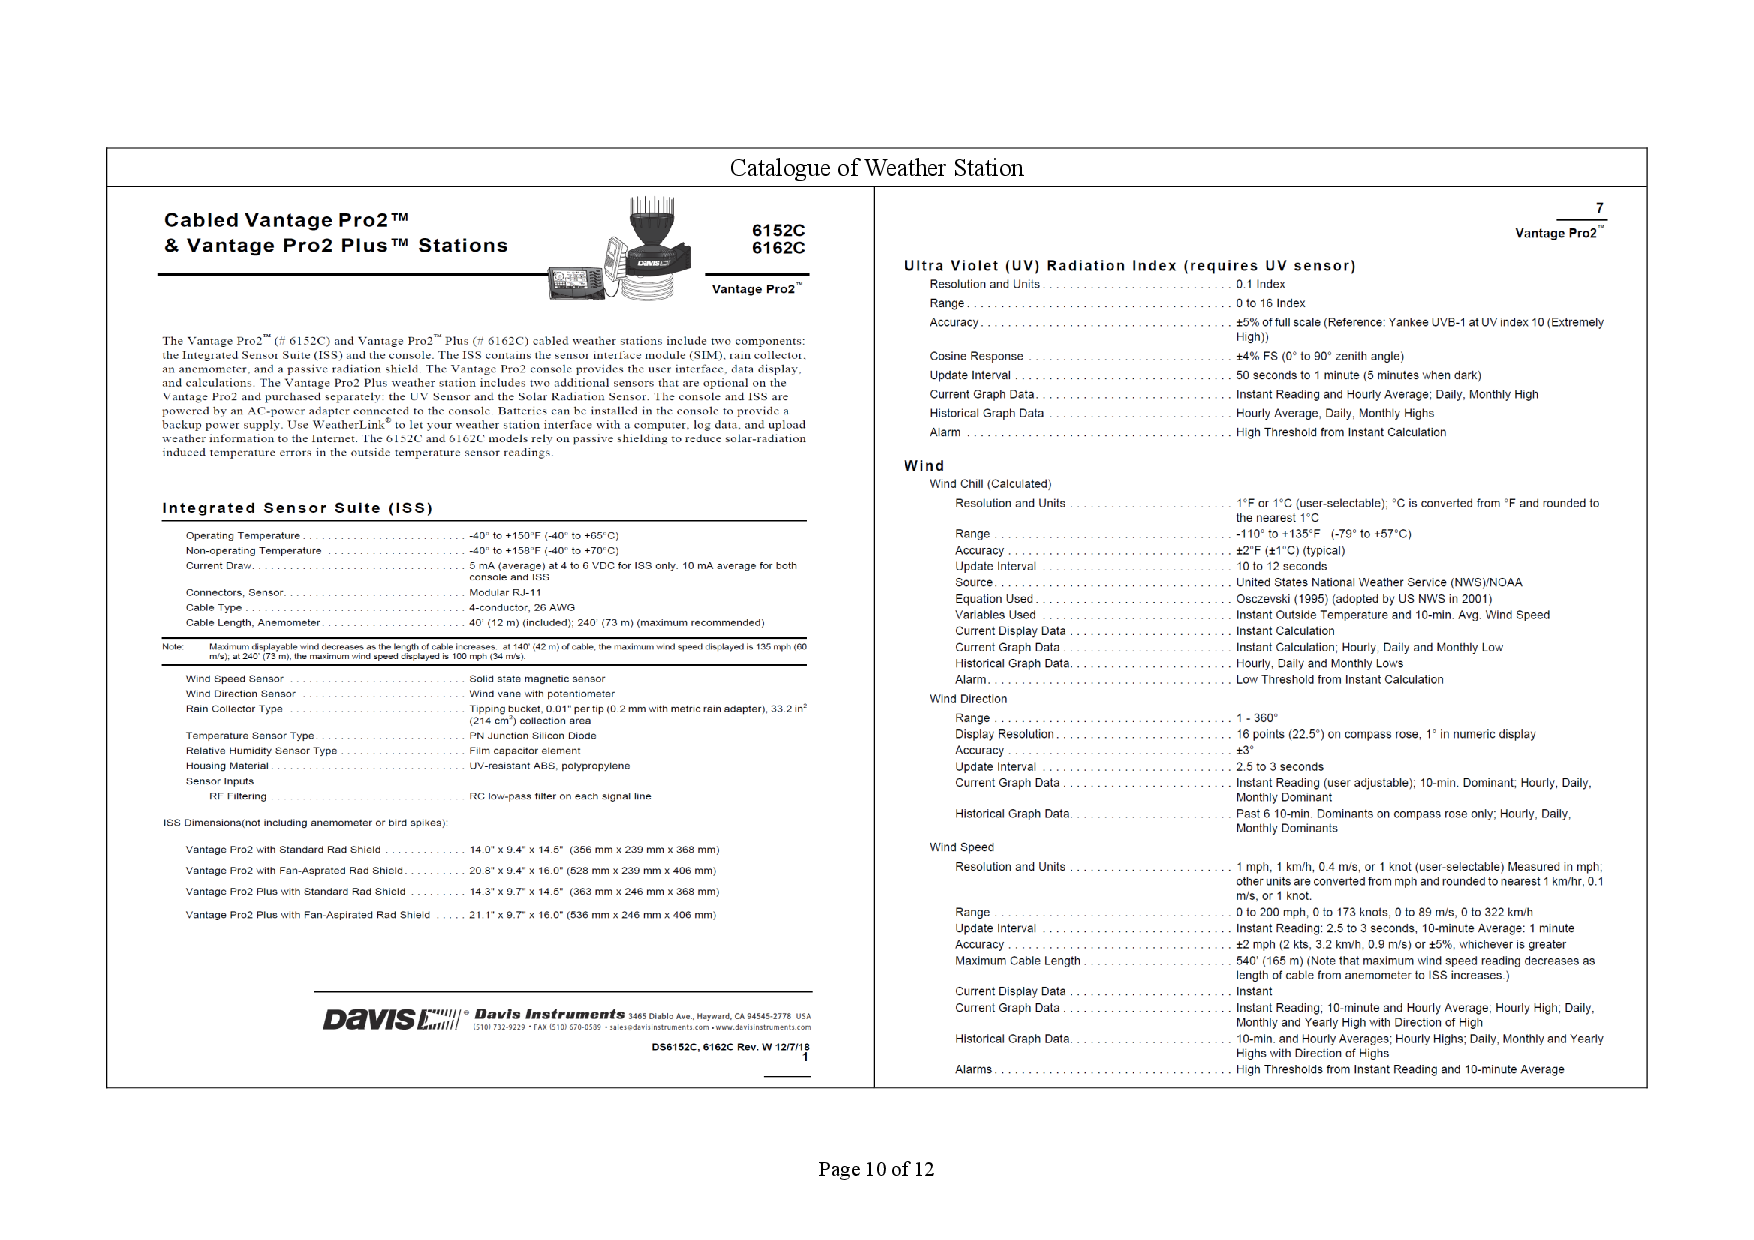
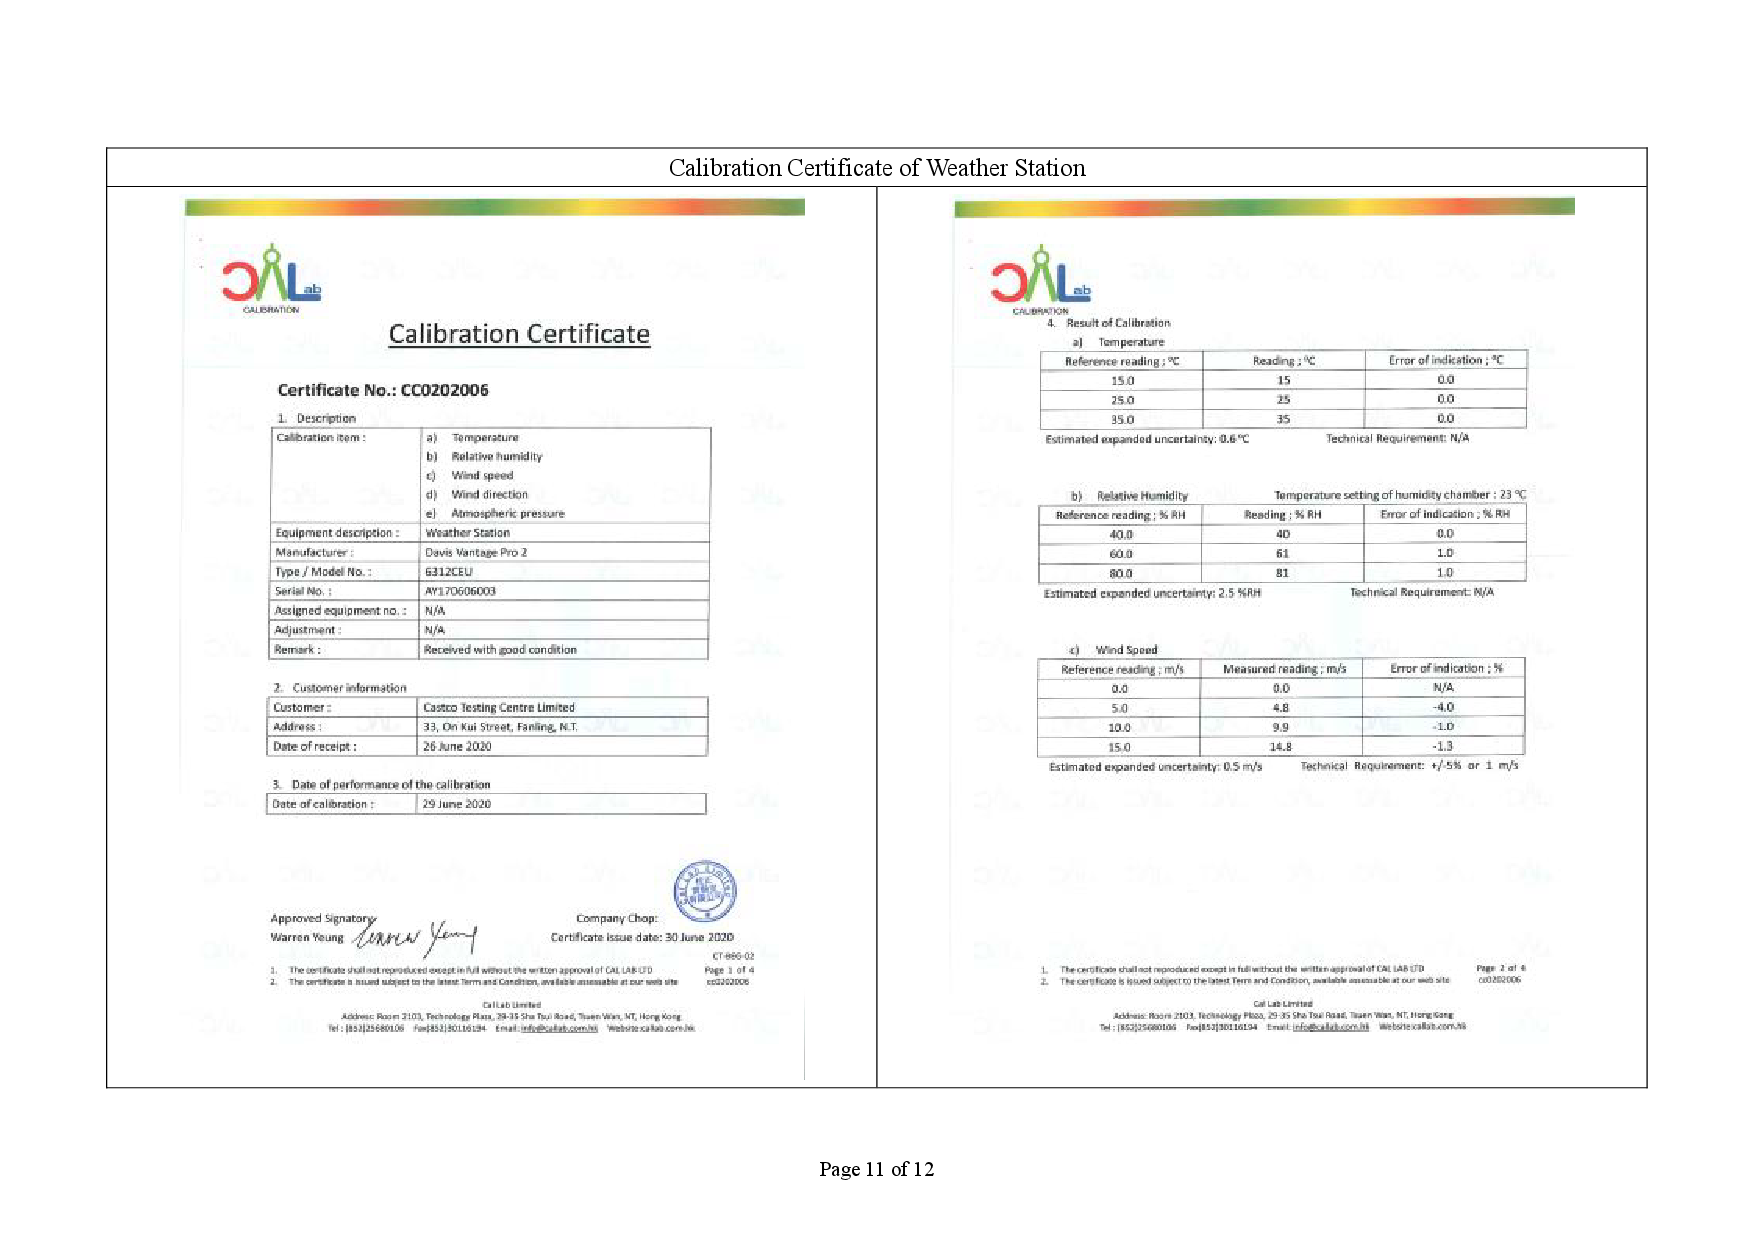
Wind Anemometer |
Davis Vantage Pro2 Weather Station |
1 |
2.7 High volume samplers (HVS) (TE-5170 X c/w of TSP sampling inlet) comprising with appropriate sampling inlets were employed for 24-hour TSP monitoring. The sampler was composed of a motor, a filter holder, a flow controller and a sampling inlet and its performance specification complied with that required by USEPA Standard Title 40, Code of Federation Regulations Chapter 1 (Part 50).
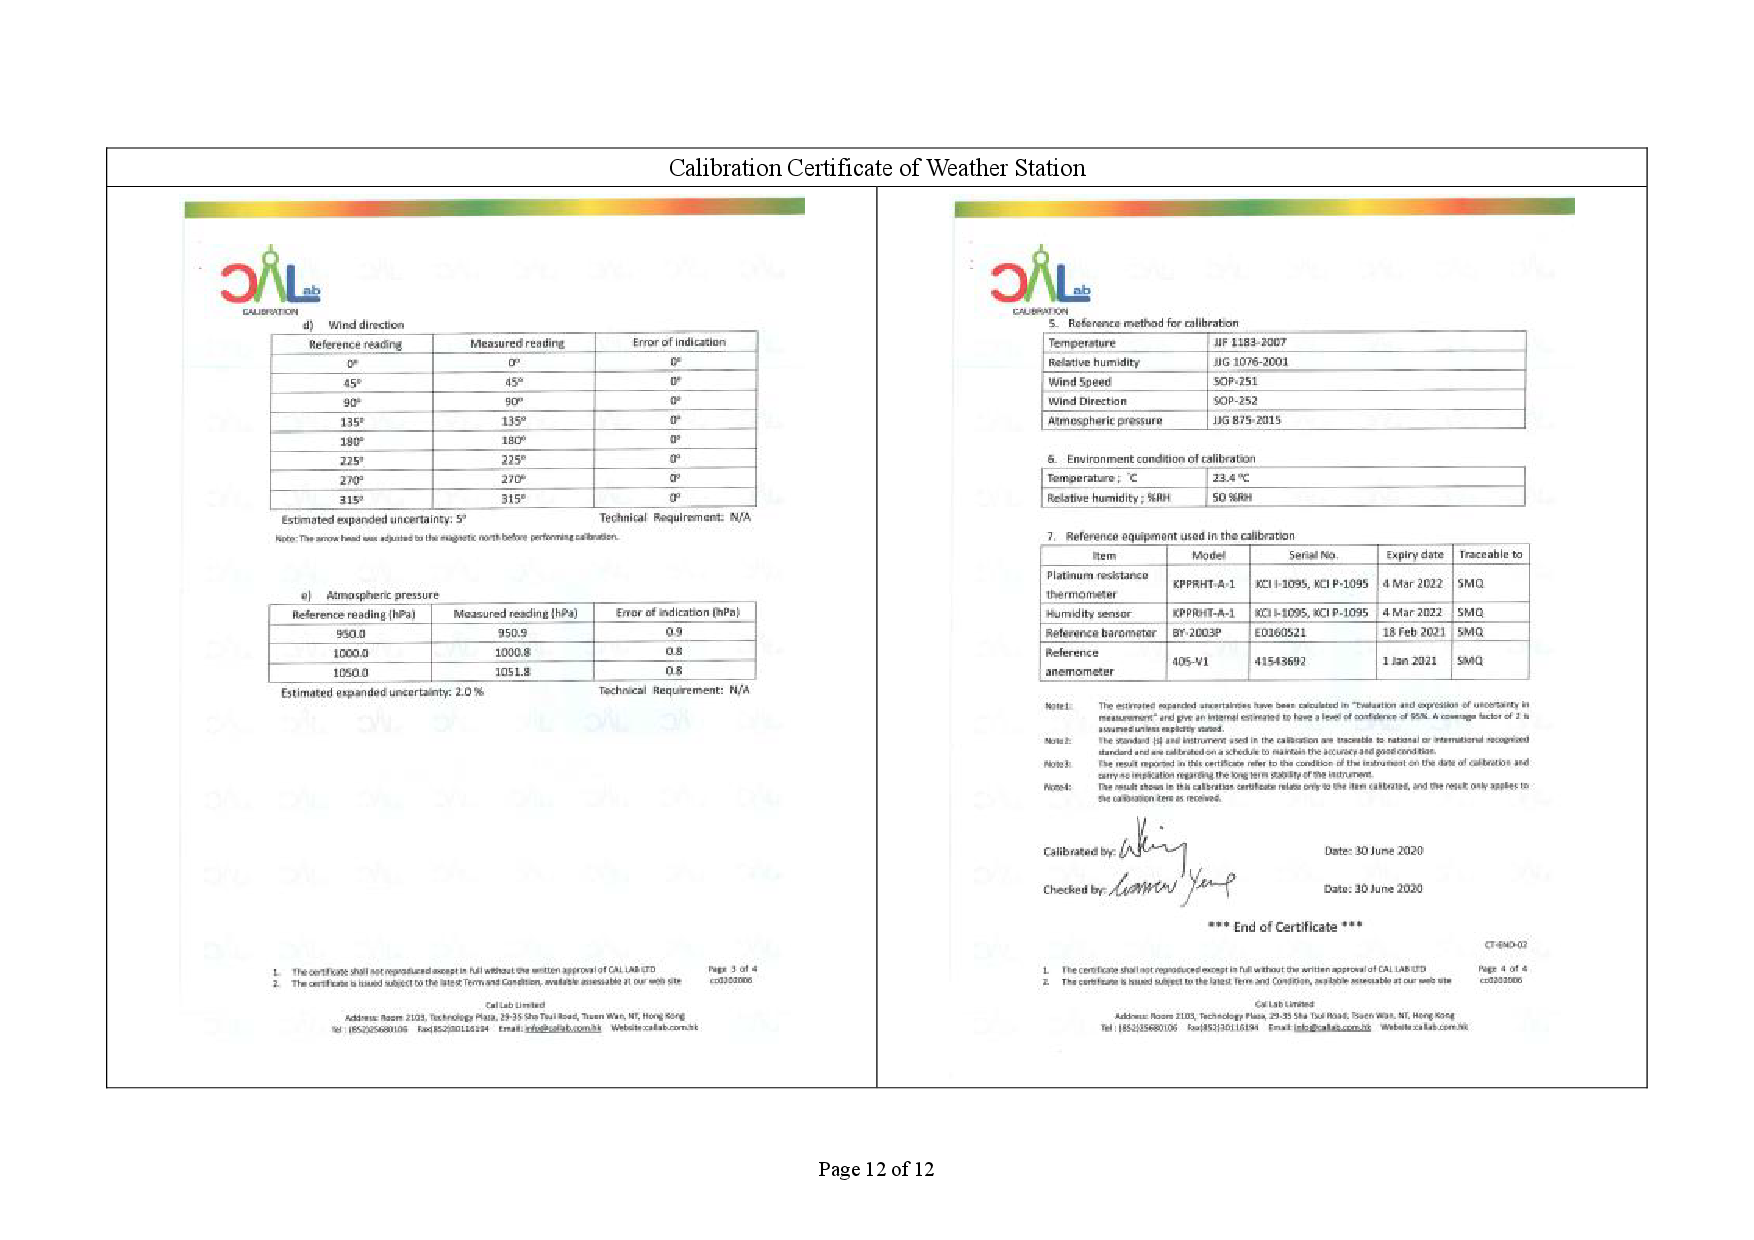
2.8 Calibration certificates, catalogue of equipment are given in Appendix E.
24-hour TSP Monitoring
Operating/Analytical Procedures
2.9 Setup criteria of HVS are shown as follows:
2.10 Prior to the commencement of the dust sampling, the flow rate of the HVS was properly set (between 1.1 m3/min. and 1.7 m3/min.) in accordance with the manufacturer's instruction to within the range recommended in USEPA Standard Title 40, CFR Part 50.
2.11 For TSP sampling, Glass Fiber Filter Media 8" x 10" have a collection efficiency of > 99 % for particles of 0.3 μm diameter were used.
2.12 The power supply was checked to ensure the sampler worked properly. On sampling, the sampler was operated for 5 minutes to establish thermal equilibrium before placing any filter media at the designated air monitoring station.
2.13 The filter holding frame was removed by loosening the four nuts and a weighted and conditioned filter was carefully centered with the stamped number upwards, on a supporting screen.
2.14 The filter was aligned on the screen so that the gasket formed an airtight seal on the outer edges of the filter. Then the filter holding frame was tightened to the filter holder with swing bolts. The applied pressure was sufficient to avoid air leakage at the edges.
2.15 The shelter lid was closed and secured with the aluminium strip.
2.16 The timer was programmed. Information was recorded on the record sheet, which included the starting time, the weather condition and the filter number (the initial weight of the filter paper can be found out by using the filter number).
2.17 After sampling, the filter was removed from the HVS and put into a clean and labeled seal plastic bag to avoid cross contamination. The elapsed time was also be recorded. The sampled filters were sent to the Castco Testing Centre Limited for weighting.
2.18 Before weighing, all filters were equilibrated in a conditioning environment for 24 hours. The conditioning environment temperature was between 25°C and 30°C and not vary by more than ±3°C; the relative humidity (RH) was less than 50% and not vary by more than ±5%. A convenient working RH is 40%.
Maintenance/Calibration
2.19 The following maintenance/calibration are required for the HVS:
1-hour TSP Monitoring
Measurement Procedures
2.20 The measurement procedures of the 1-hour TSP were conducted in accordance with the Manufacturer’s Instruction Manual as follows:
Maintenance/Calibration
2.21 The following maintenance/calibration are required for the direct dust meters:
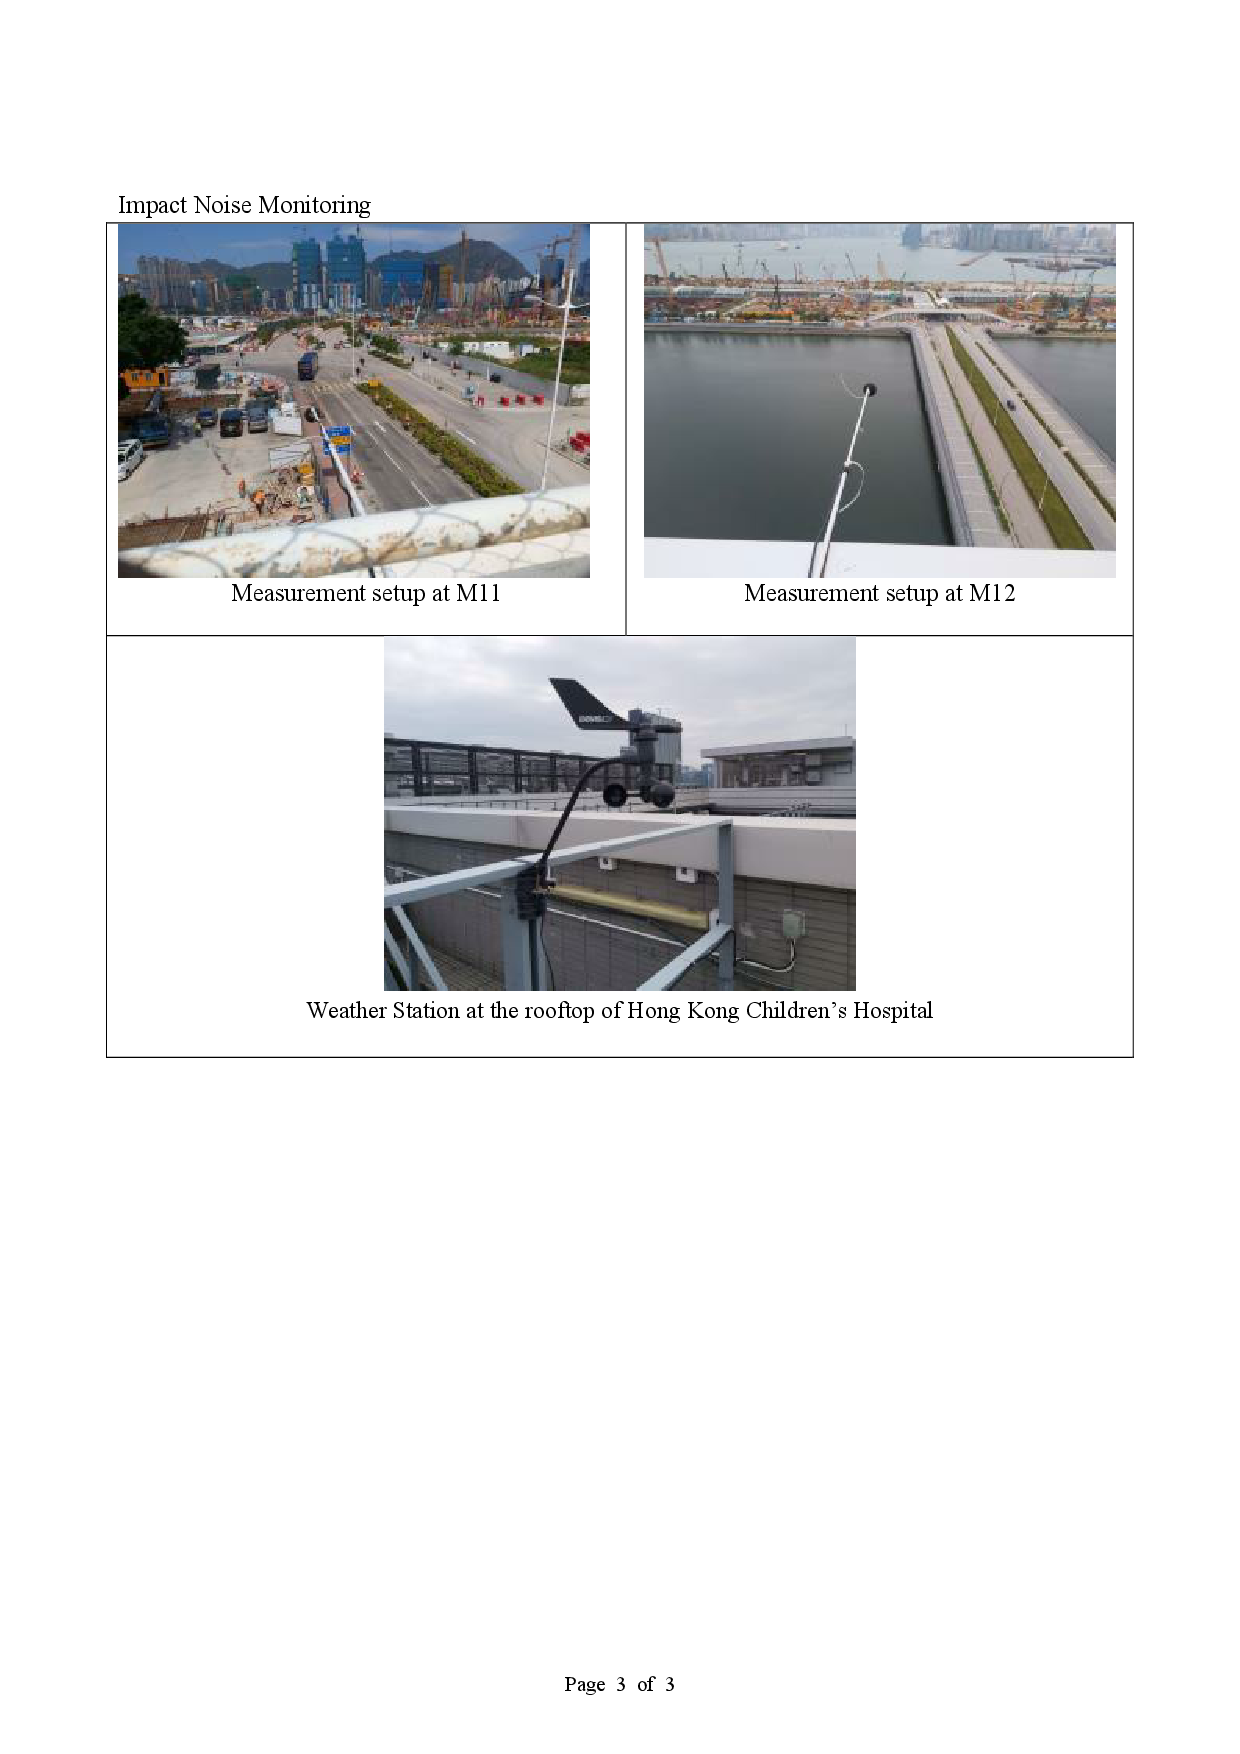
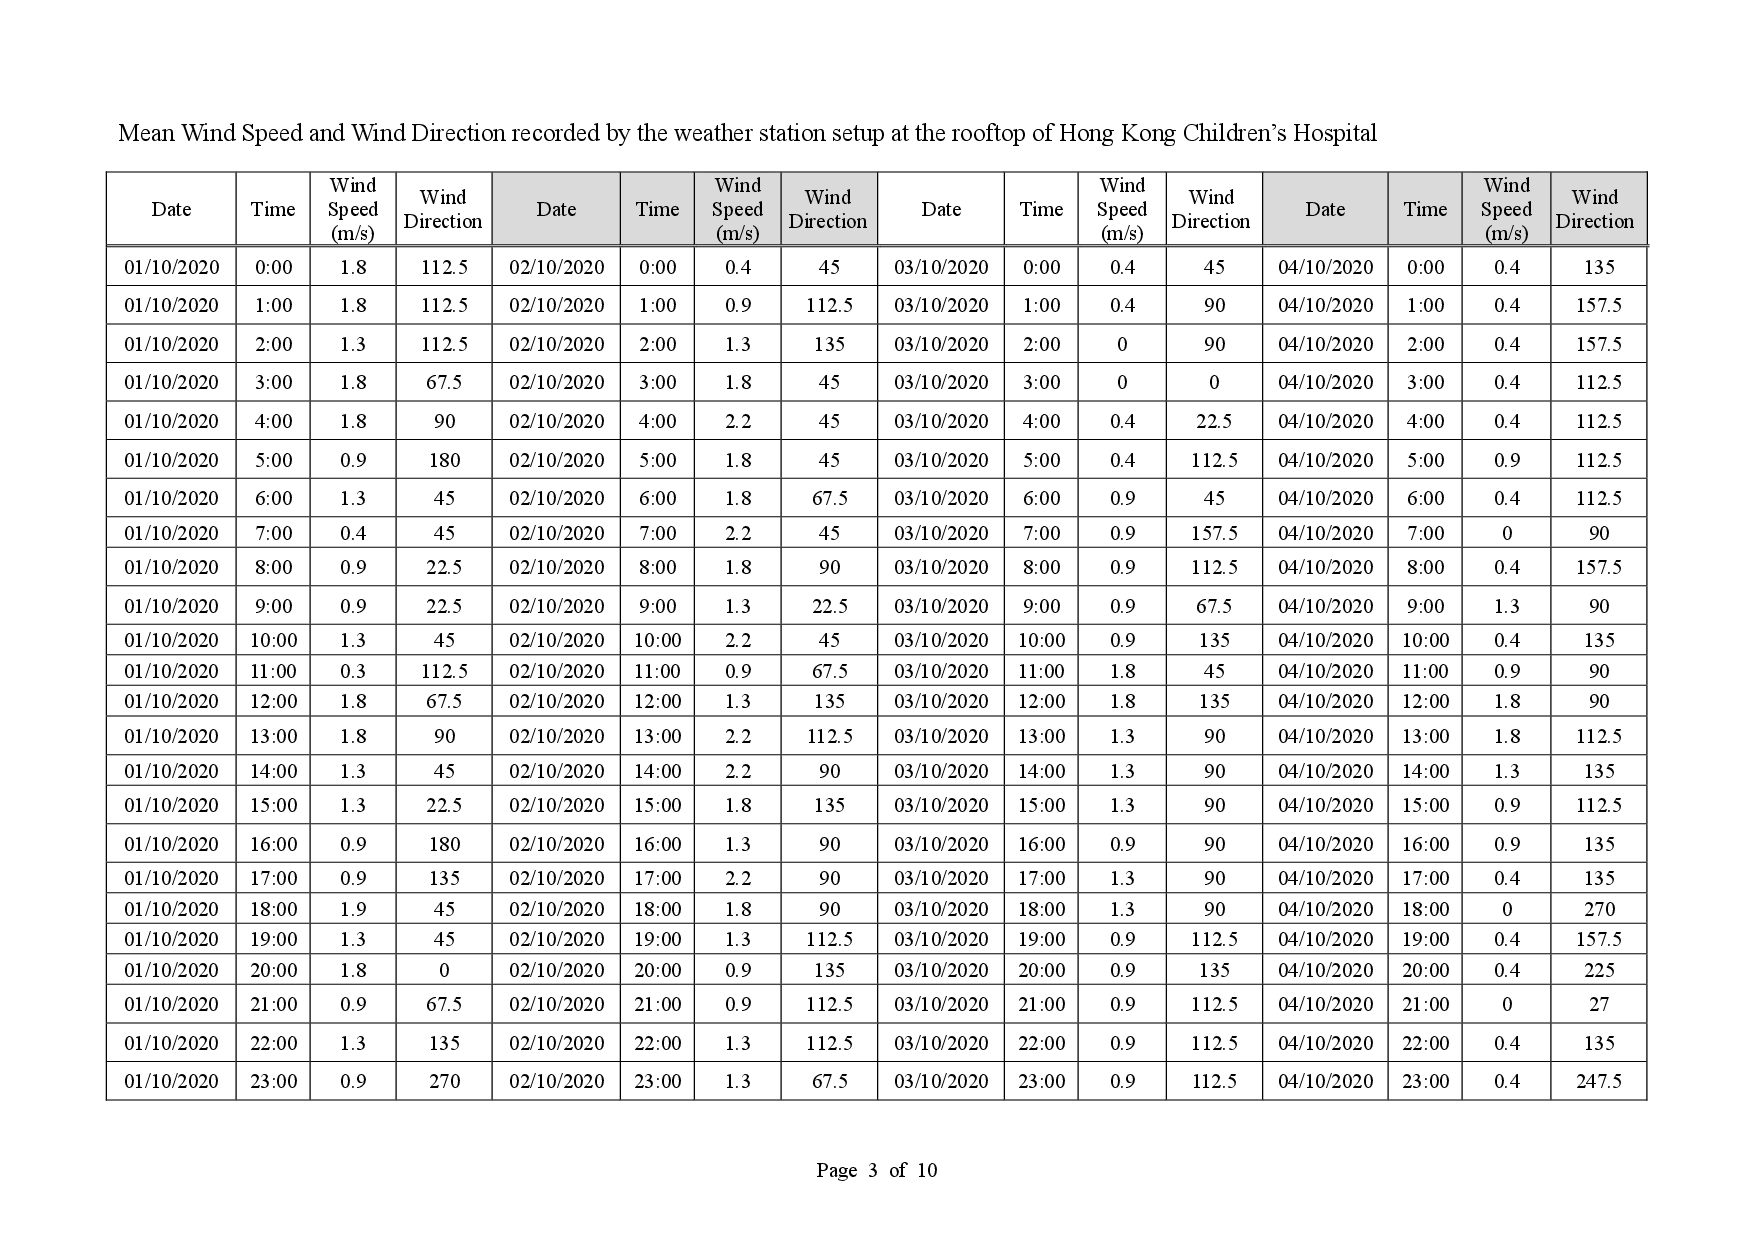
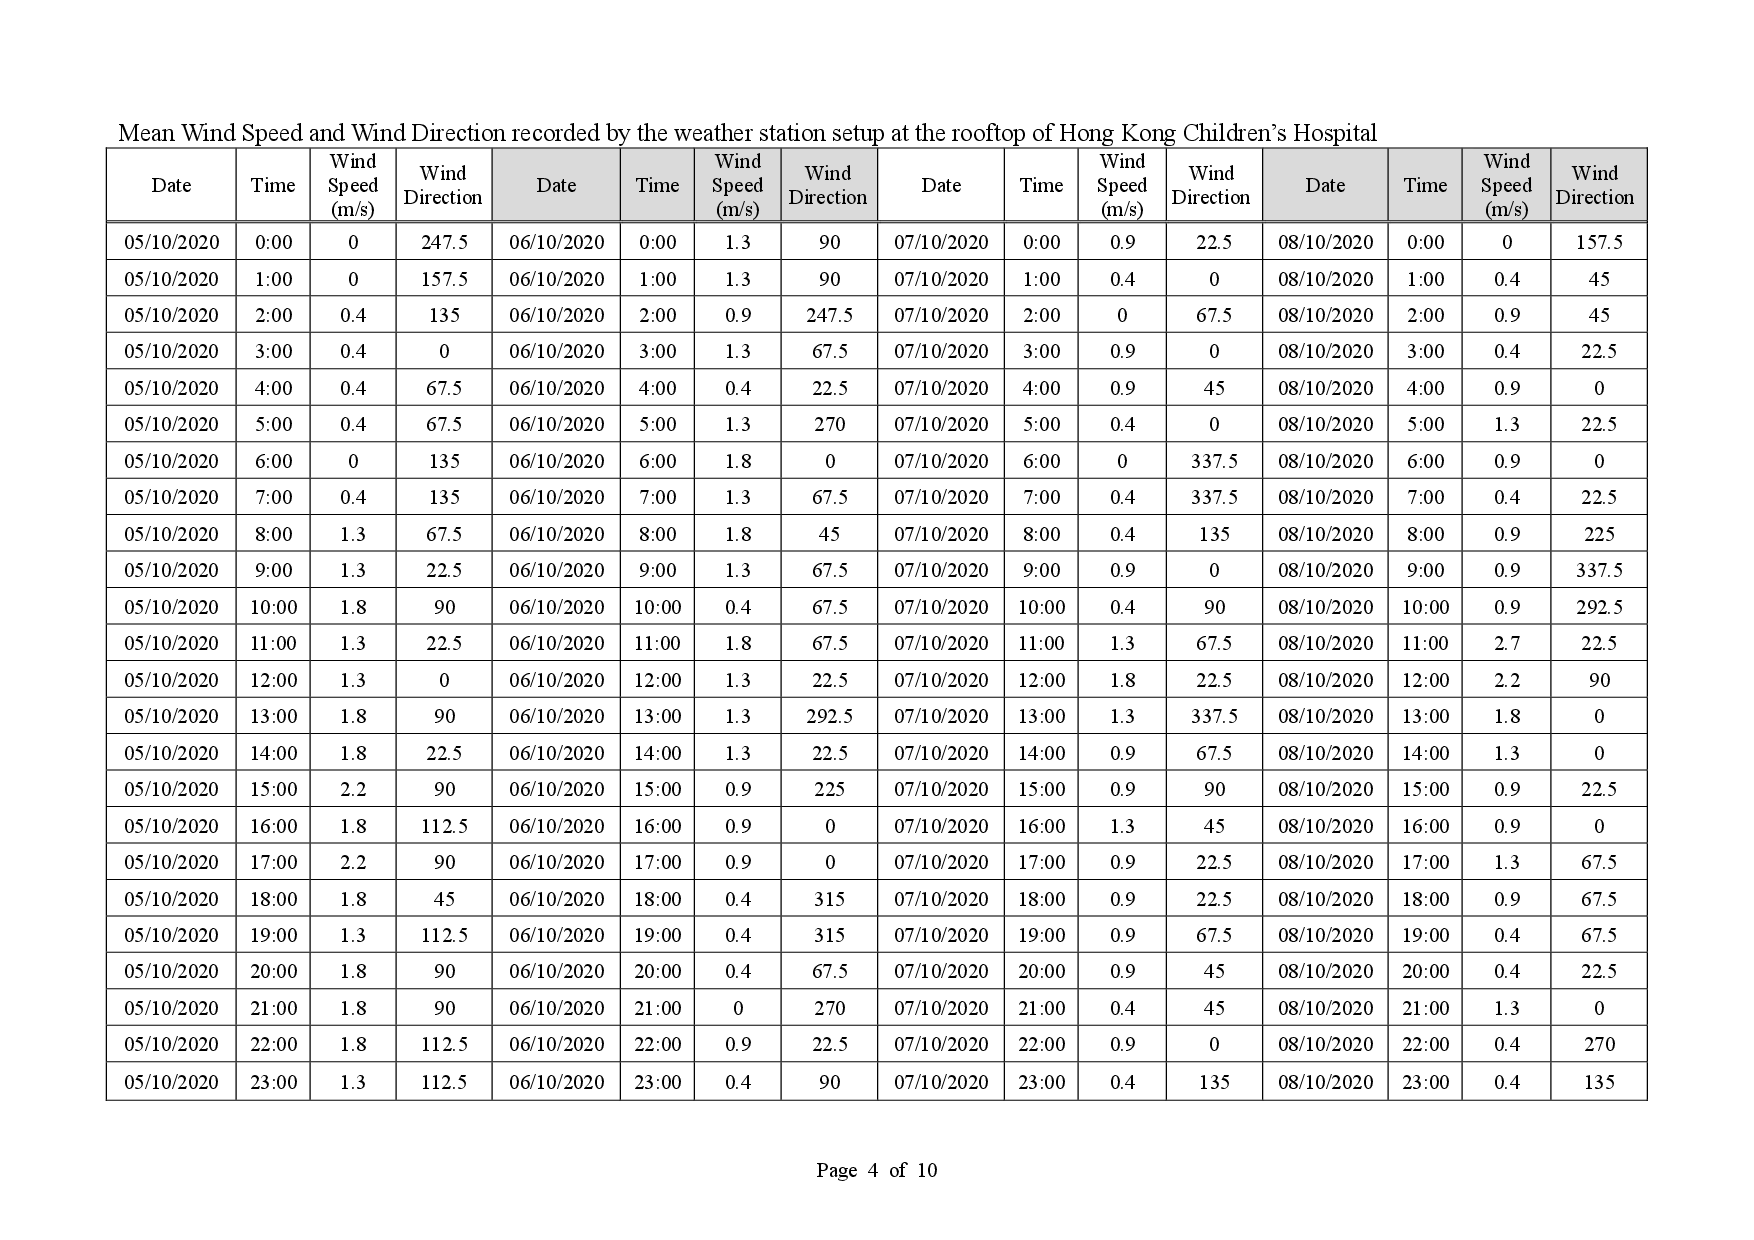
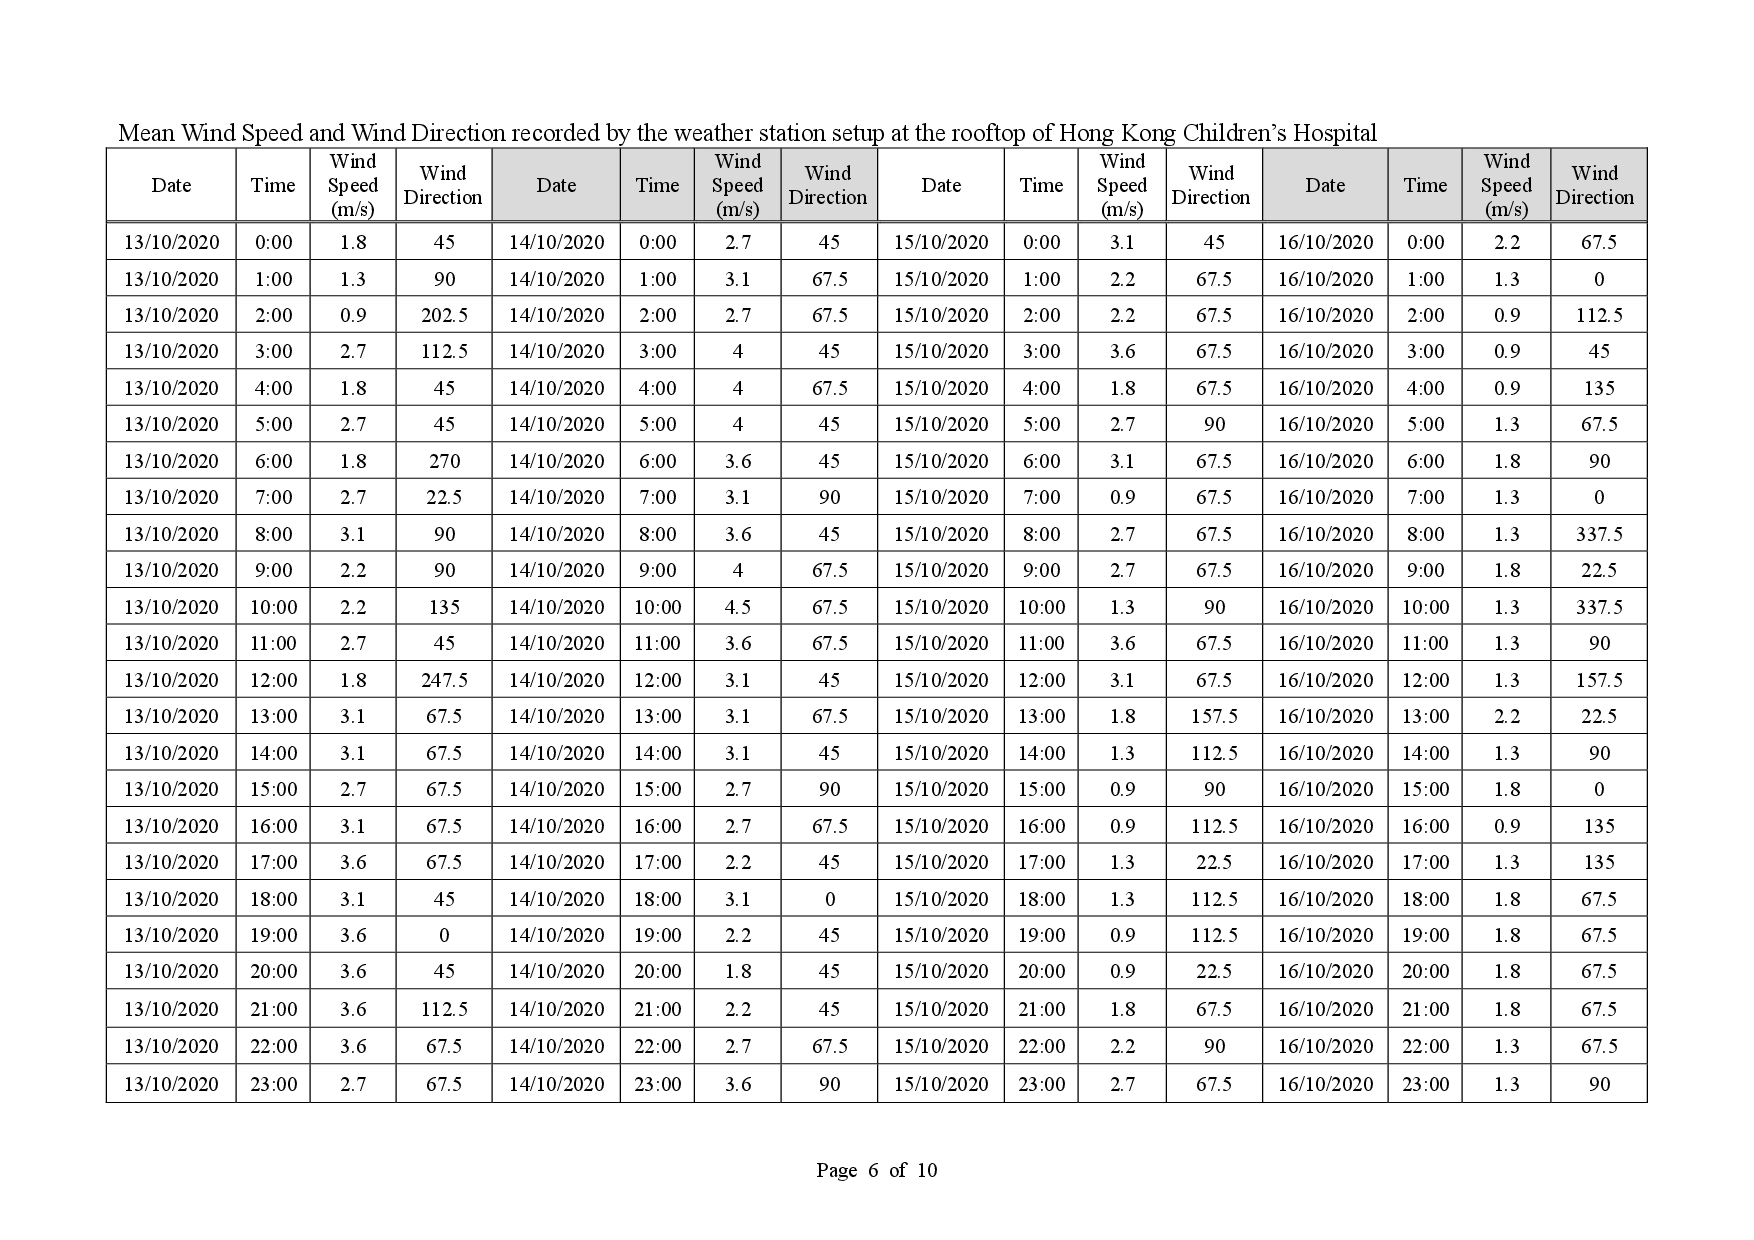
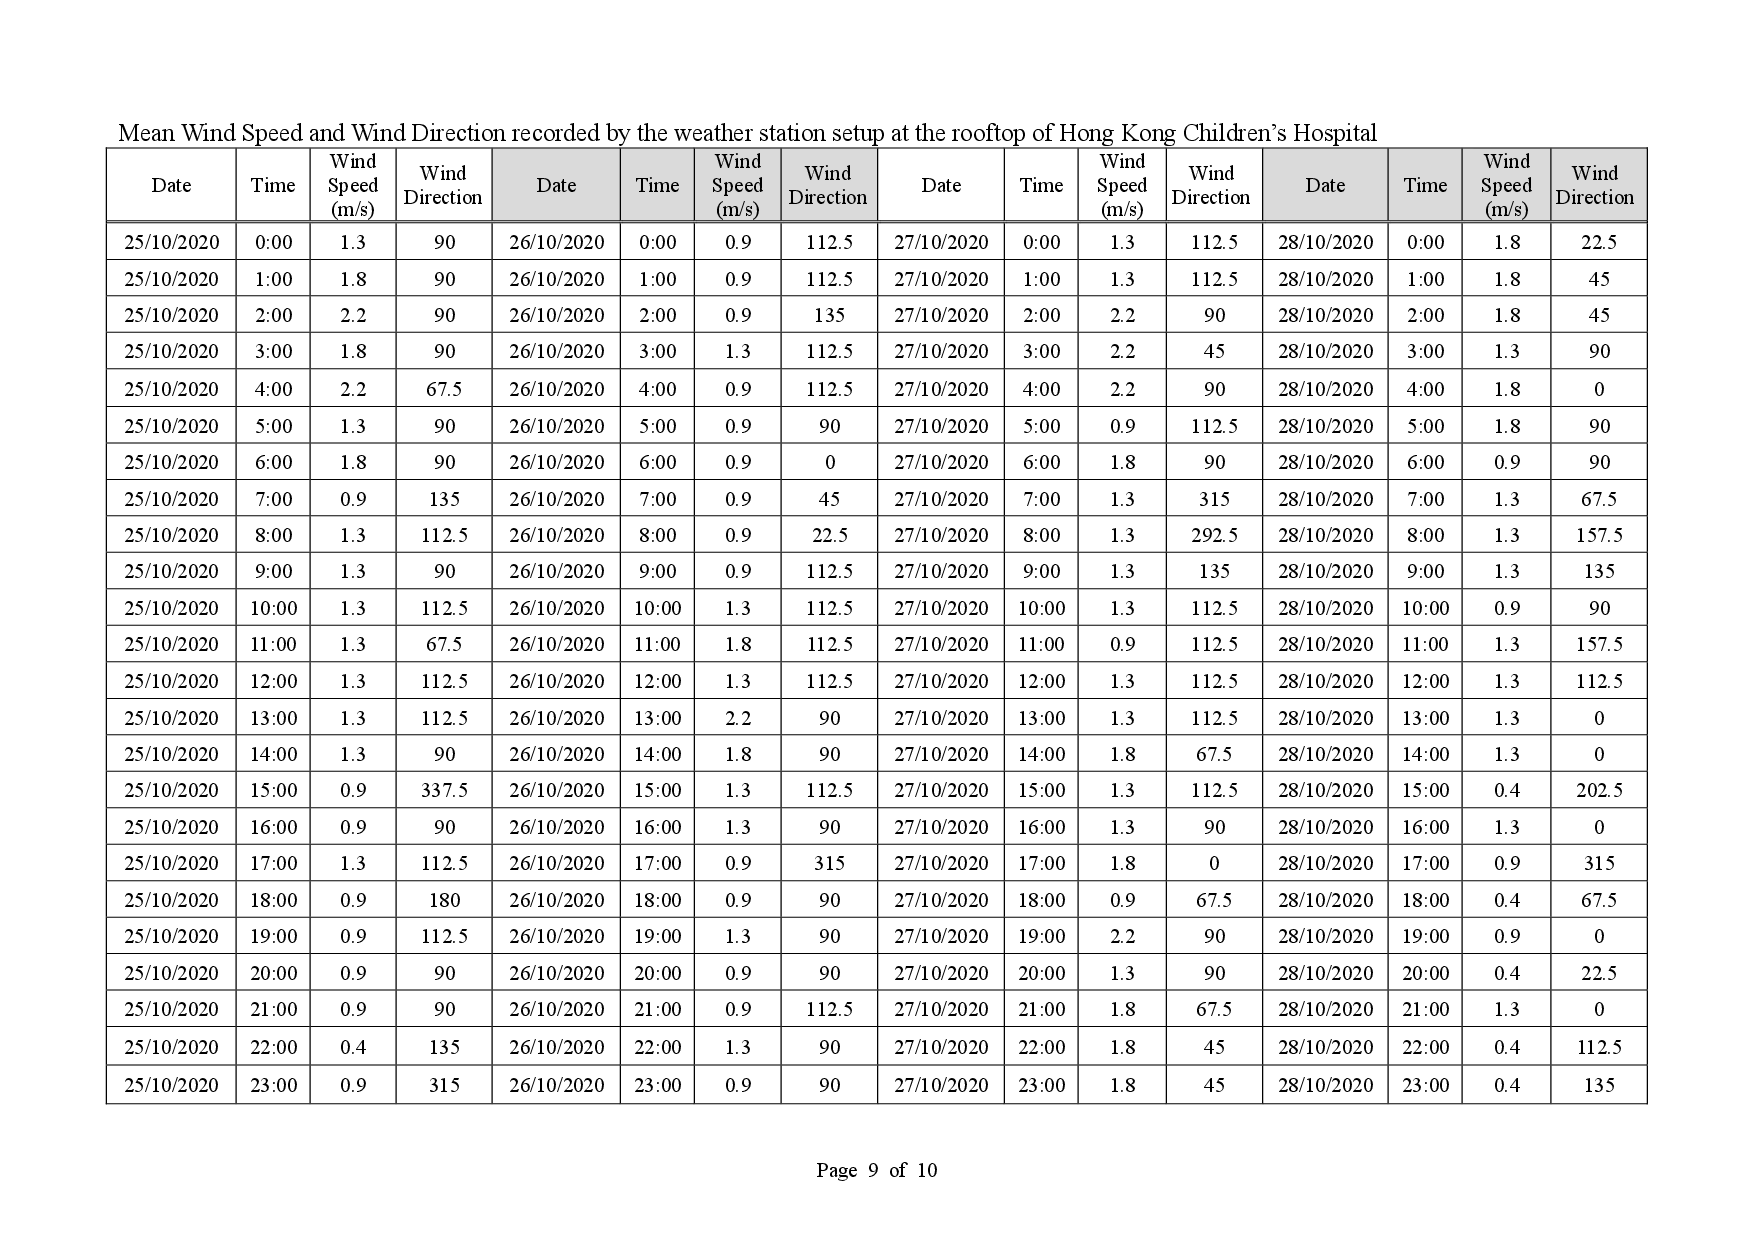
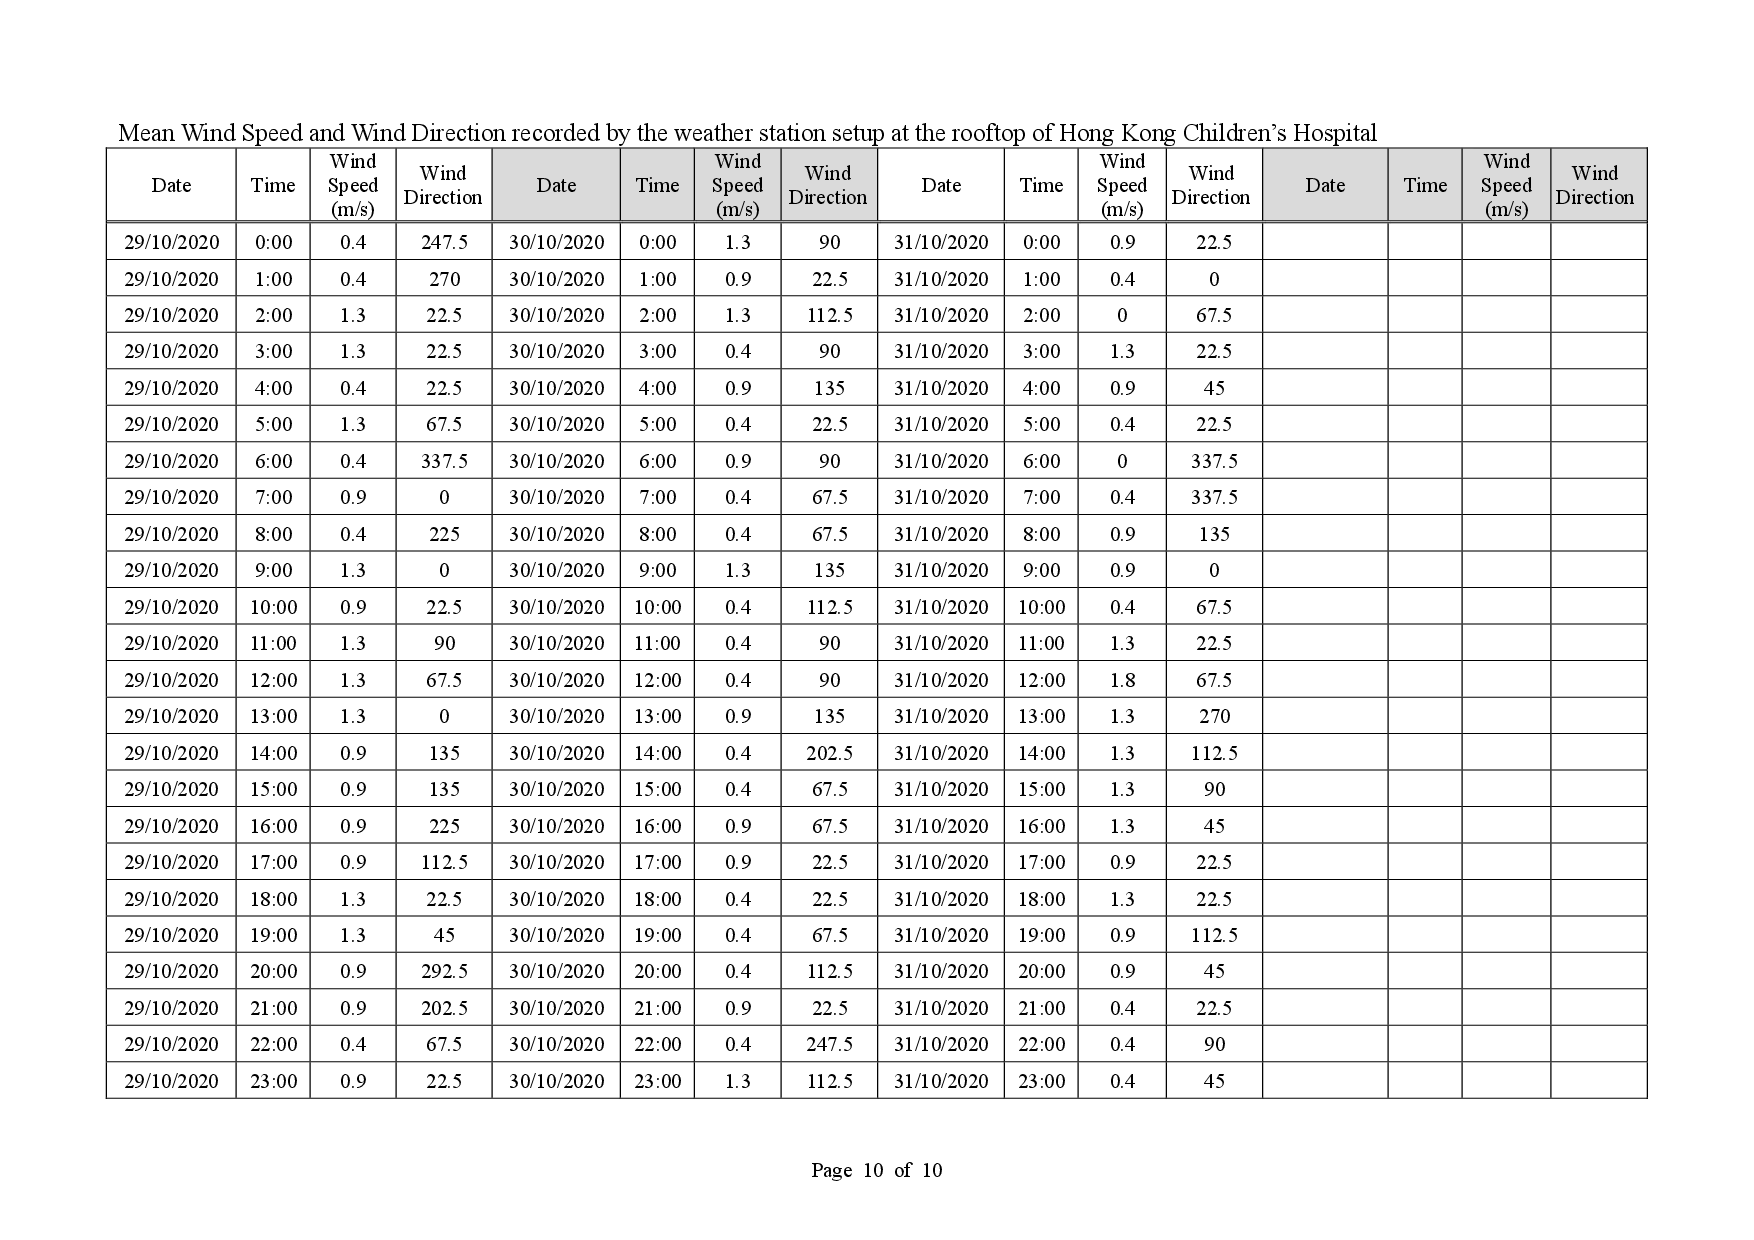
2.22 Wind Anemometer was installed at the roof-top of AM7 - Hong Kong Children’s Hospital with 10m above ground and clear of constructions or turbulence caused by the buildings.
2.23 The wind data was captured by a data logger and the data was downloaded at least once per month for analysis.
2.24 The wind data monitoring equipment will be re-calibrated at least once every six months.
2.25 Wind direction is divided into 16 sectors of 22.5 degrees each.
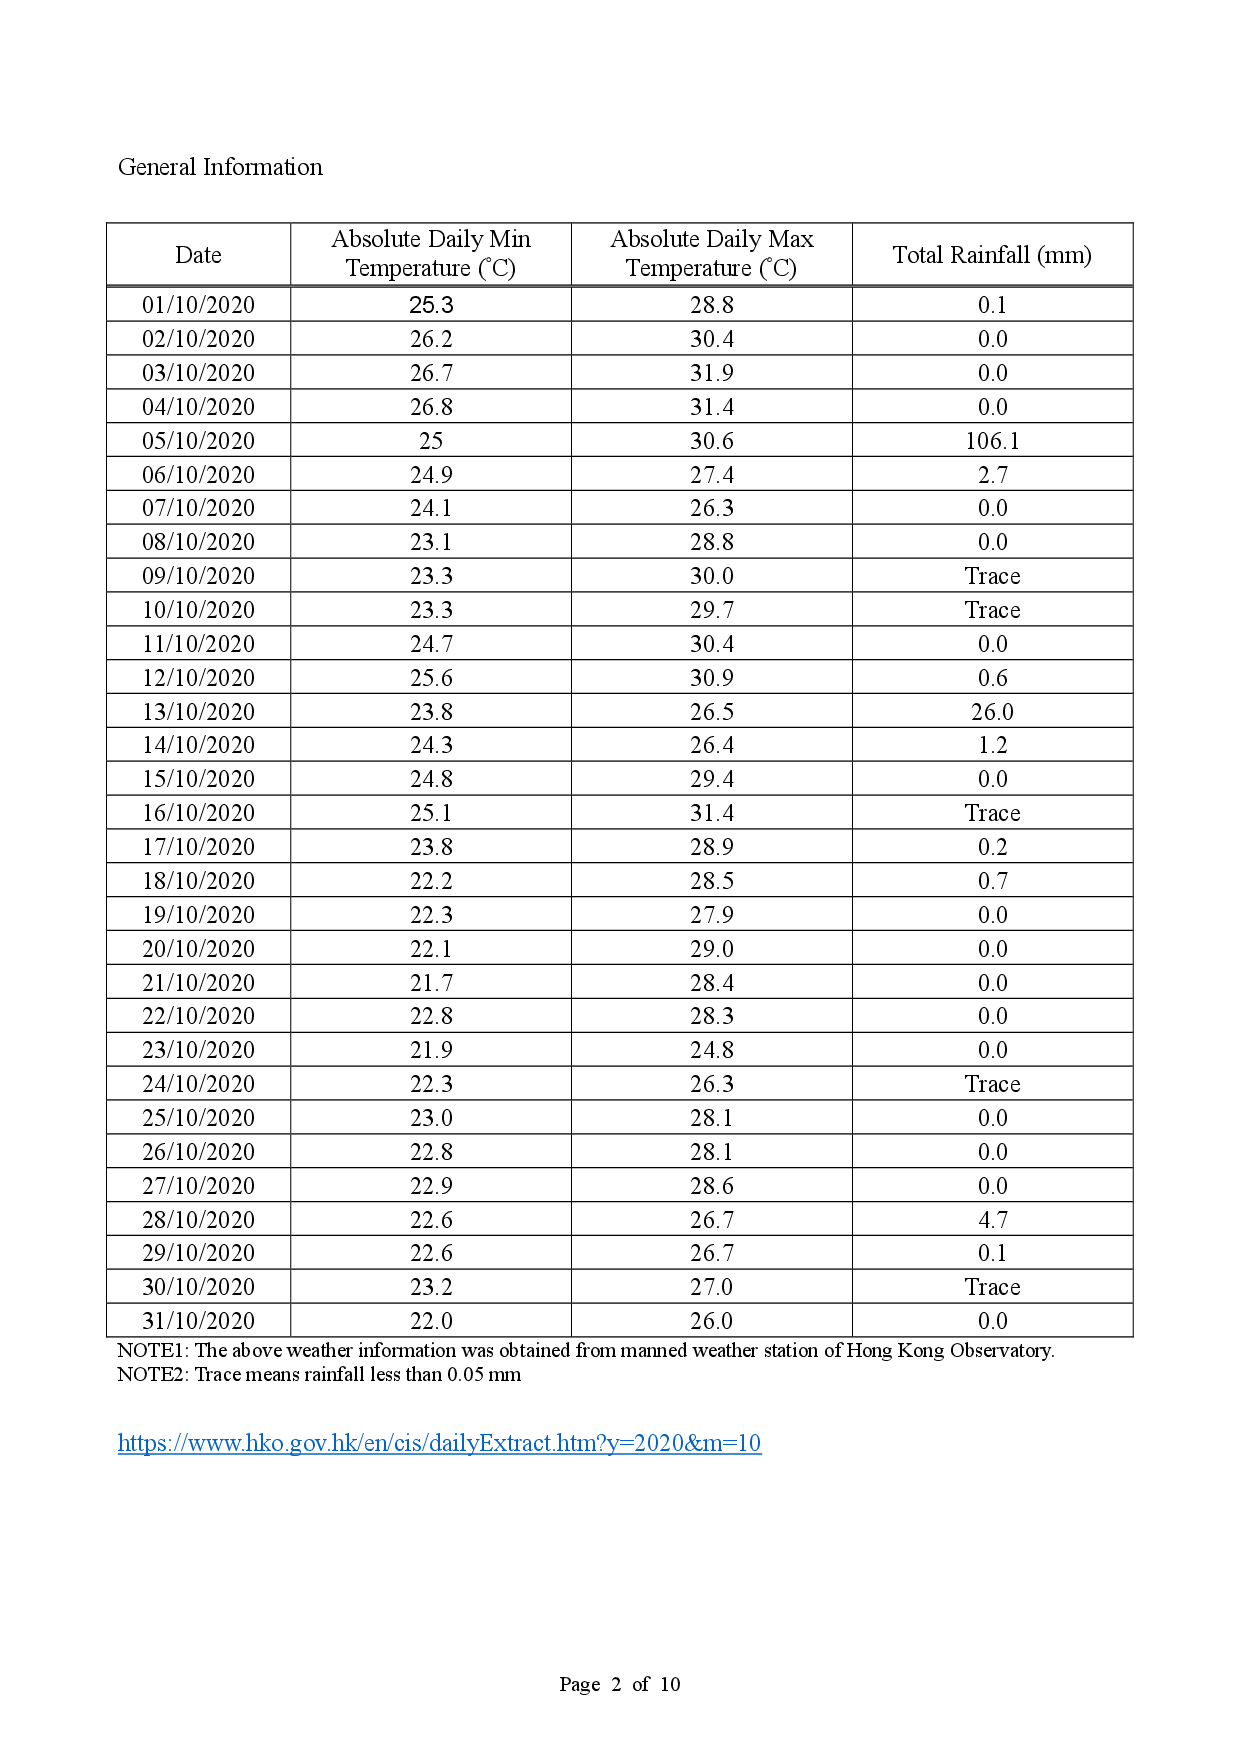
2.26 Details of weather information during the monitoring period are shown in Appendix F.
2.27 The Action and Limit Levels of 24-hour average TSP and 1-hour average TSP are summarized in Table 2.4 and Table 2.5 respectively.
|
Parameter |
Air Monitoring Station |
Action Level, mg/m3 |
Limit Level, mg/m3 |
|
24-hour average TSP |
AM3 |
182 |
260 |
|
AM4(A) |
187 |
260 |
|
|
AM7 |
181 |
260 |
|
Parameter |
Air Monitoring Station |
Action Level, mg/m3 |
Limit Level, mg/m3 |
|
1-hour average TSP |
AM3 |
297 |
500 |
|
AM4(A) |
326 |
500 |
|
|
AM7 |
315 |
500 |
2.28 Impact monitoring results for 24-hour average TSP and 1-hour average TSP levels at the designed air quality monitoring stations are summarized in Table 2.6 and Table 2.7 respectively.
|
Air Monitoring Station |
Average TSP Concentration, mg/m3 |
Range, mg/m3 |
Action Level, mg/m3 |
Limit Level, mg/m3 |
|
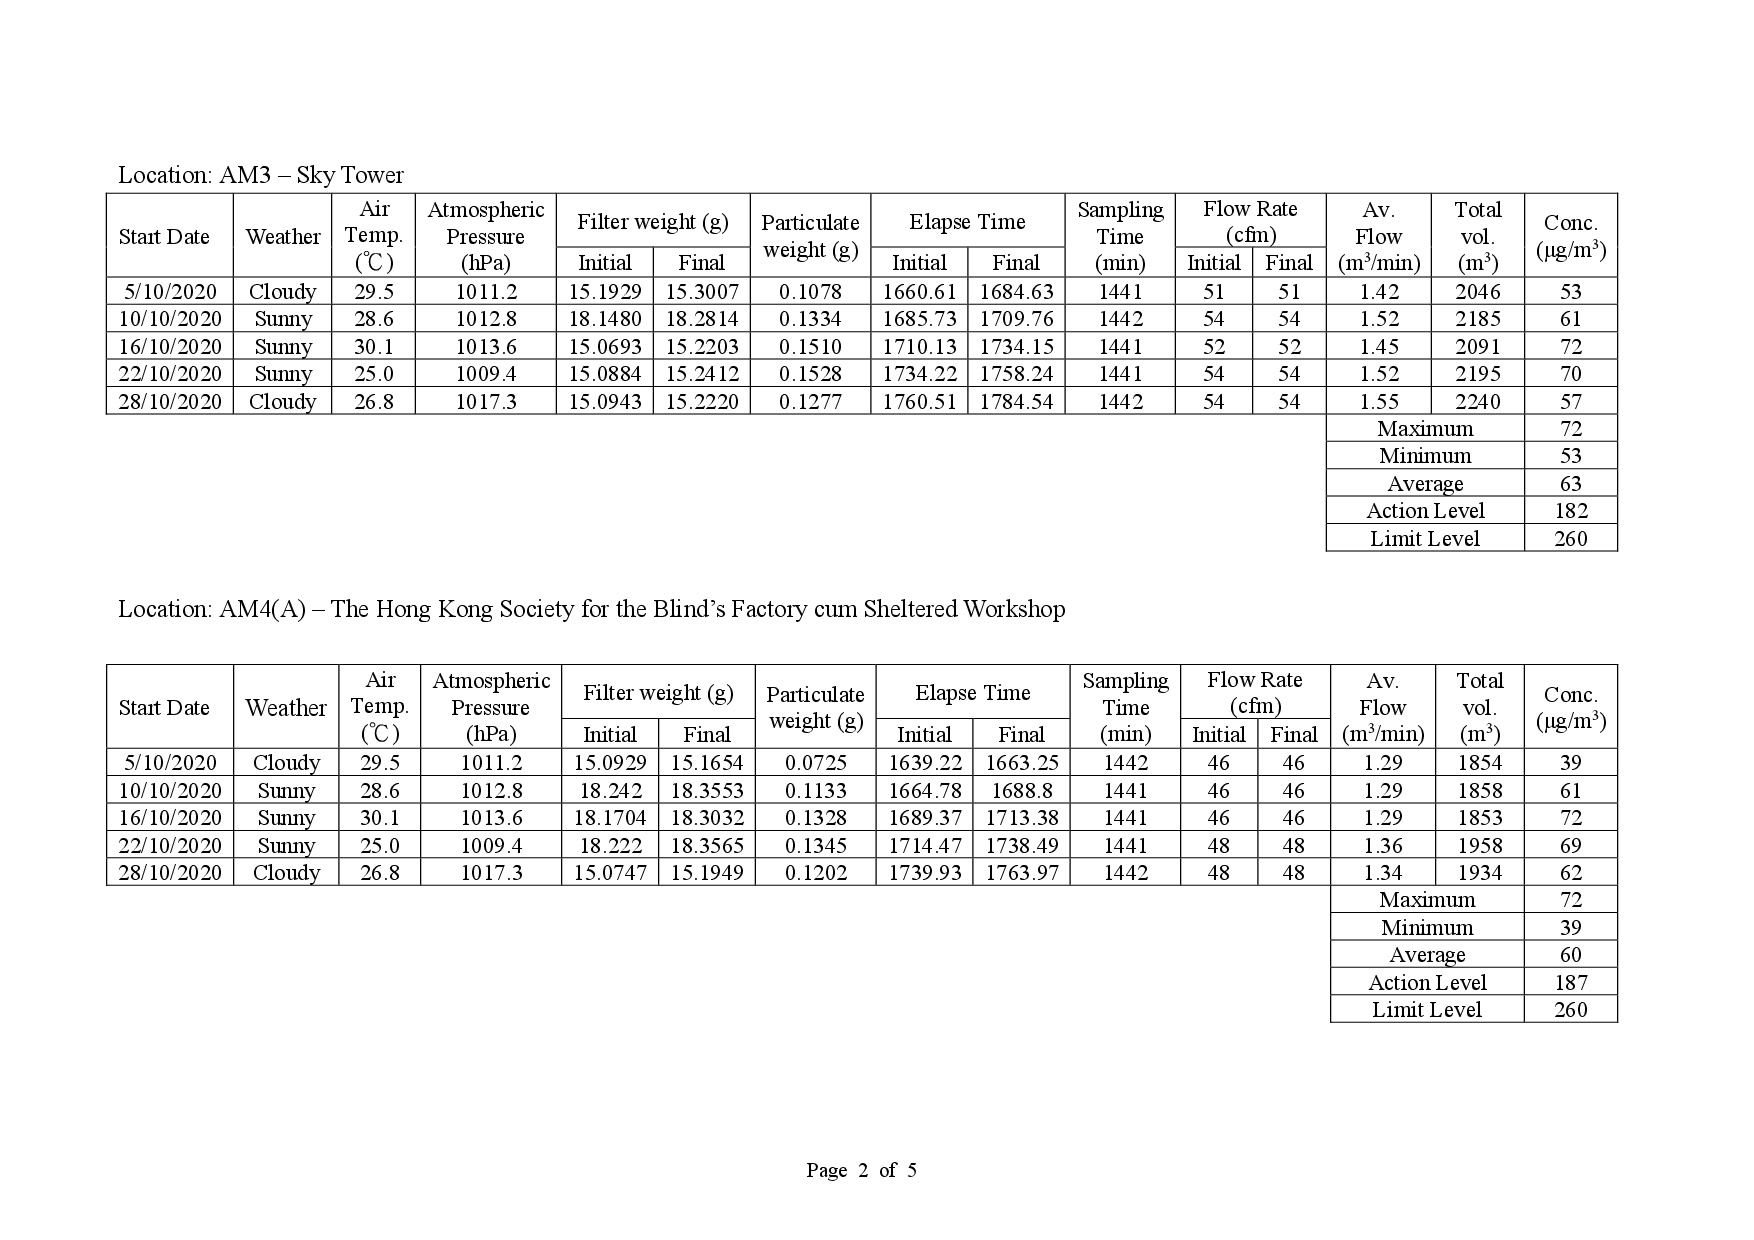
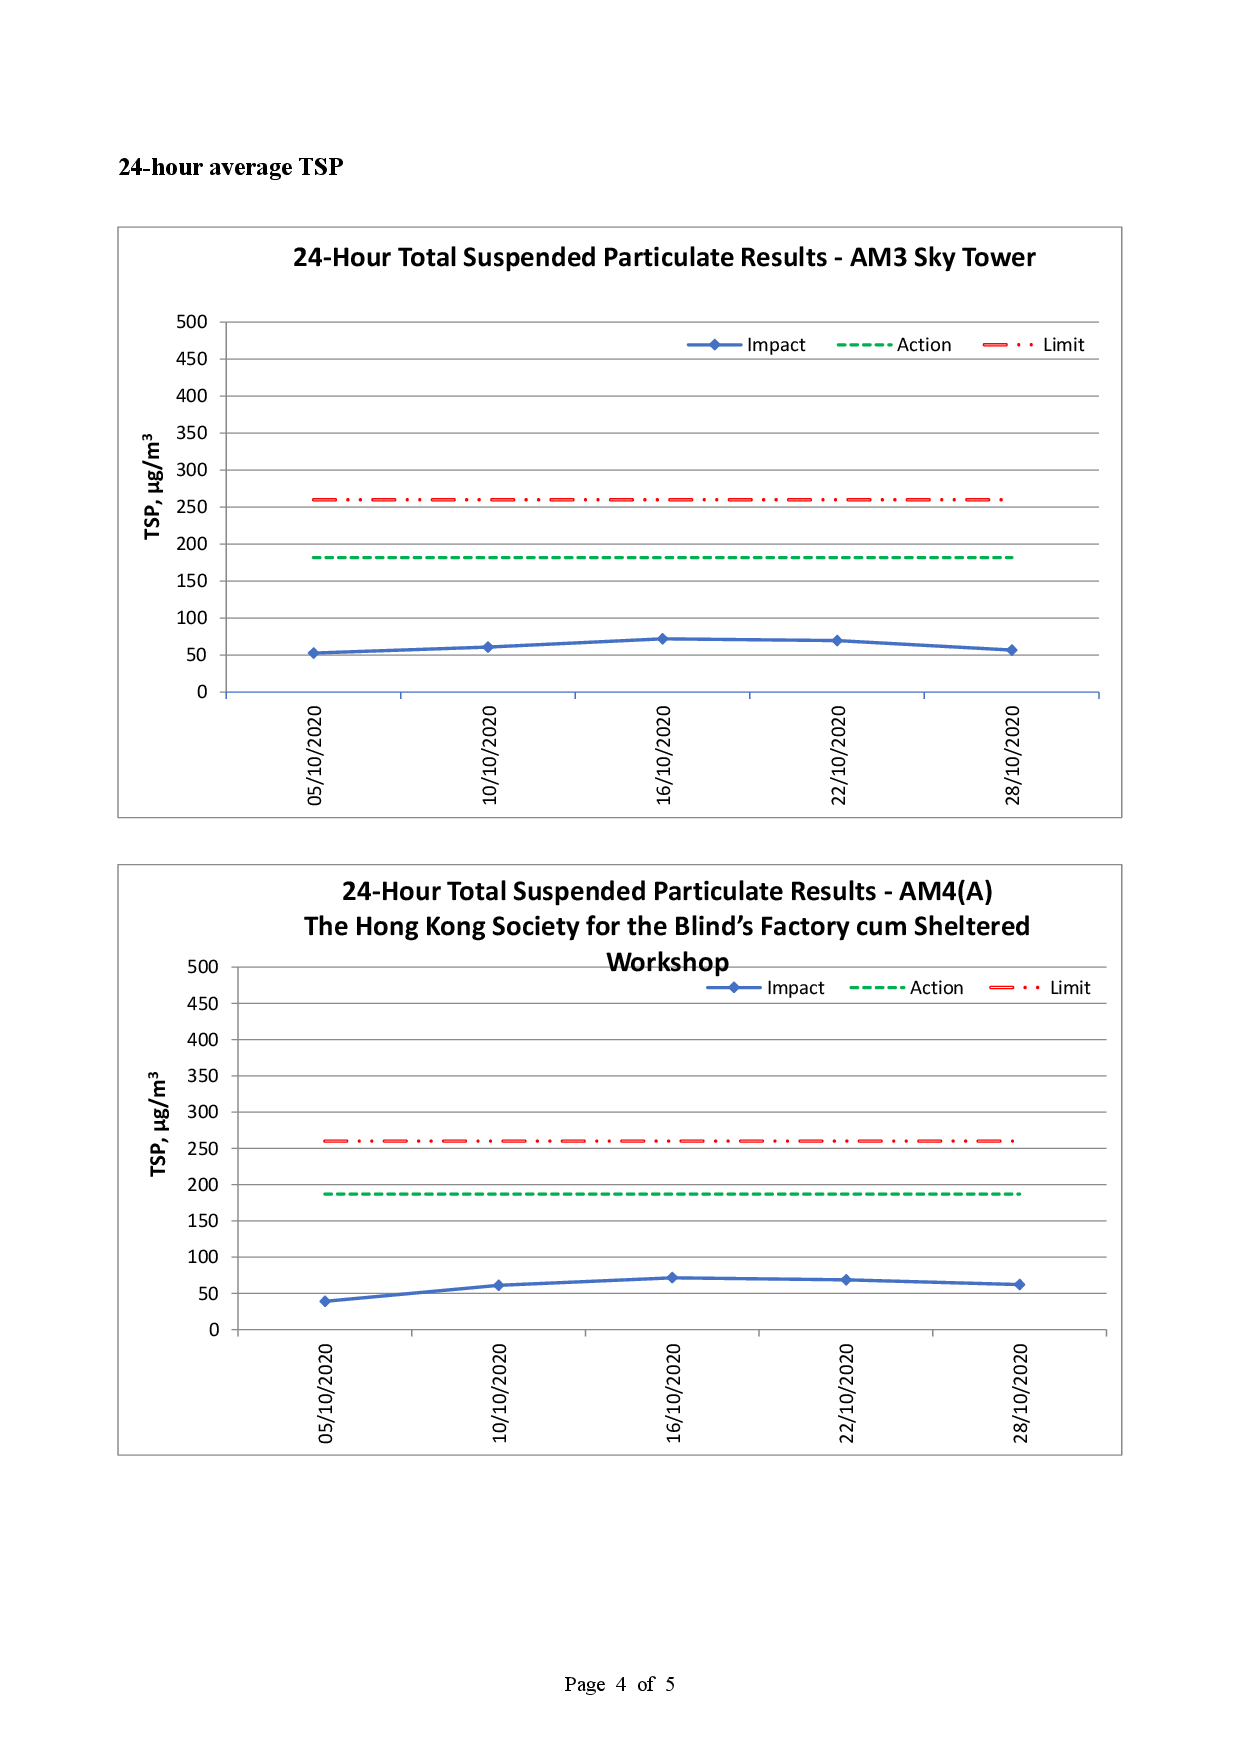
AM3 |
63 |
53 – 72 |
182 |
260 |
|
AM4(A) |
60 |
39 – 72 |
187 |
260 |
|
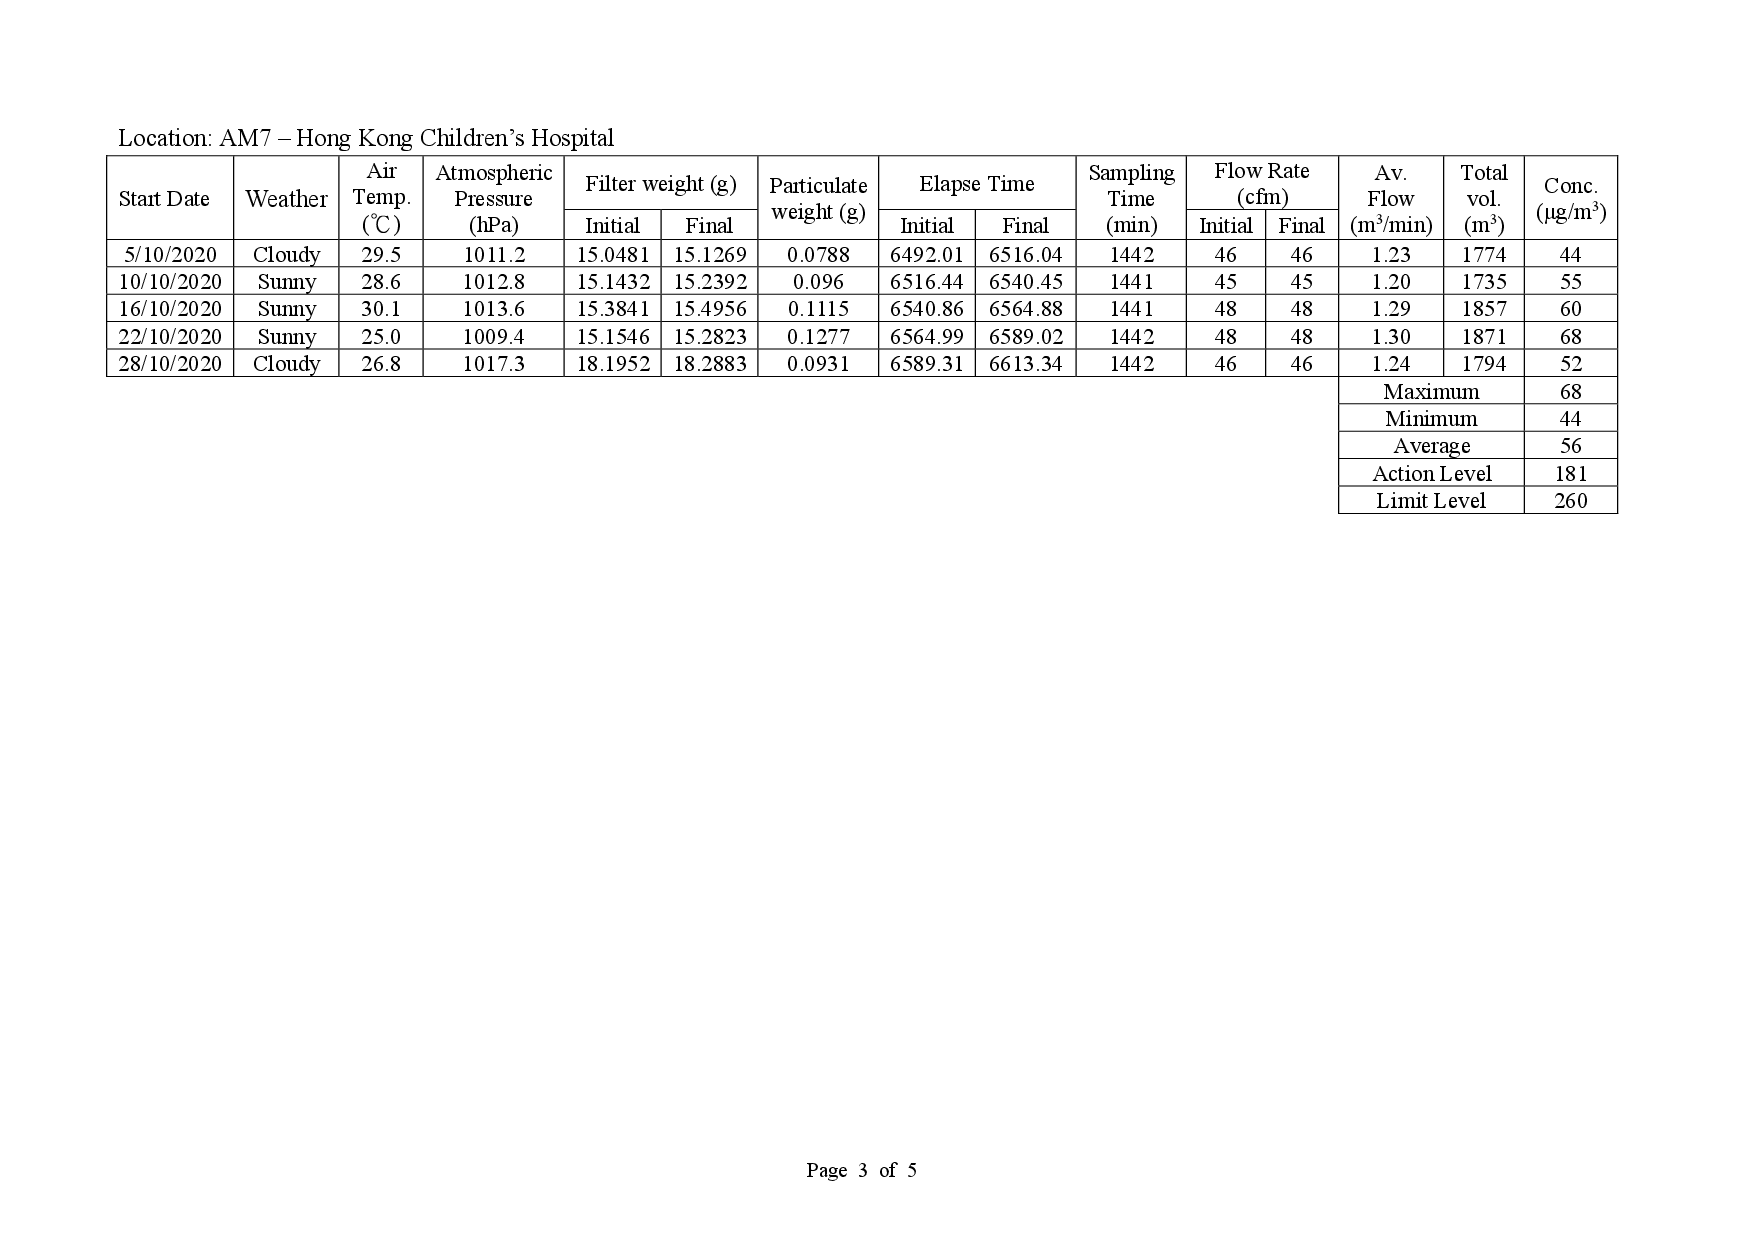
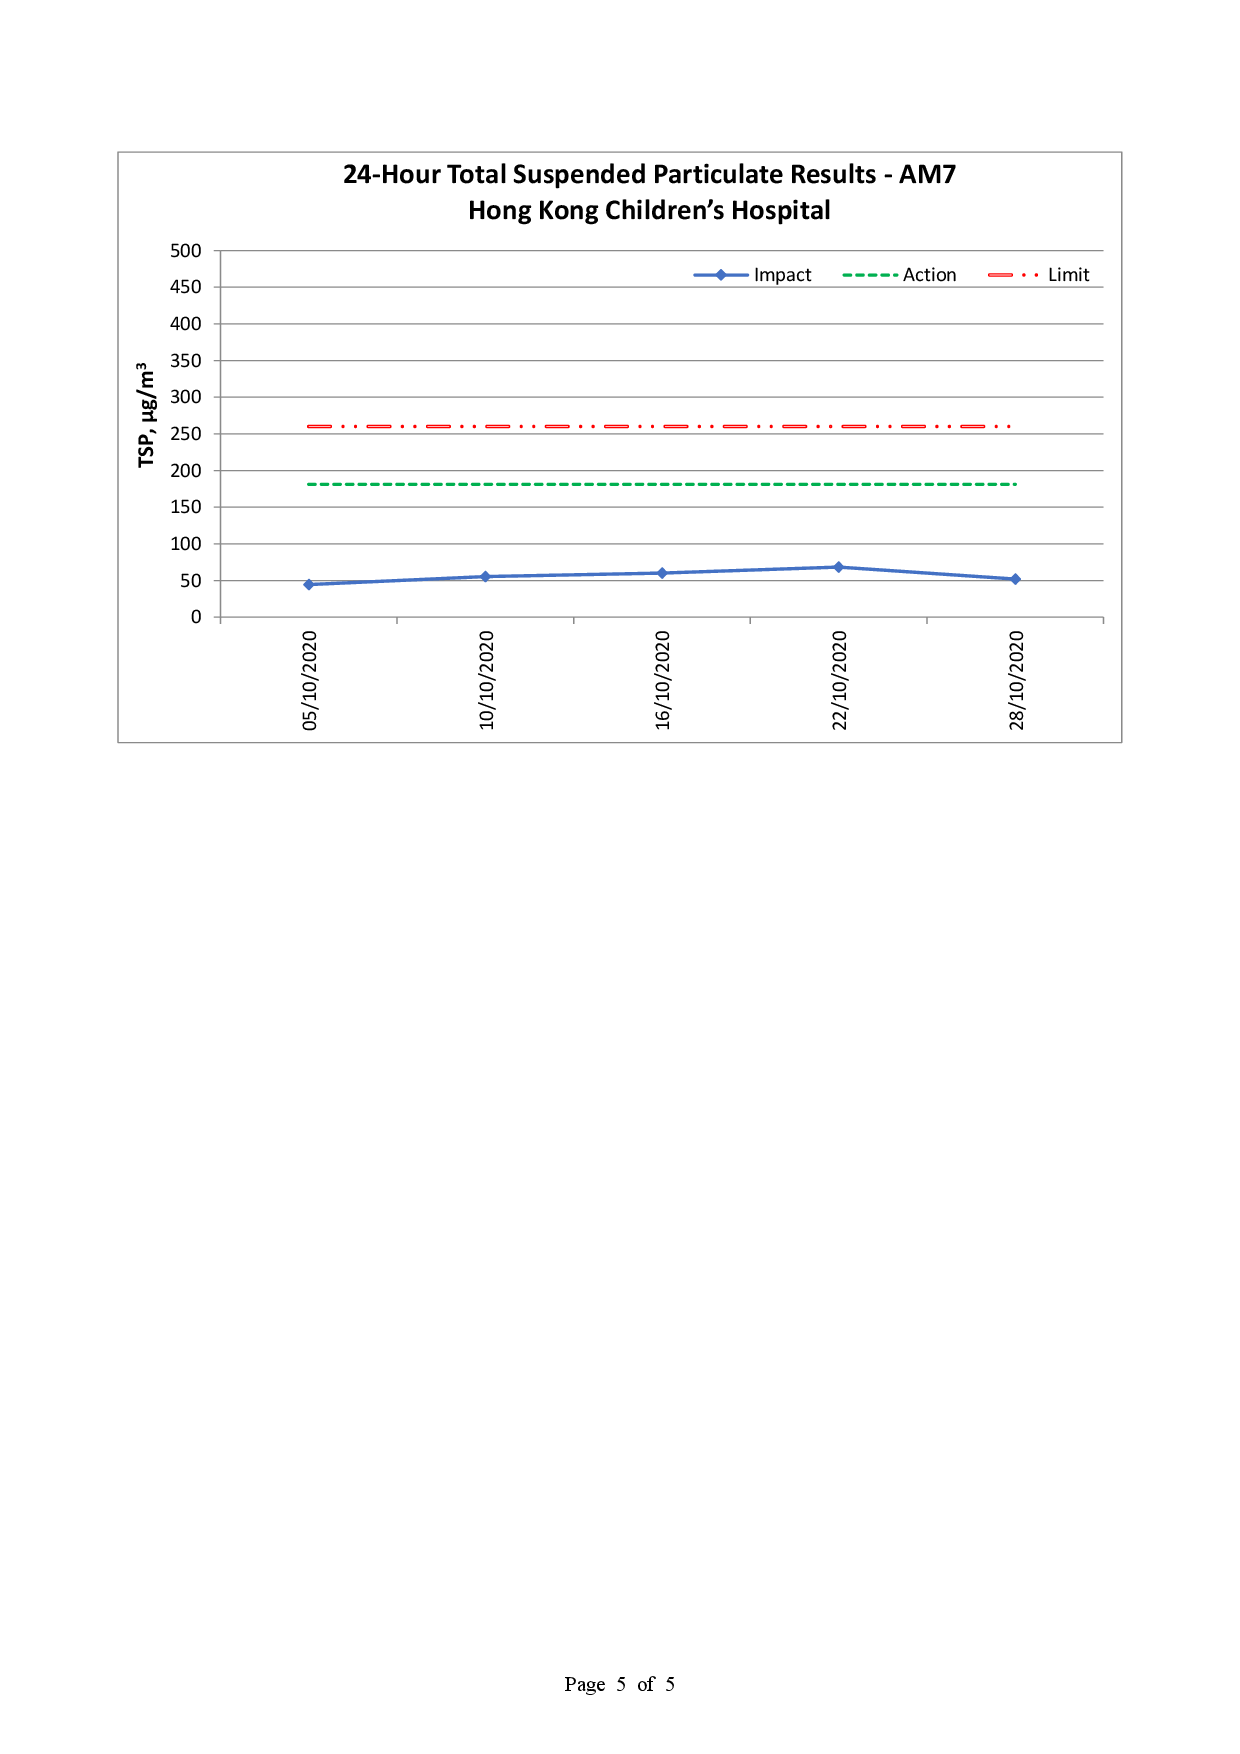
AM7 |
56 |
44 – 68 |
181 |
260 |
|
Air Monitoring Station |
Average TSP Concentration, mg/m3 |
Range, mg/m3 |
Action Level, mg/m3 |
Limit Level, mg/m3 |
|
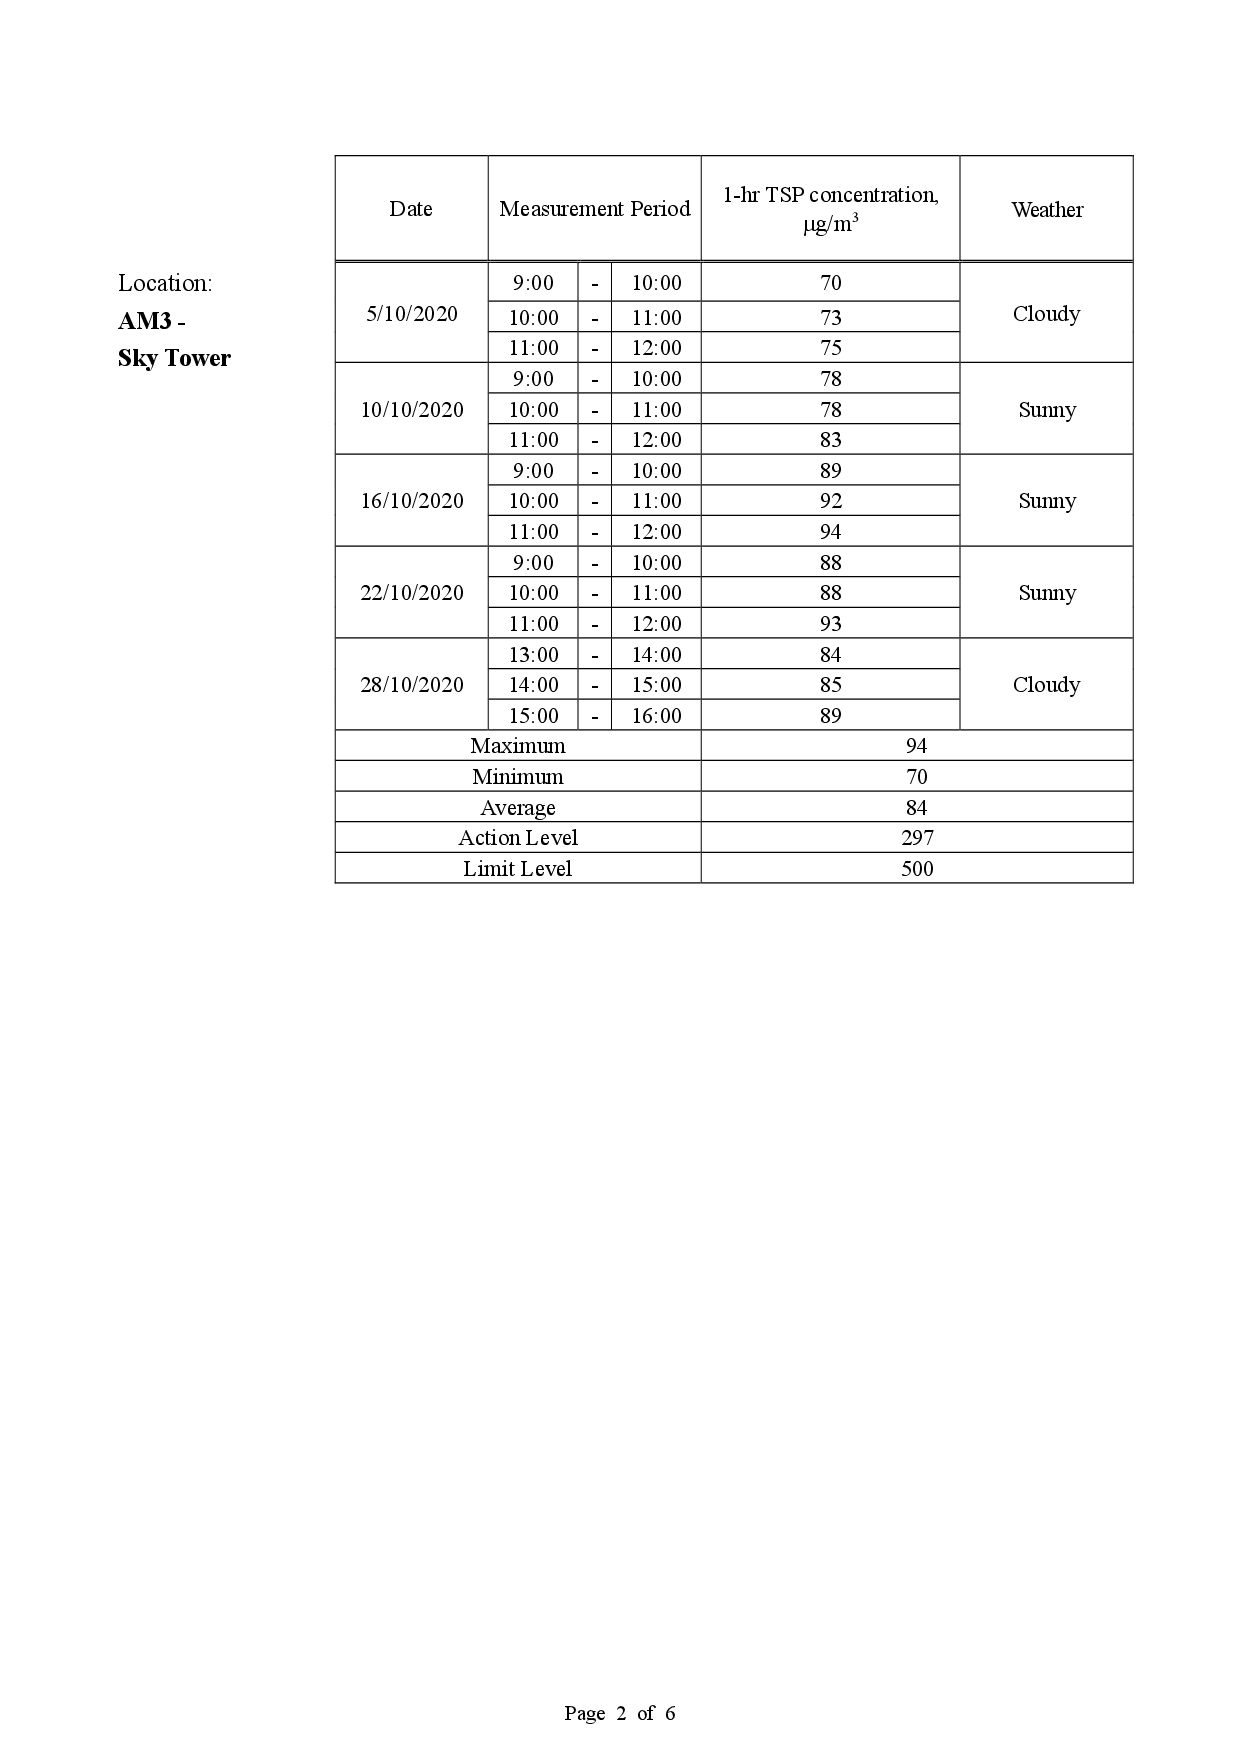
AM3 |
84 |
70 – 94 |
297 |
500 |
|
AM4(A) |
84 |
74 – 95 |
326 |
500 |
|
AM7 |
86 |
67 – 131 |
315 |
500 |
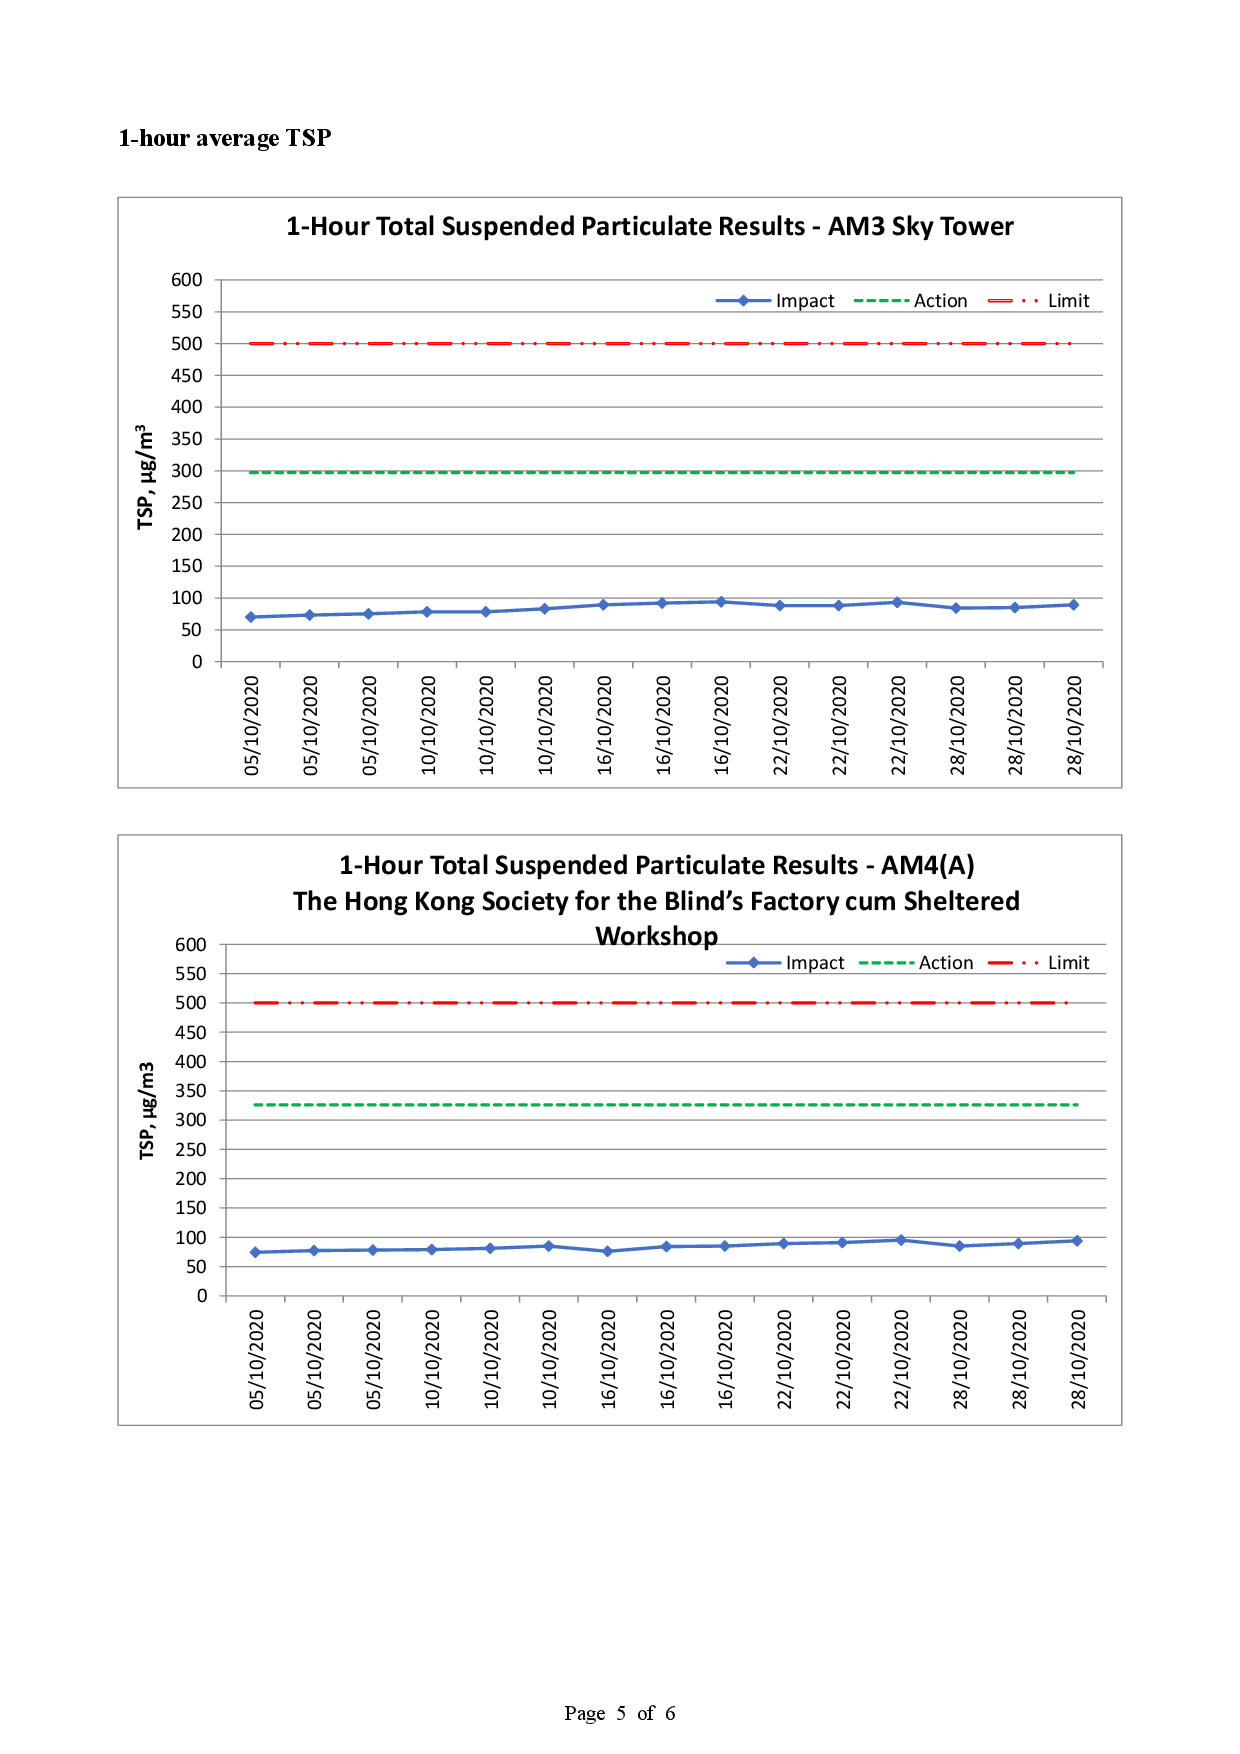
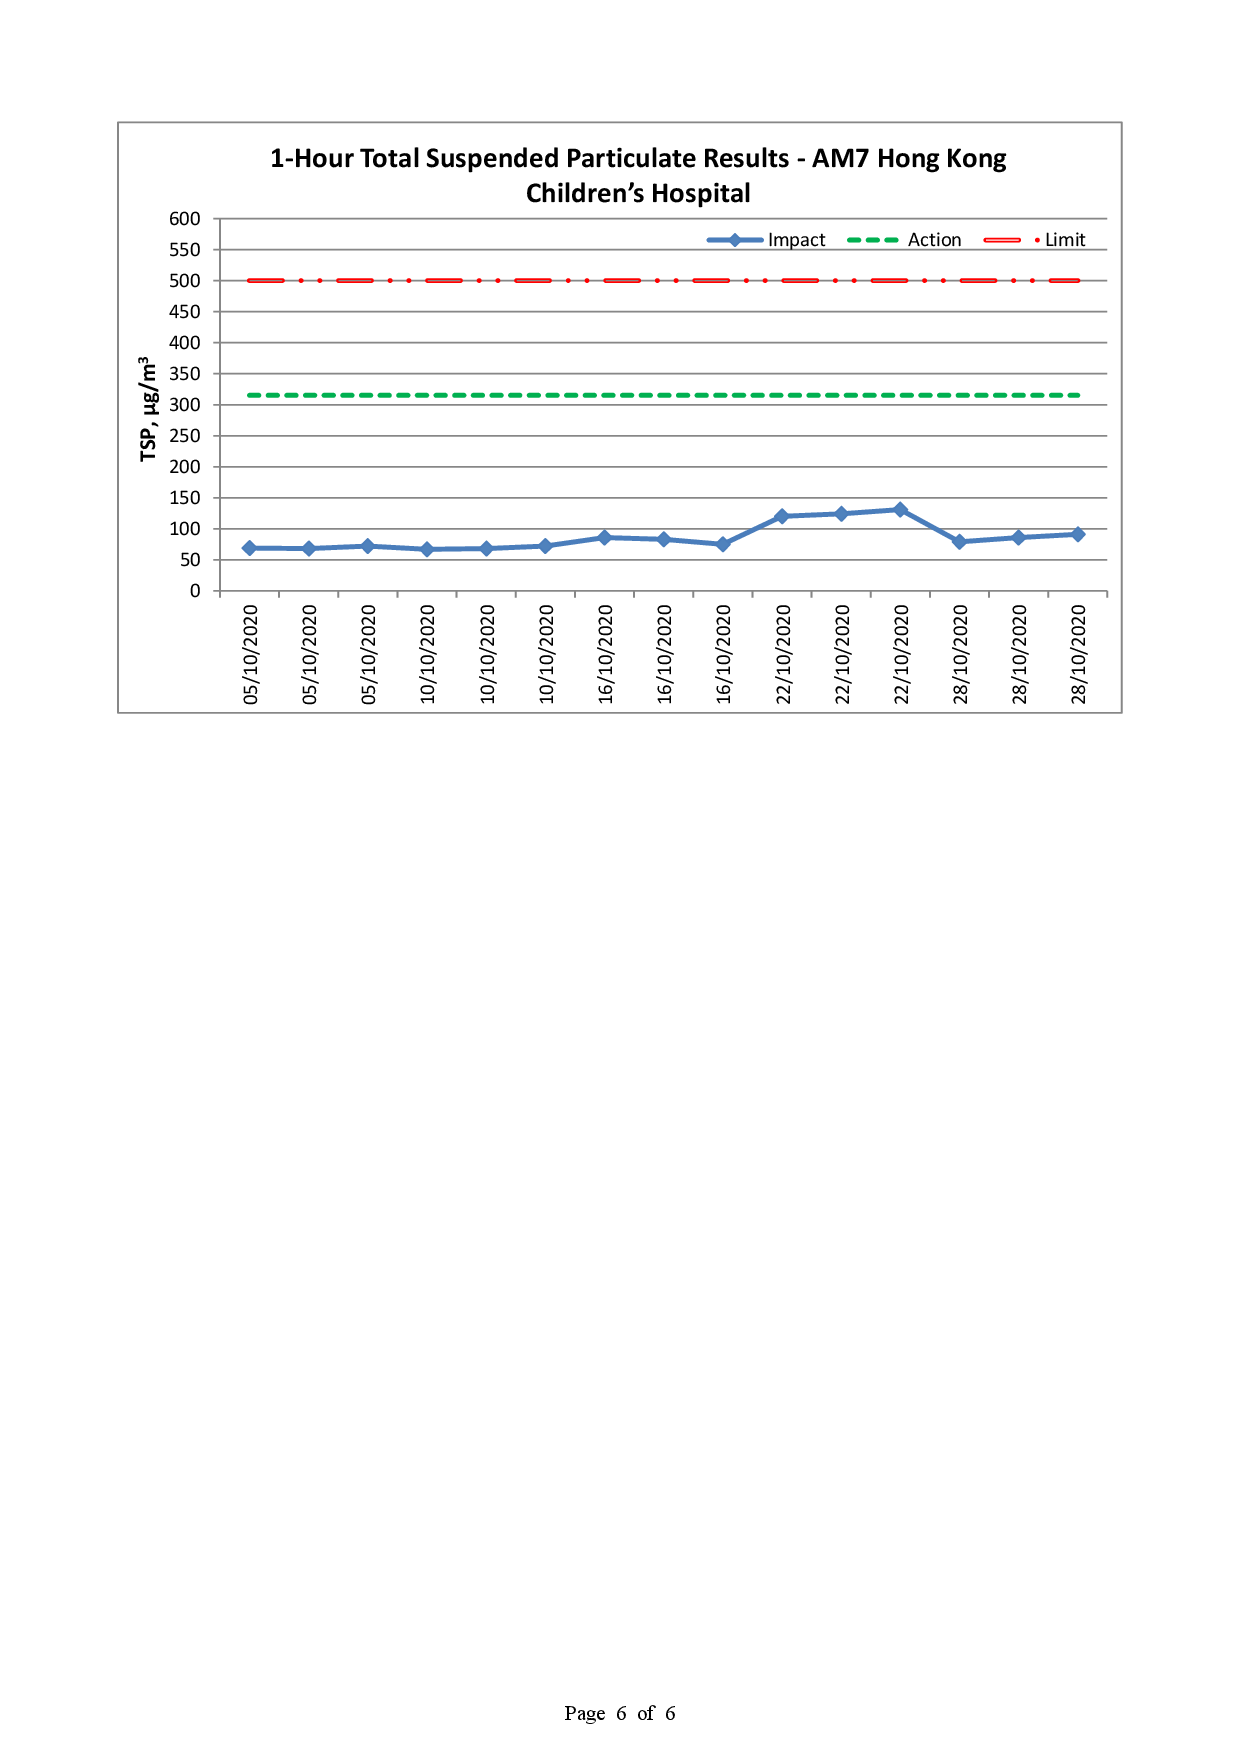
2.29 There was no Action and Limit Level exceedance of 24-hour average TSP and 1-hour average TSP levels recorded during the reporting month.
2.30 Graphical presentation and detailed monitoring results of 24-hour average TSP and 1-hour average TSP levels are shown in Appendix G and Appendix H respectively.
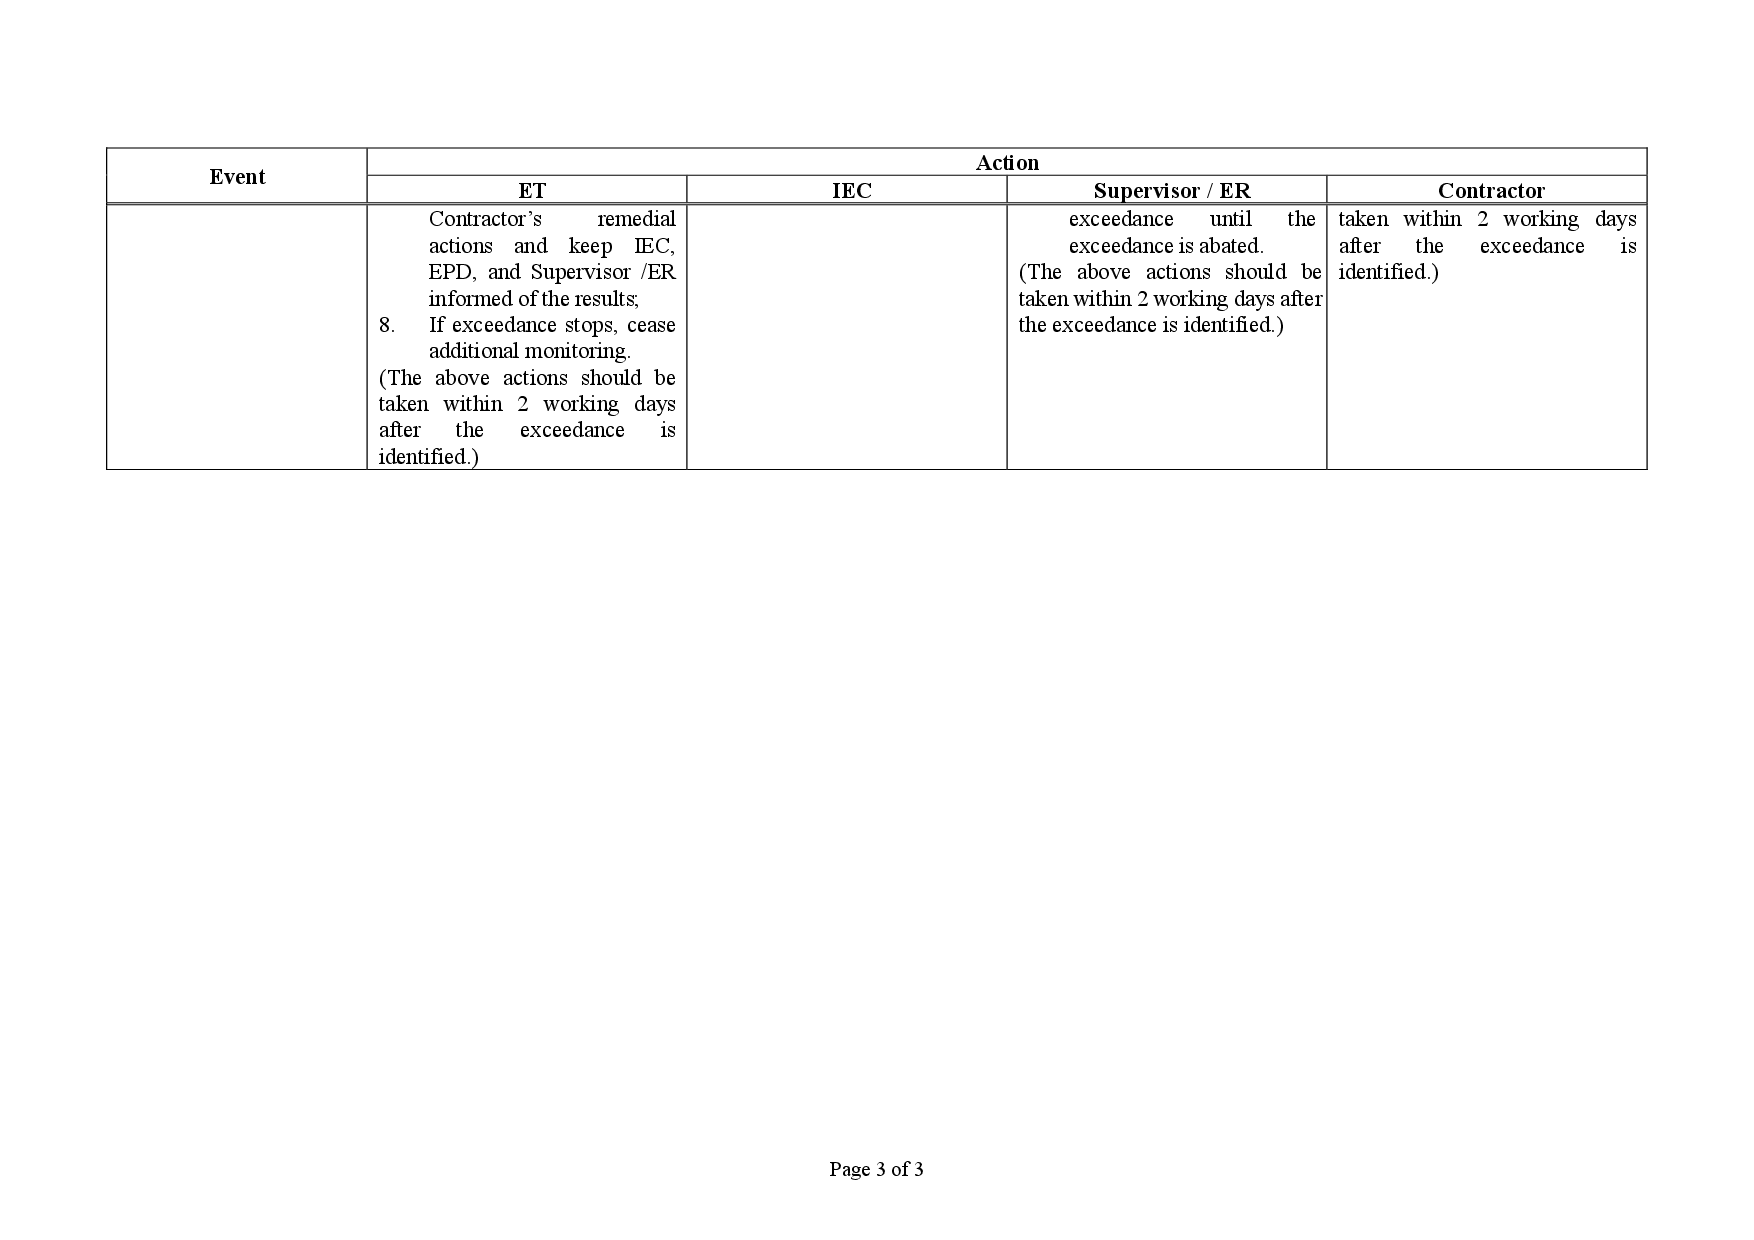
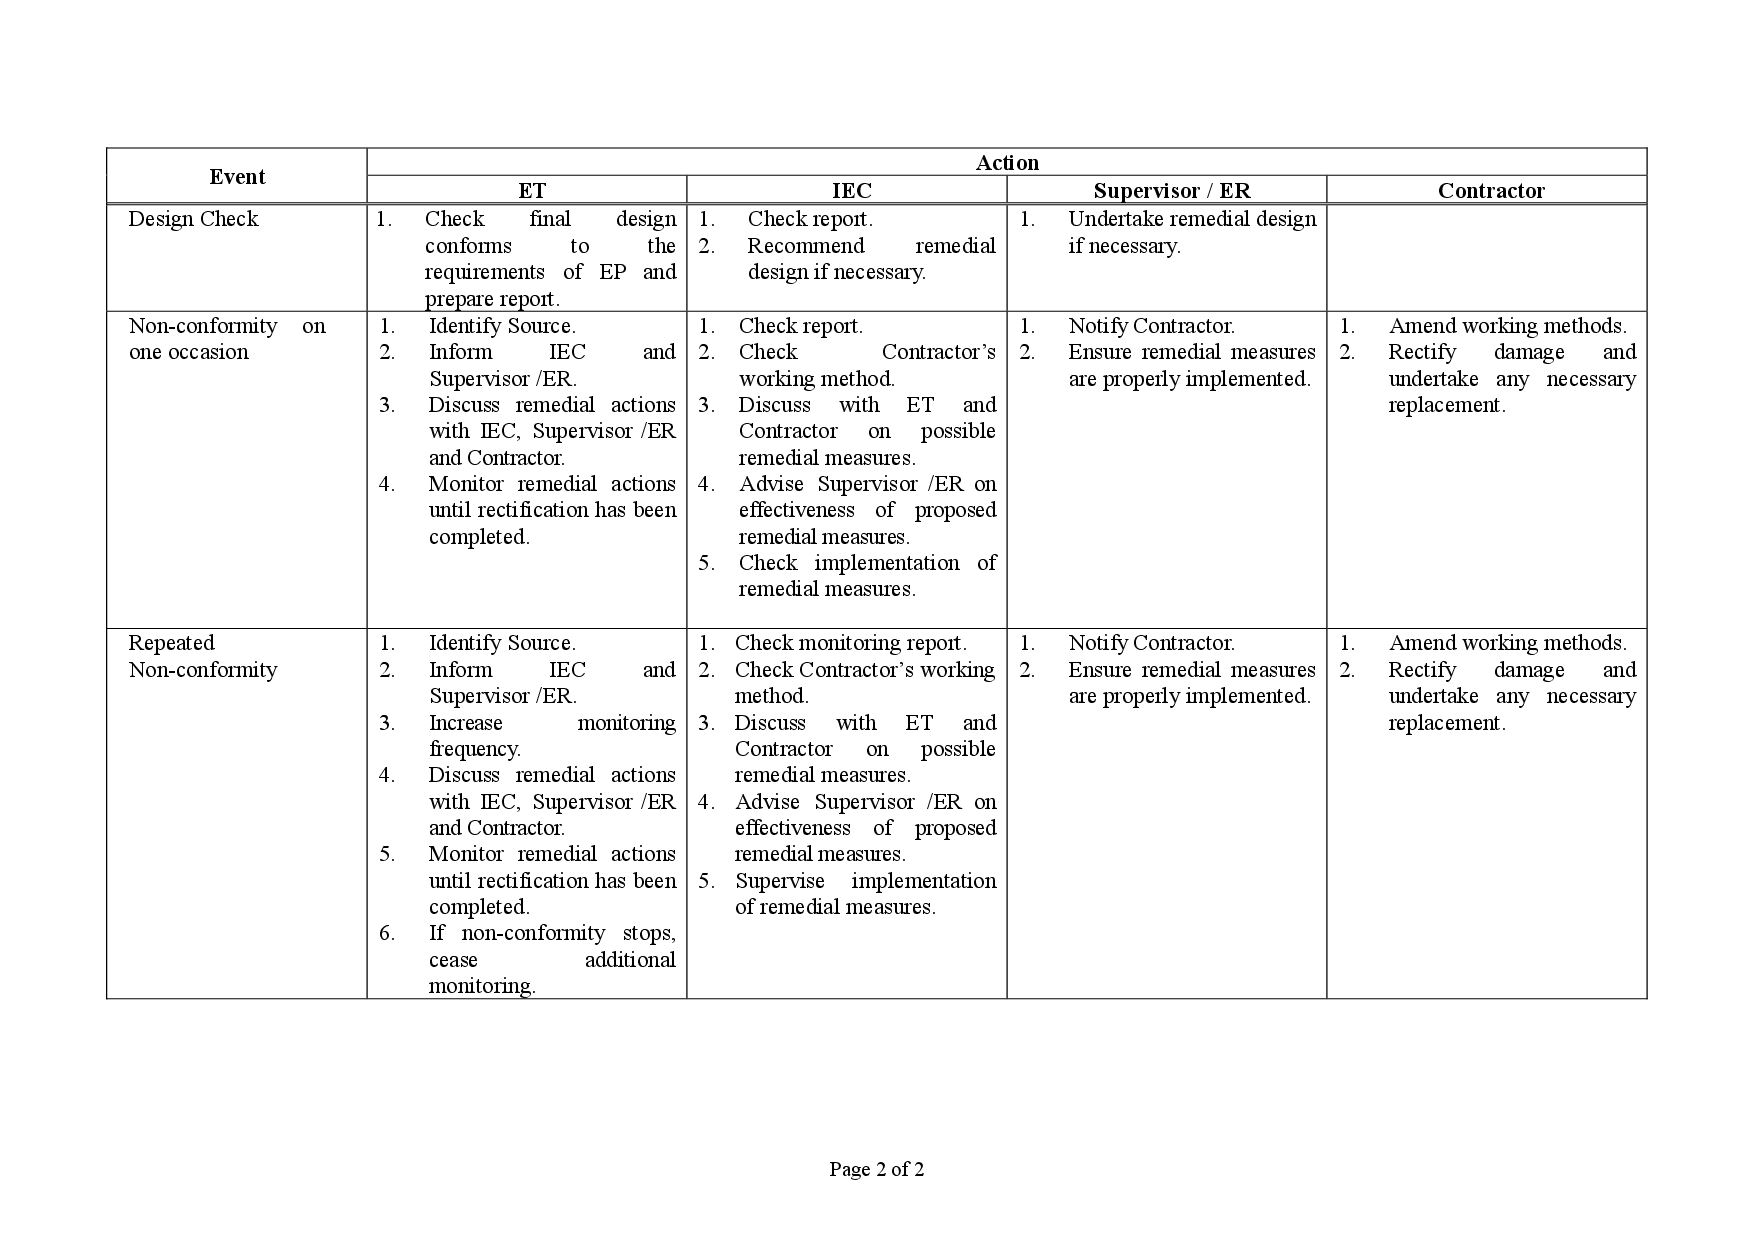
2.31 The Event and Action Plan is provided in Appendix I.
2.32 Non-project related construction activities in the adjacent construction sites were observed during the reporting period and may affect the monitoring results.
3.1 In accordance with EM&A Manuals (EIA Register Nos. AEIAR-130/2009), impact noise monitoring shall be carried out during the construction phase of the Project.
3.2 Regular monitoring, LAeq, 30-minute, for each station will be on a weekly basis and conduct one set of measurements between 0700 – 1900 on normal weekdays.
3.3 If construction works are extended to include works during 1900 – 0700 as well as public holidays and Sundays, additional weekly impact monitoring will be carried out during the respective restricted hours periods.
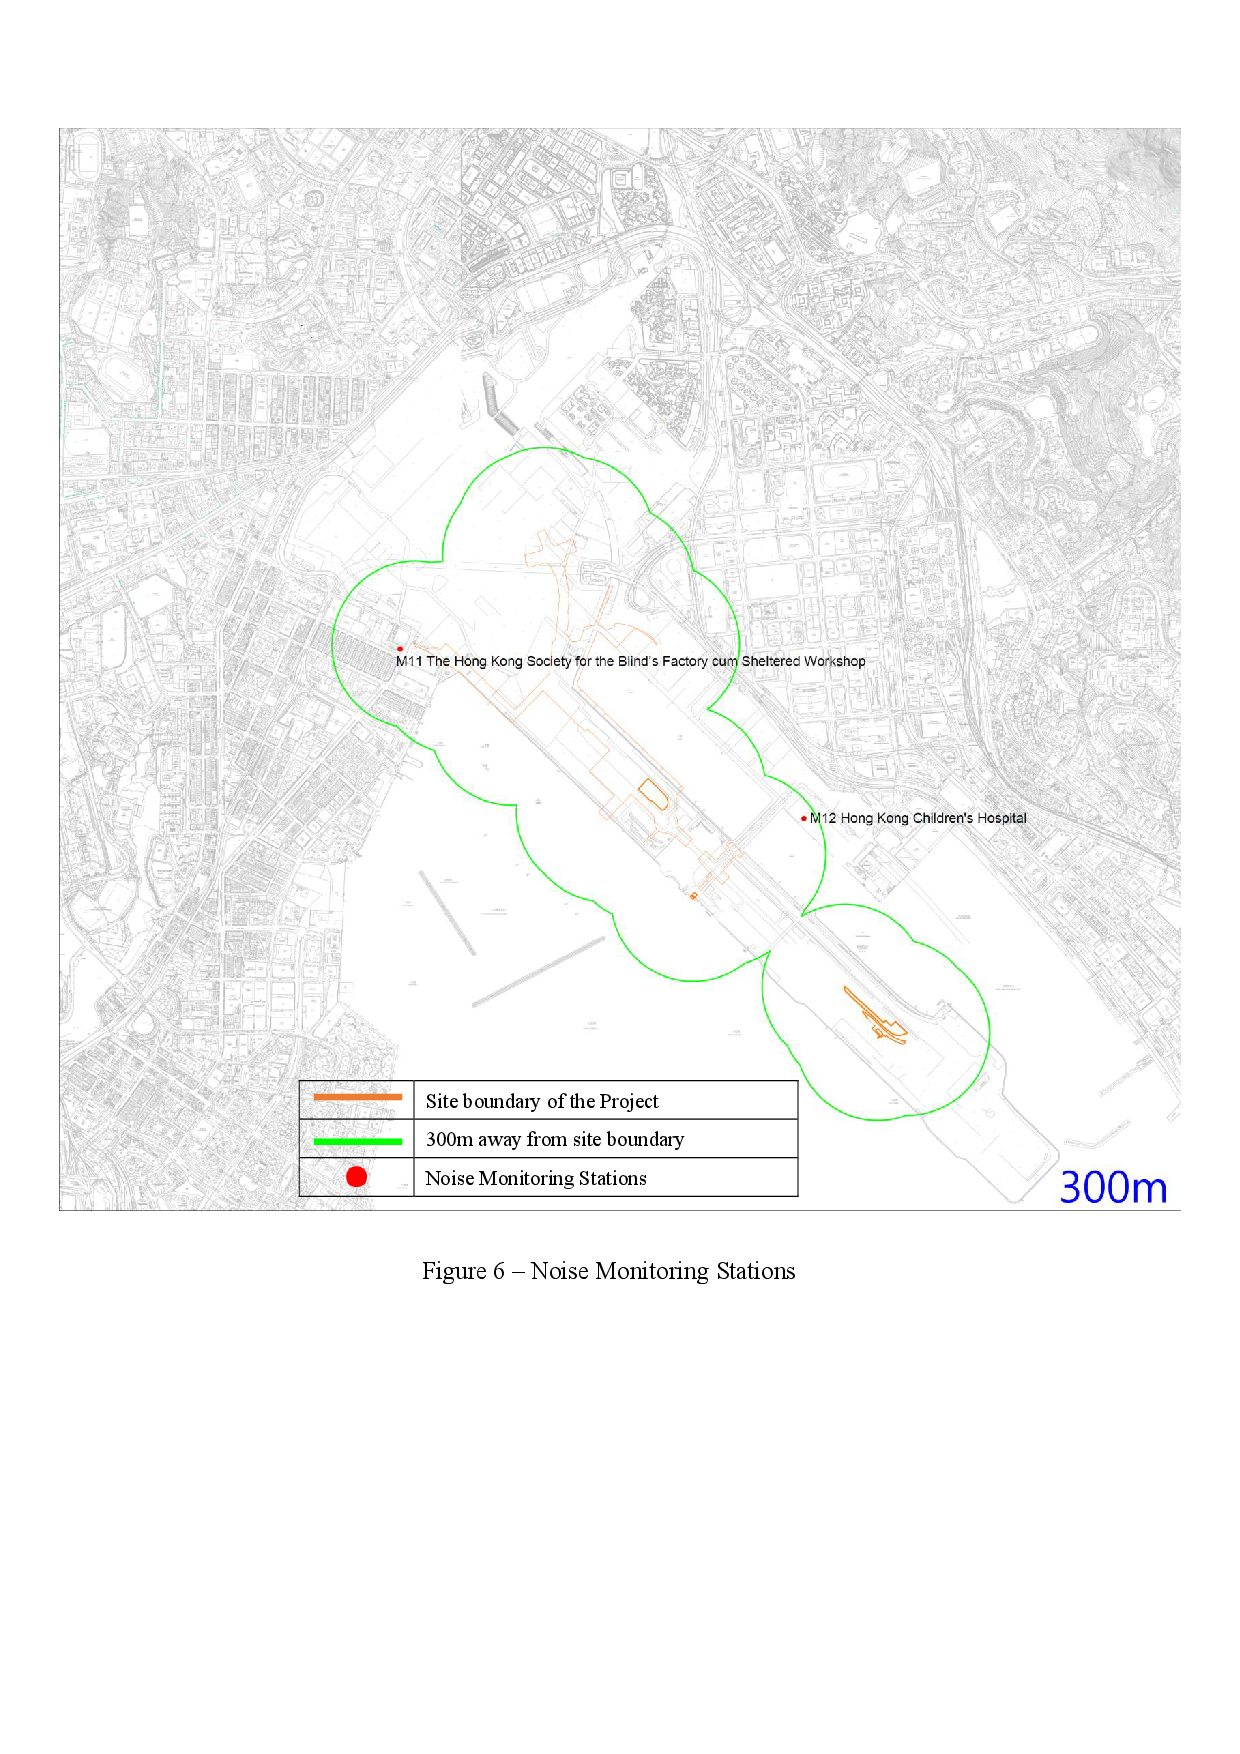
3.4 Two designated monitoring stations were selected for noise monitoring programme. Impact noise monitoring was conducted at two noise monitoring stations in the reporting month. Table 3.1 describes the noise monitoring locations, which are also depicted in Figure 6.
|
Noise Monitoring Locations for the Project |
Location of Measurement |
|
M11 - The Hong Kong Society for the Blind’s Factory cum Sheltered Workshop |
Rooftop (Façade) |
|
M12 - Hong Kong Children’s Hospital |
Rooftop (Façade) |
3.5 The noise monitoring locations and monitoring frequency are listed in Table 3.2.
|
Noise Monitoring Station |
Location for Measurement |
Parameter |
Frequency and Duration |
|
M11 - The Hong Kong Society for the Blind’s Factory cum Sheltered Workshop |
Rooftop (Façade) |
LAeq, LA10 and LA90 |
30 - minutes measurement at each monitoring station between 0700 – 1900 hrs on normal weekdays (Monday to Saturday) at frequency of once per week. |
|
M12 - Hong Kong Children’s Hospital |
Rooftop (Façade) |
3.6 The monitoring schedule for reporting month and next month is presented in Appendix C.
3.7 Photographic records of the monitoring setup are shown in Appendix D.
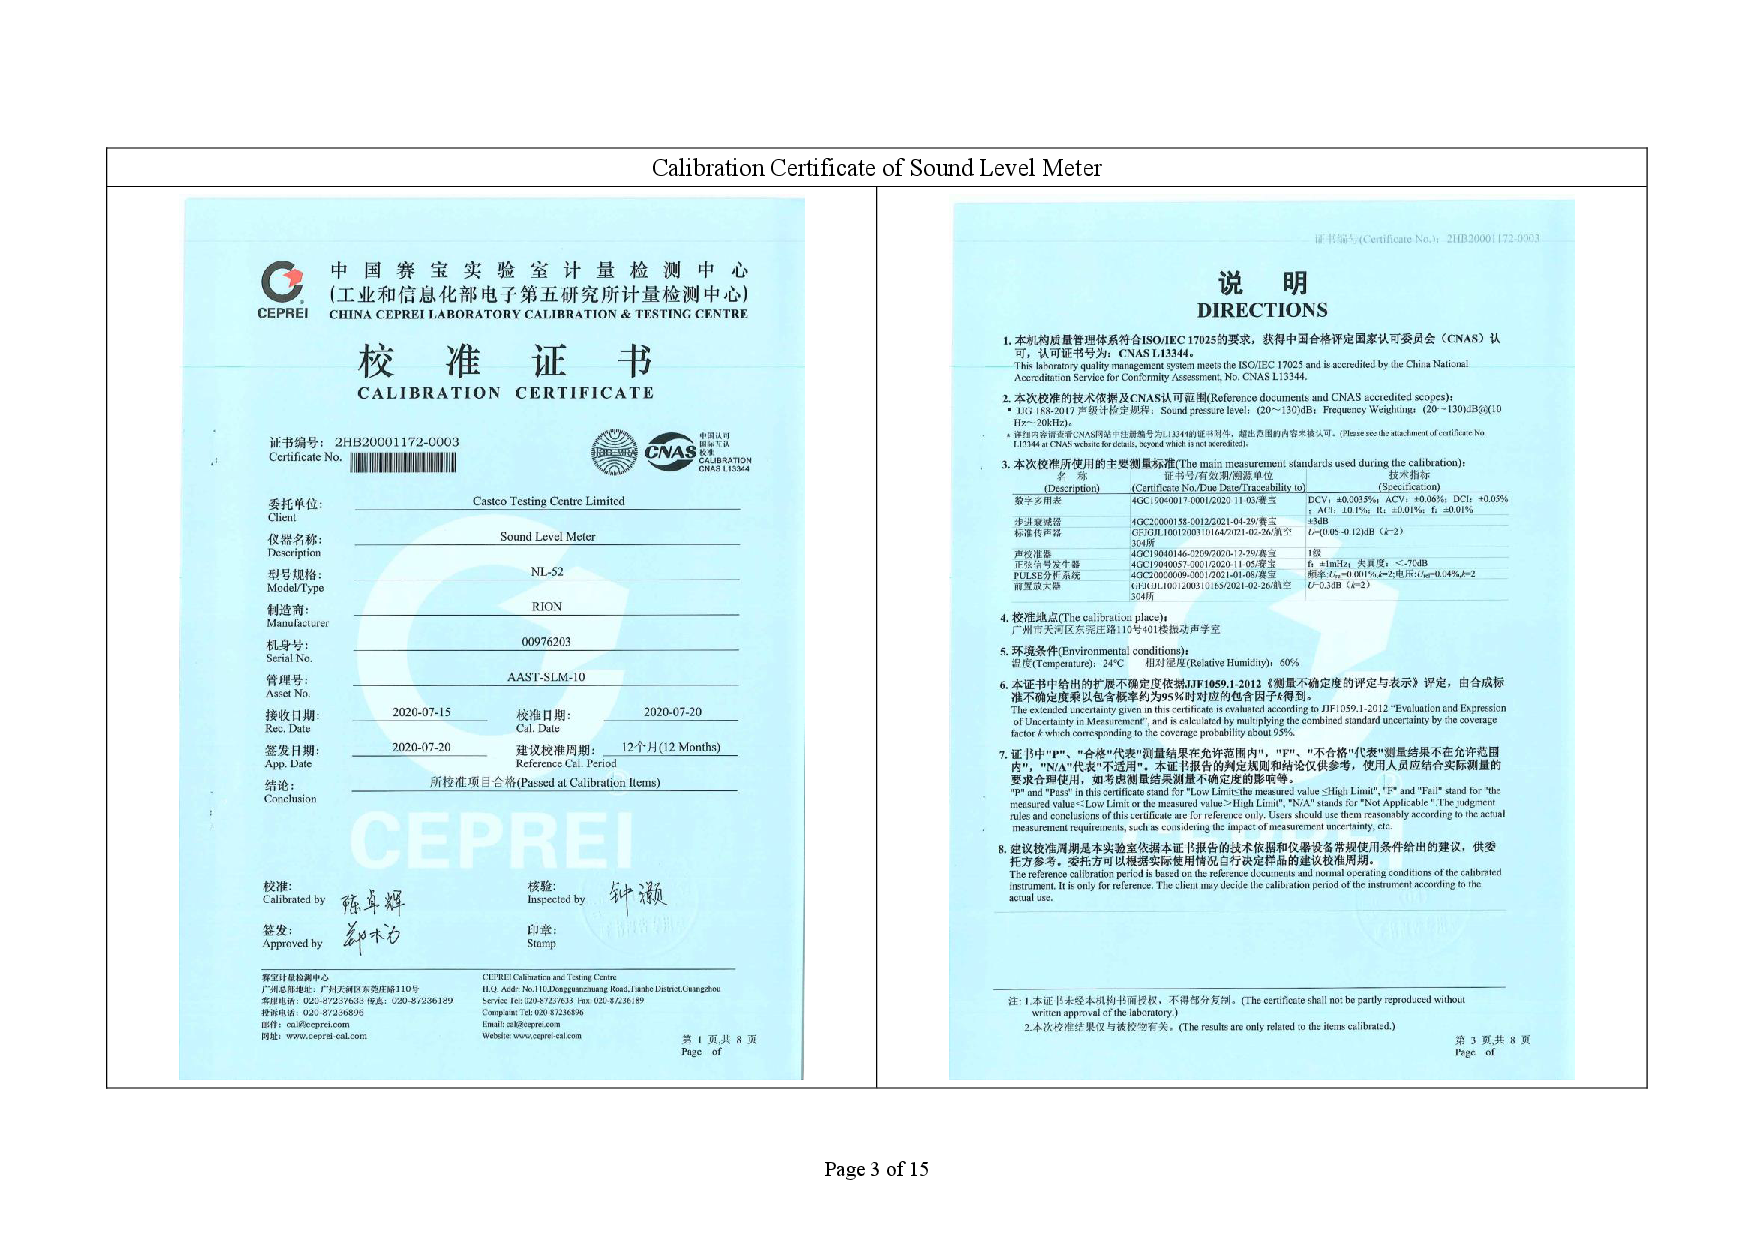
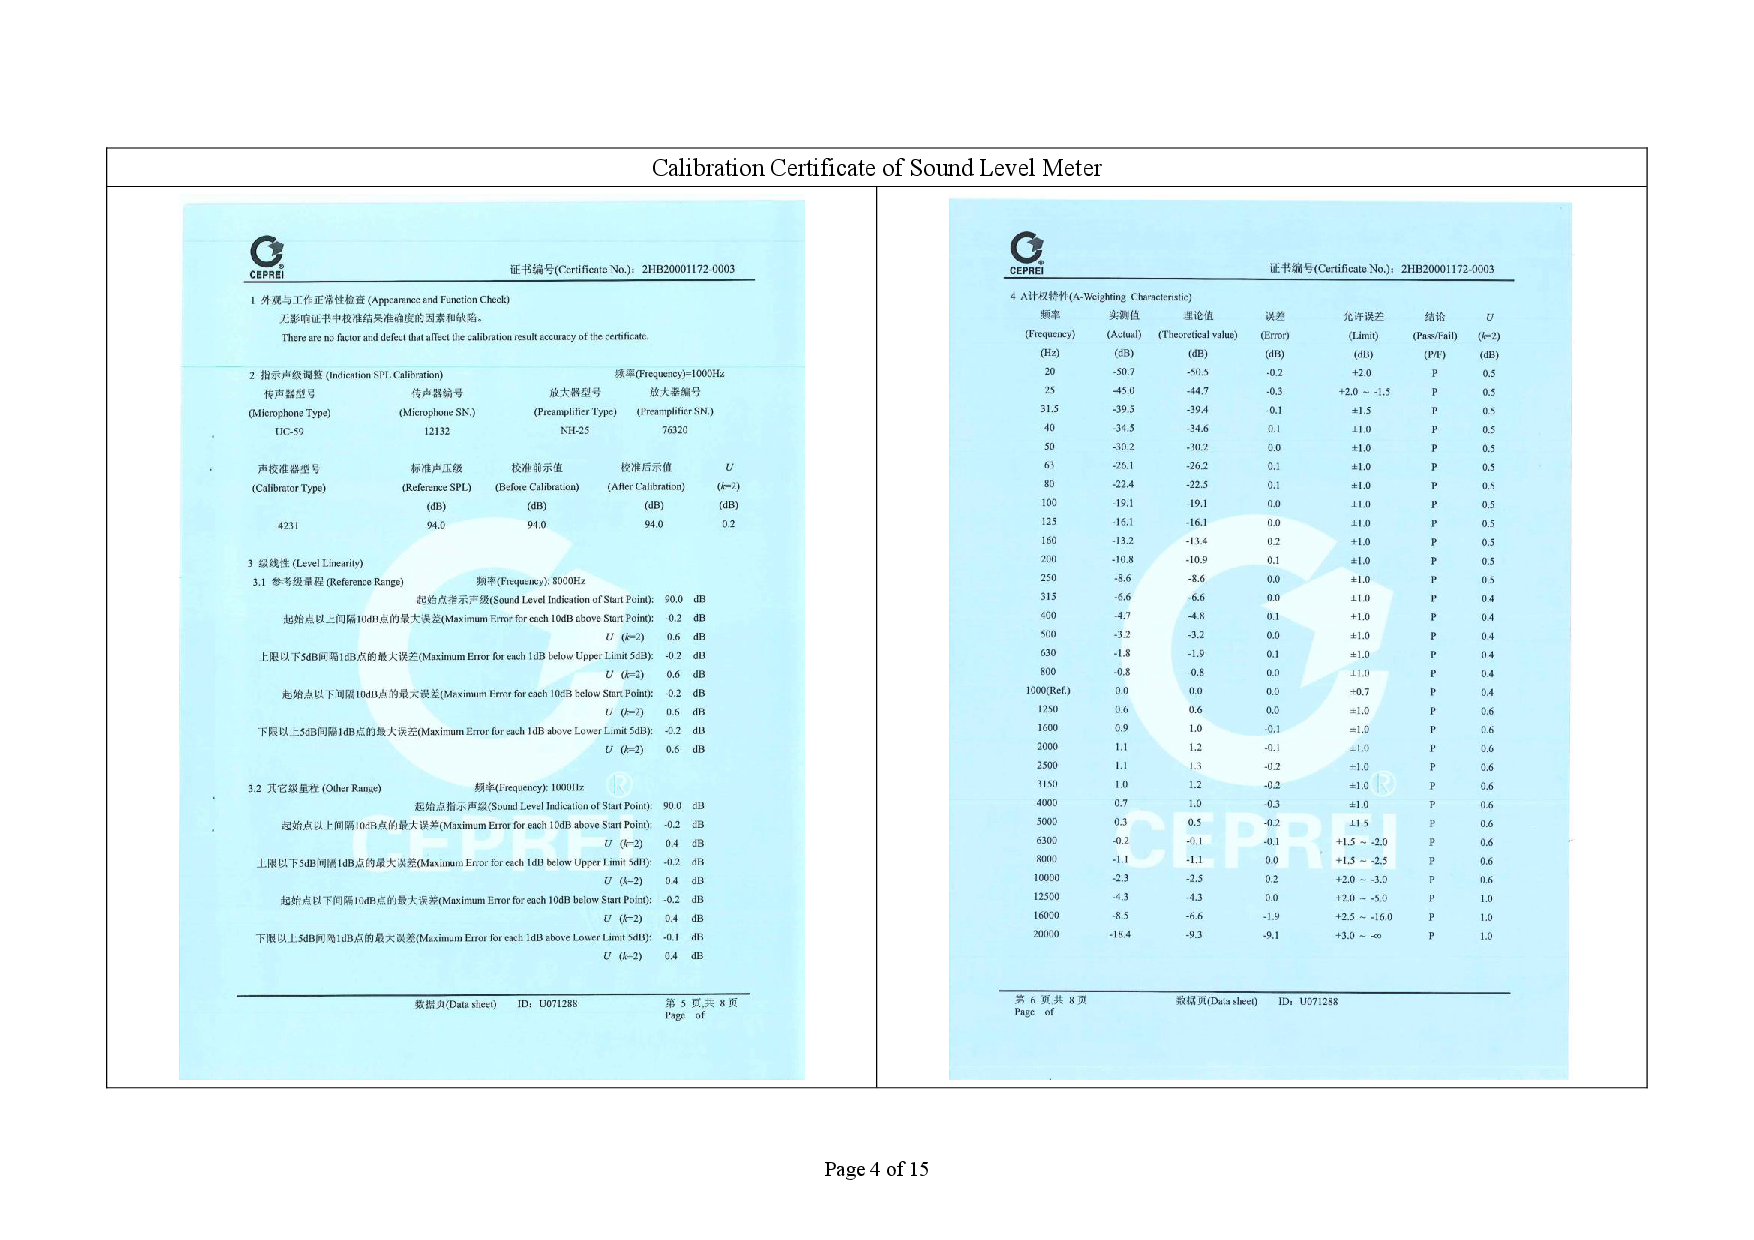
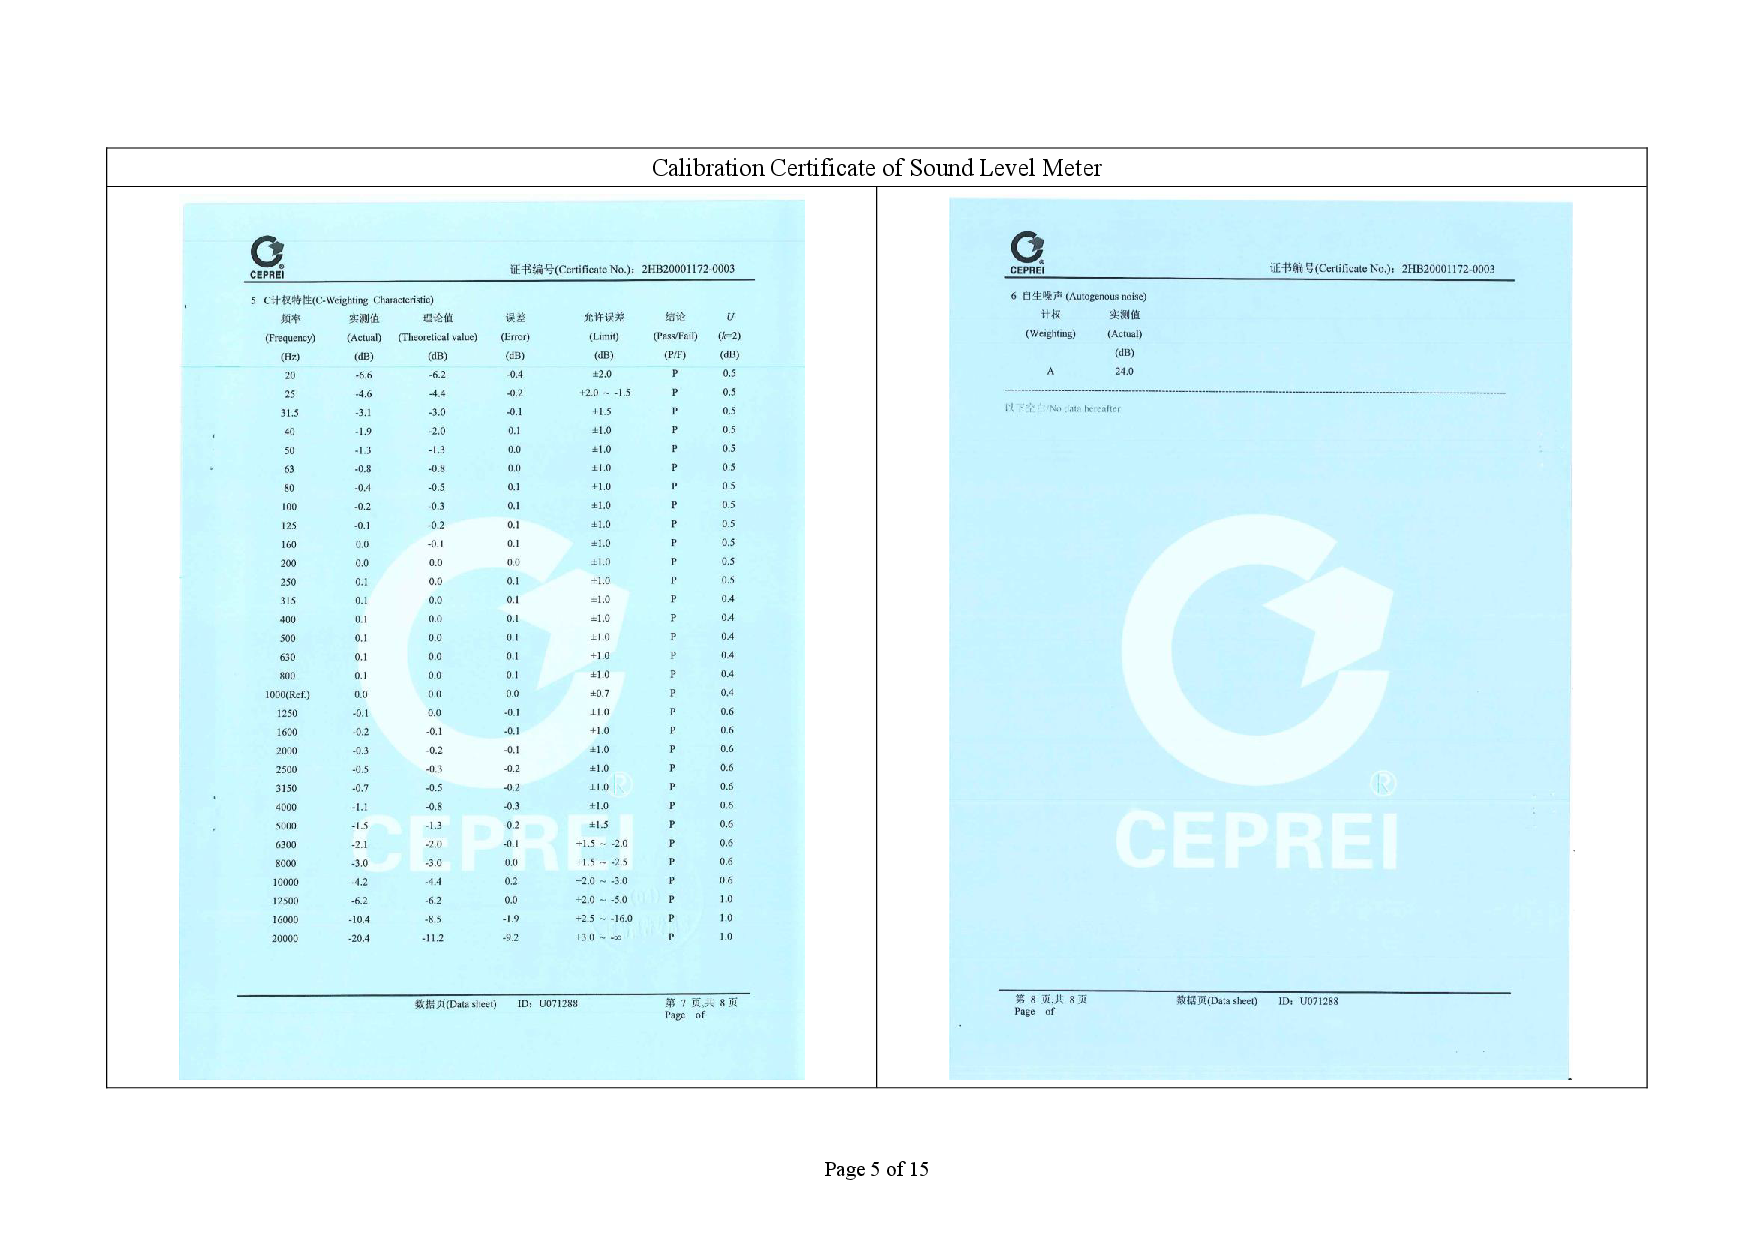
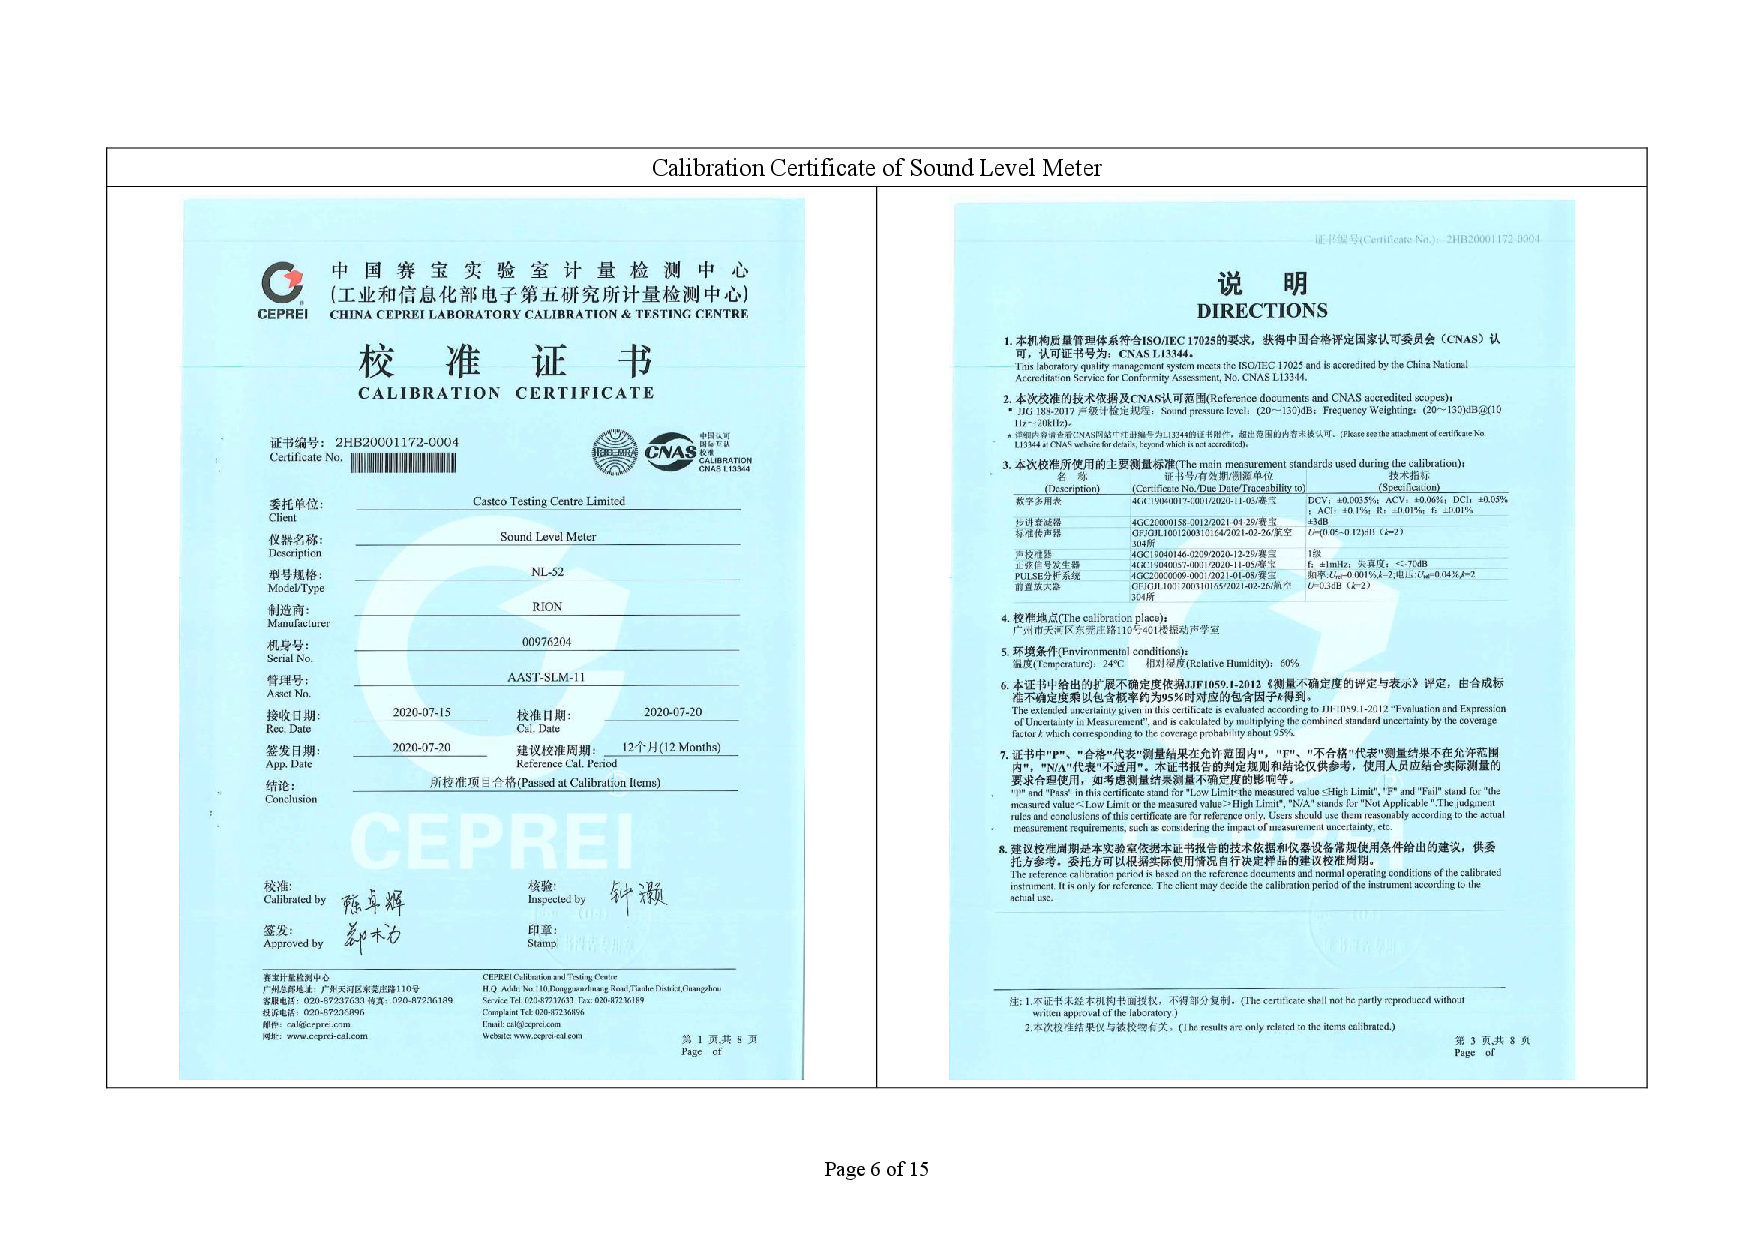
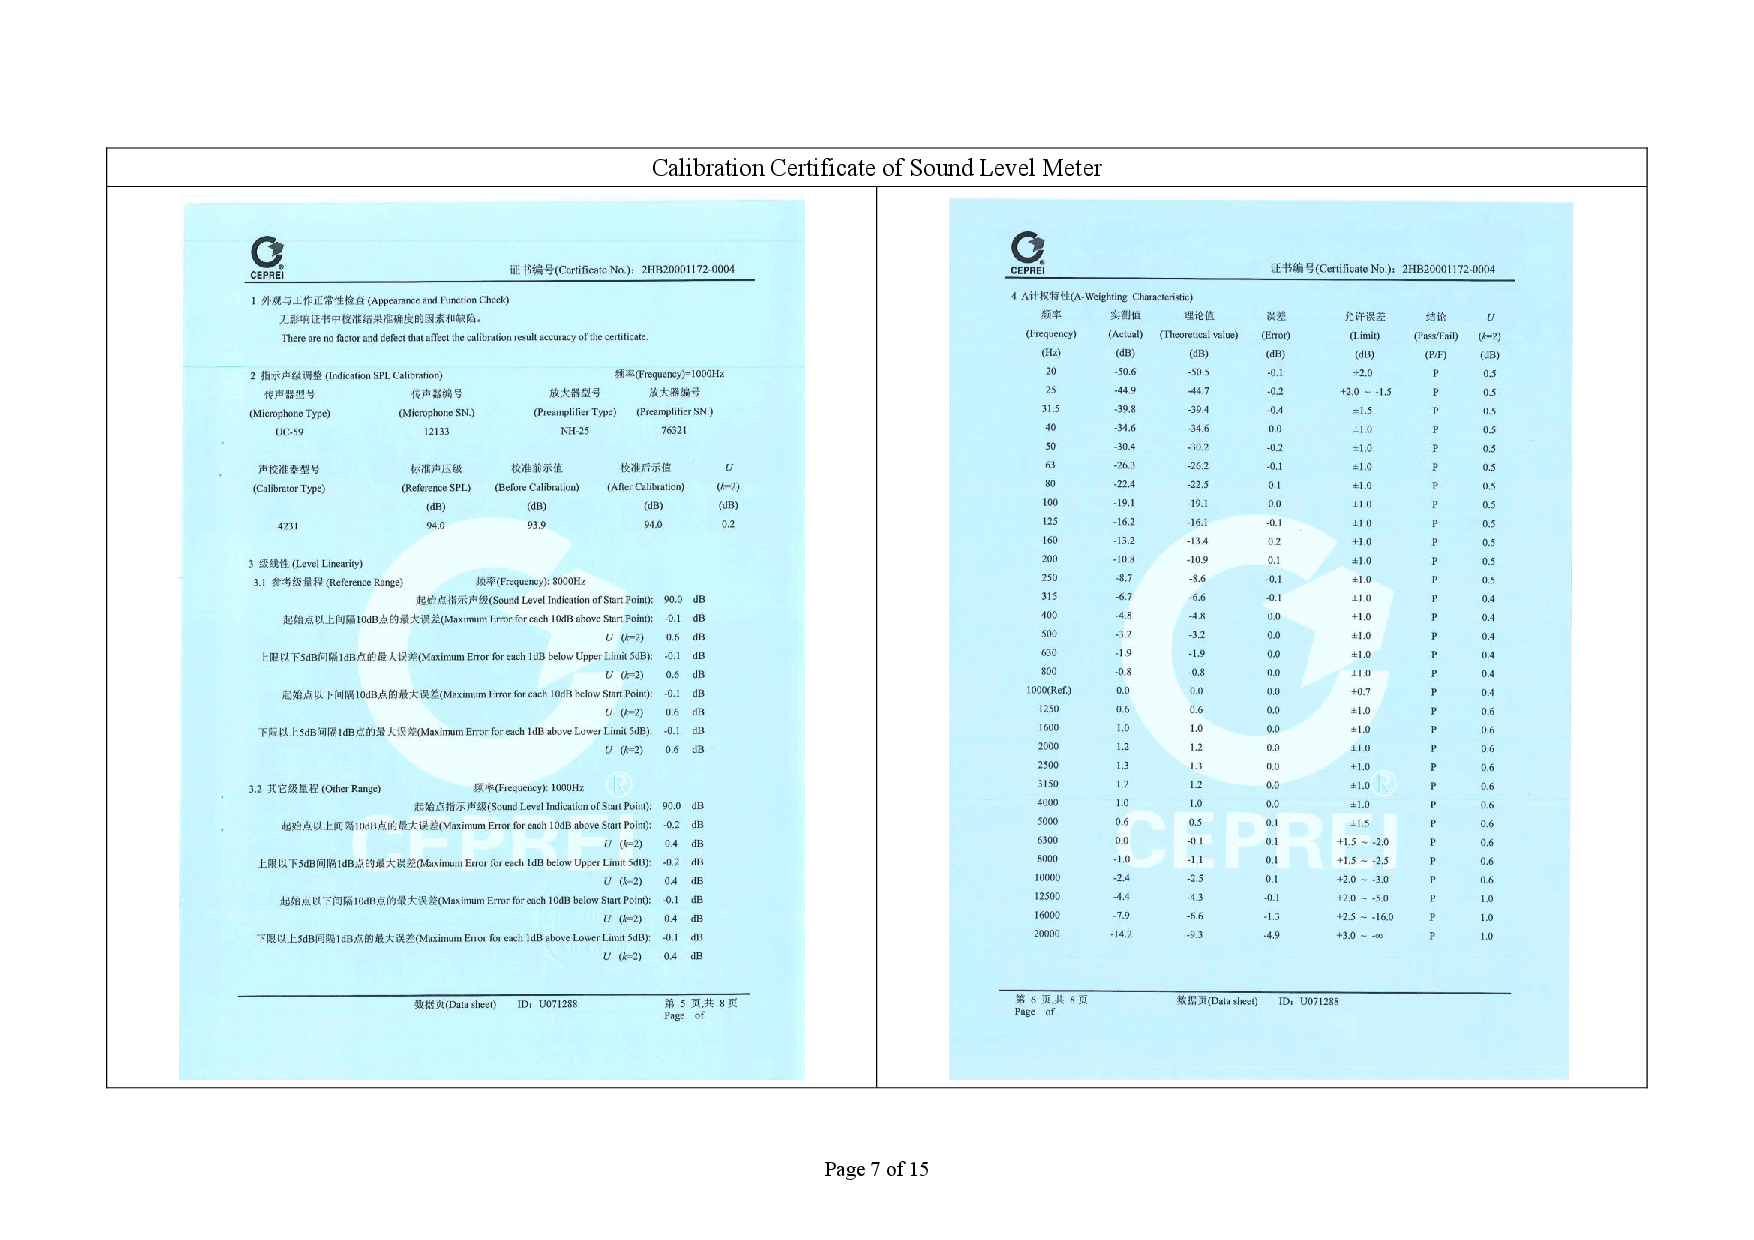
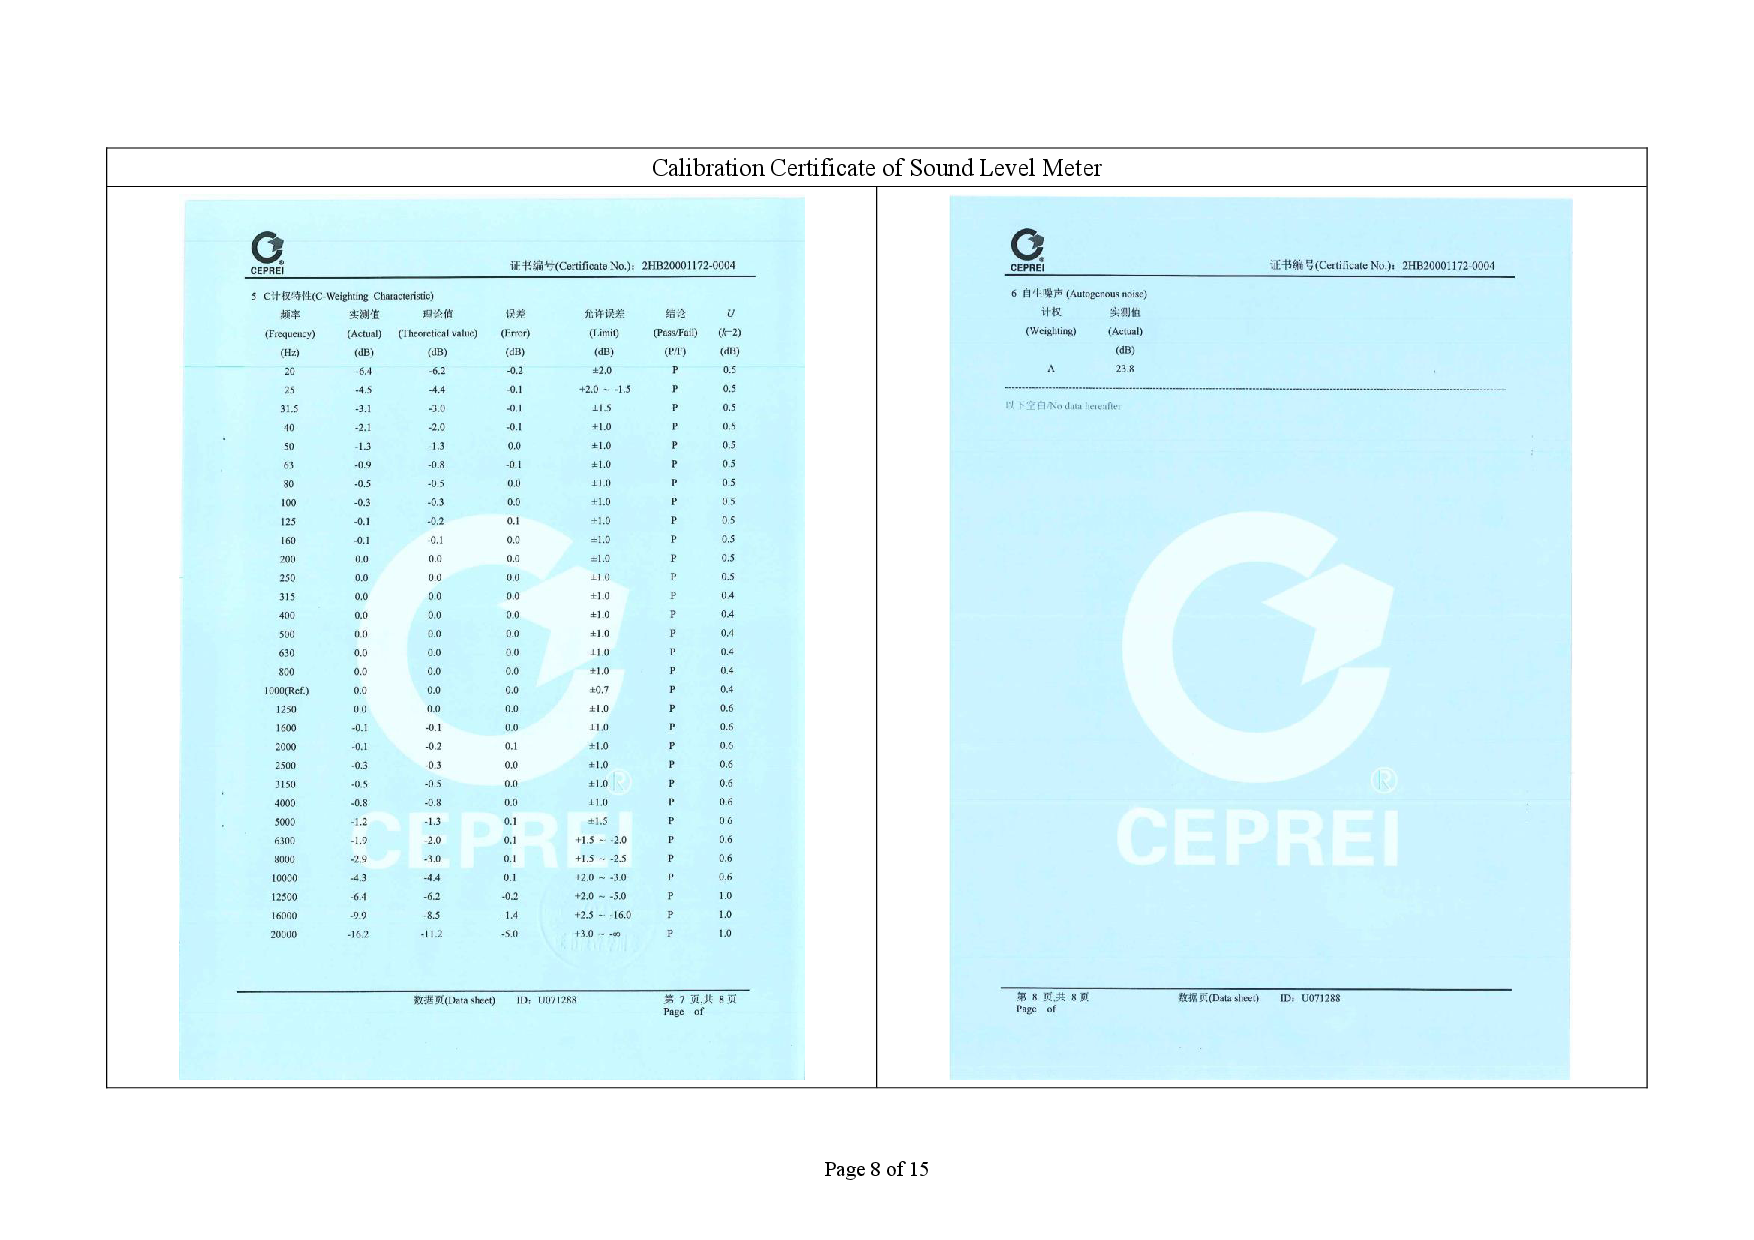
3.8 As referred to in the Technical Memorandum (TM) issued under the Noise Control Ordinance (NCO), sound level meters in compliance with the IEC 61672-1 (Type 1) standard [this standard replaced the International Electrotechnical Commission Publications 60651:1979 (Type 1) and 60804:1985 (Type 1)] were used for noise monitoring. Table 3.3 summarizes the equipment to be used in the noise monitoring.
|
Equipment |
Model |
Quantity |
|
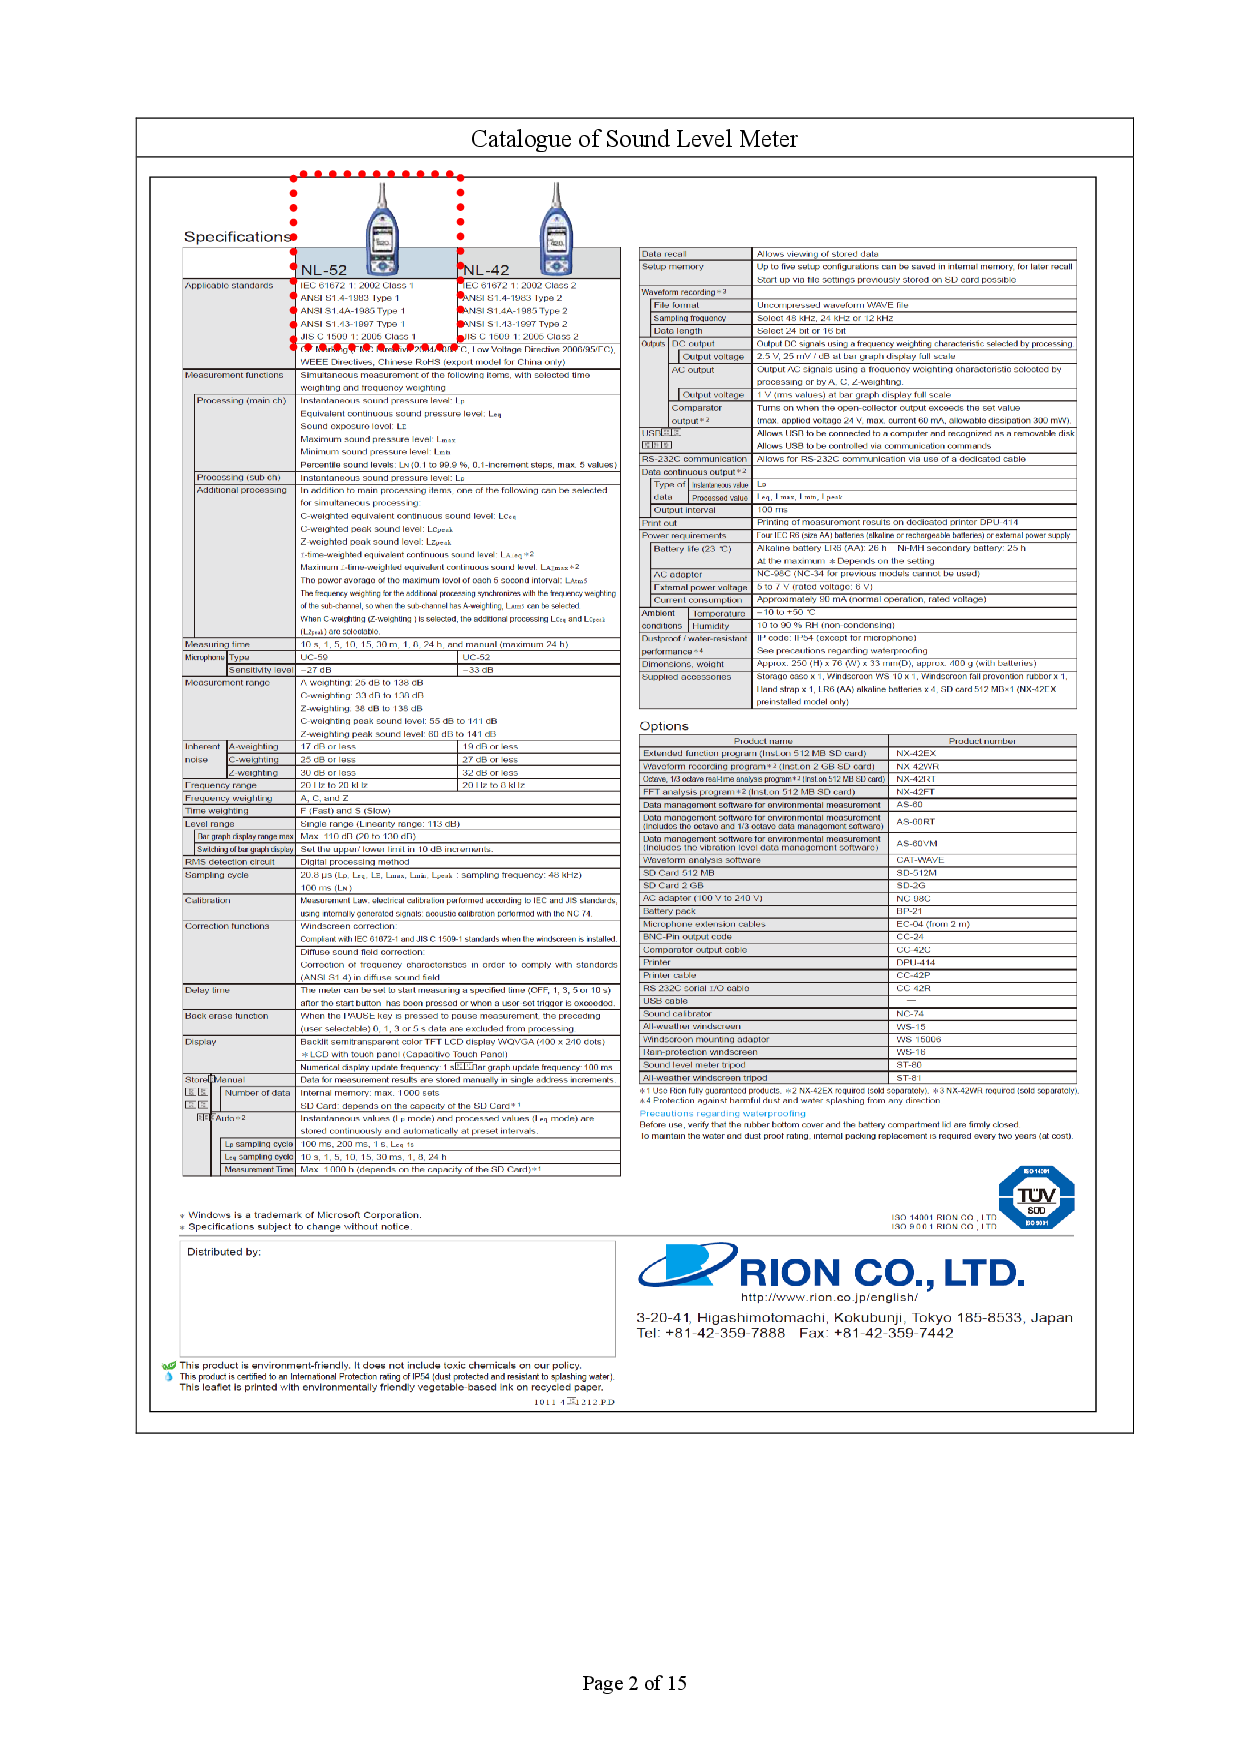
Sound Level Meter |
RION NL52 |
2 |
|
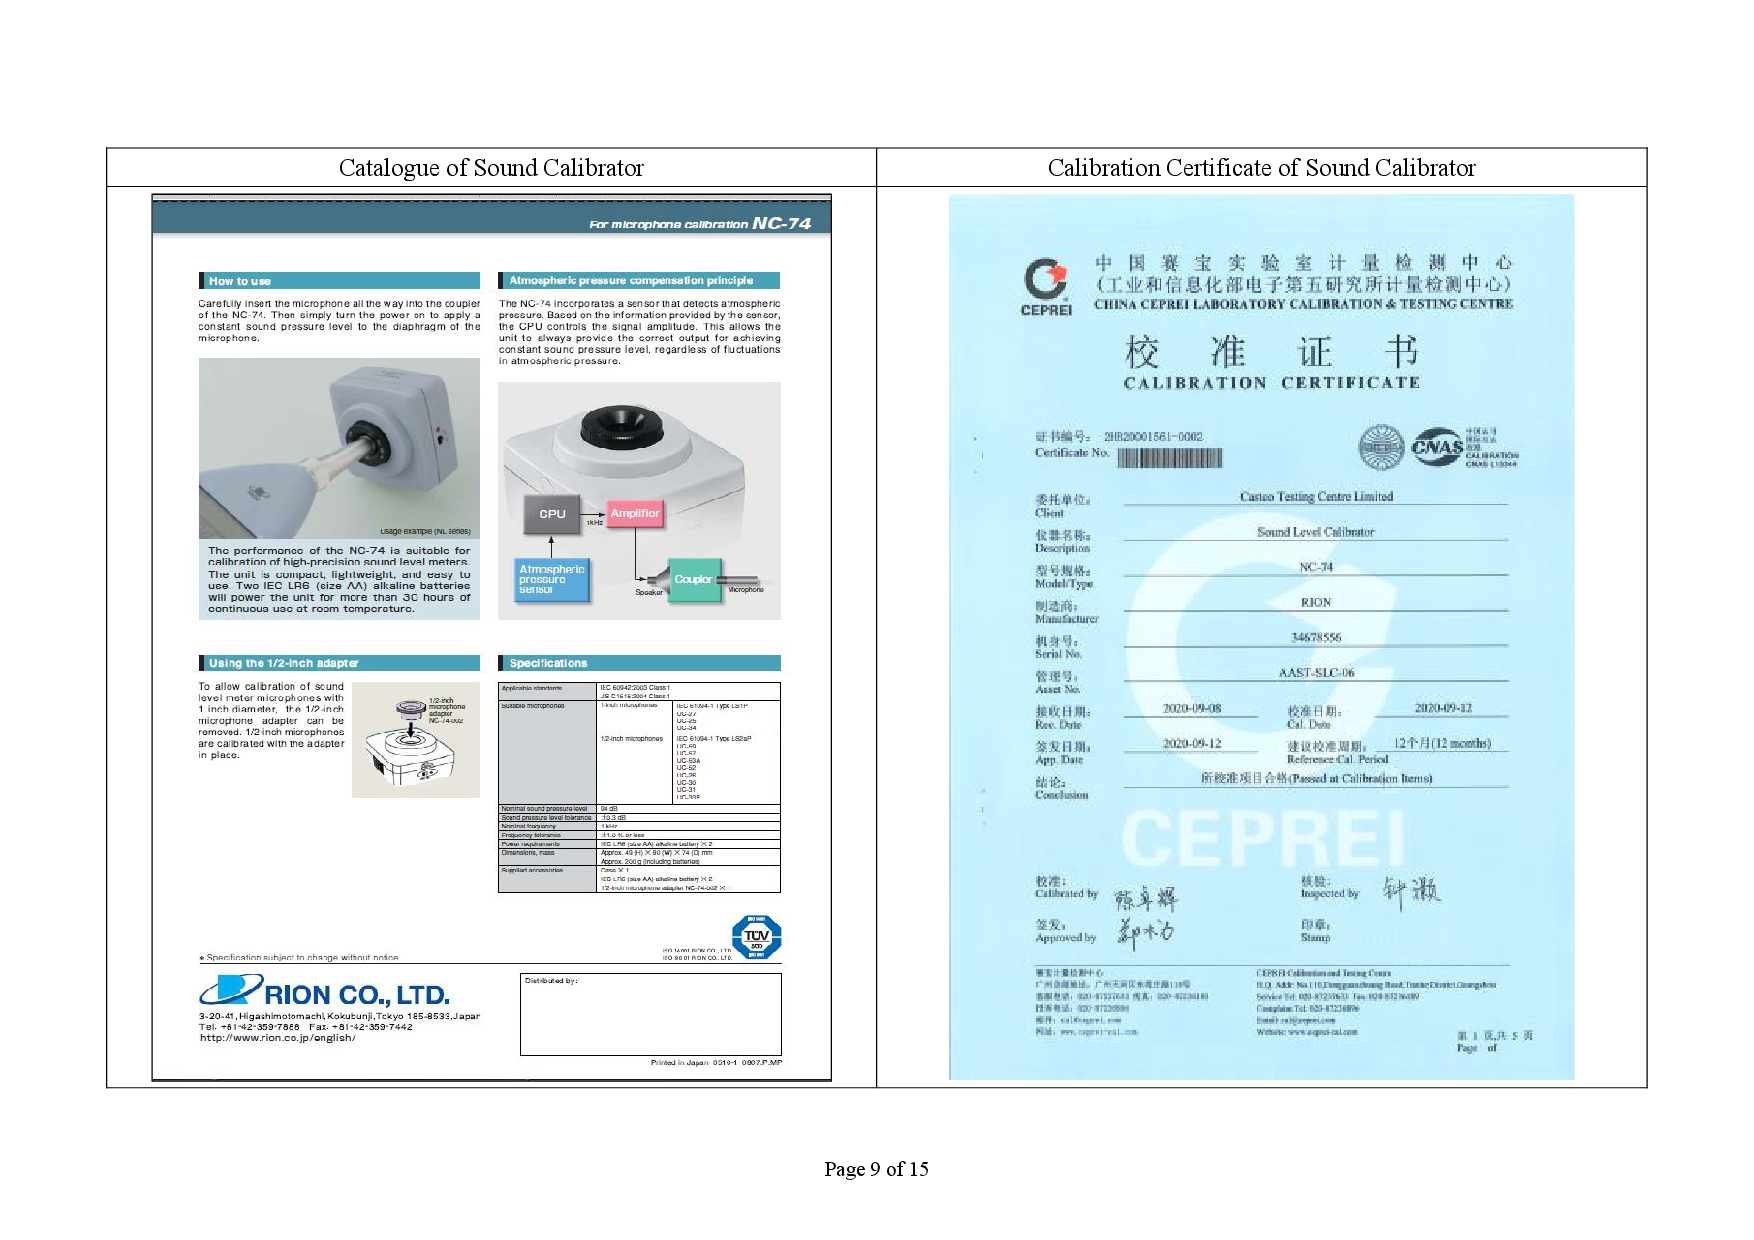
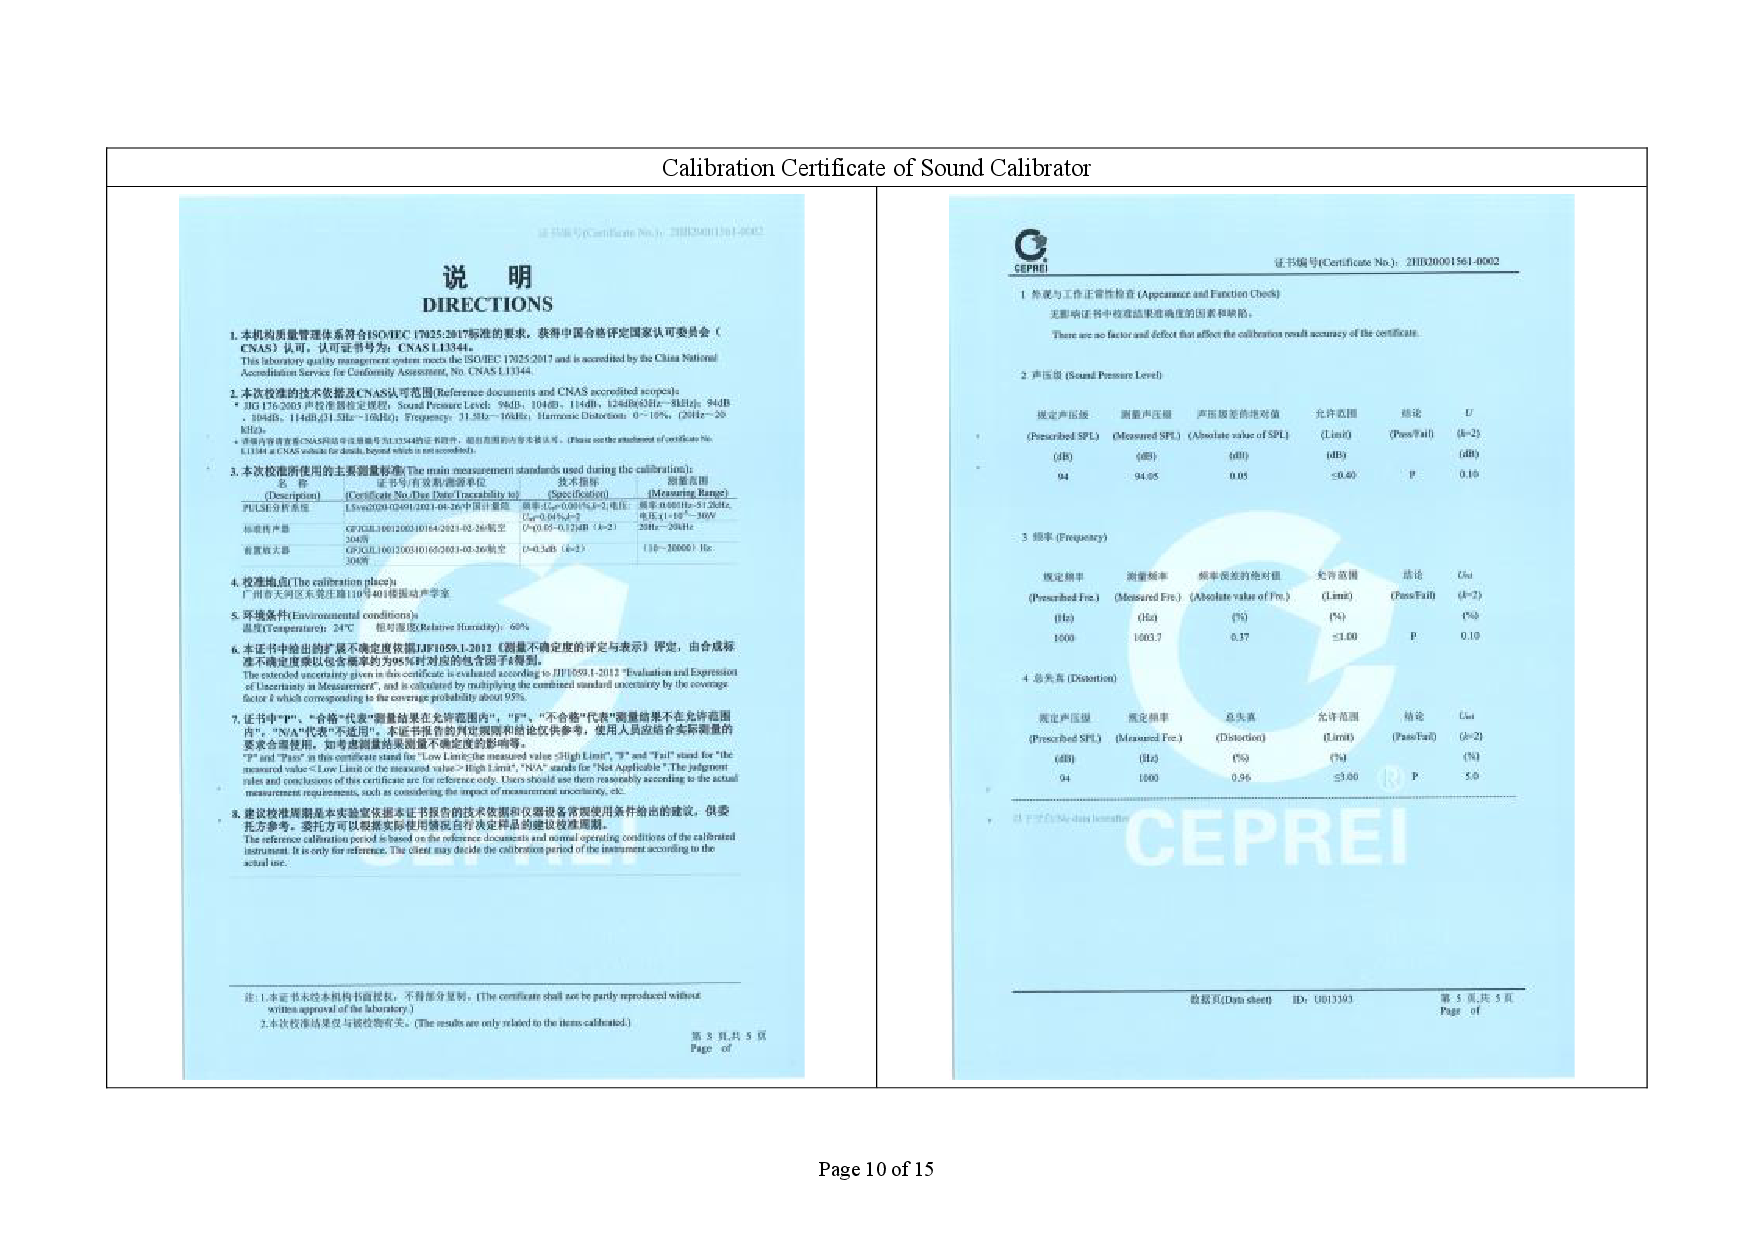
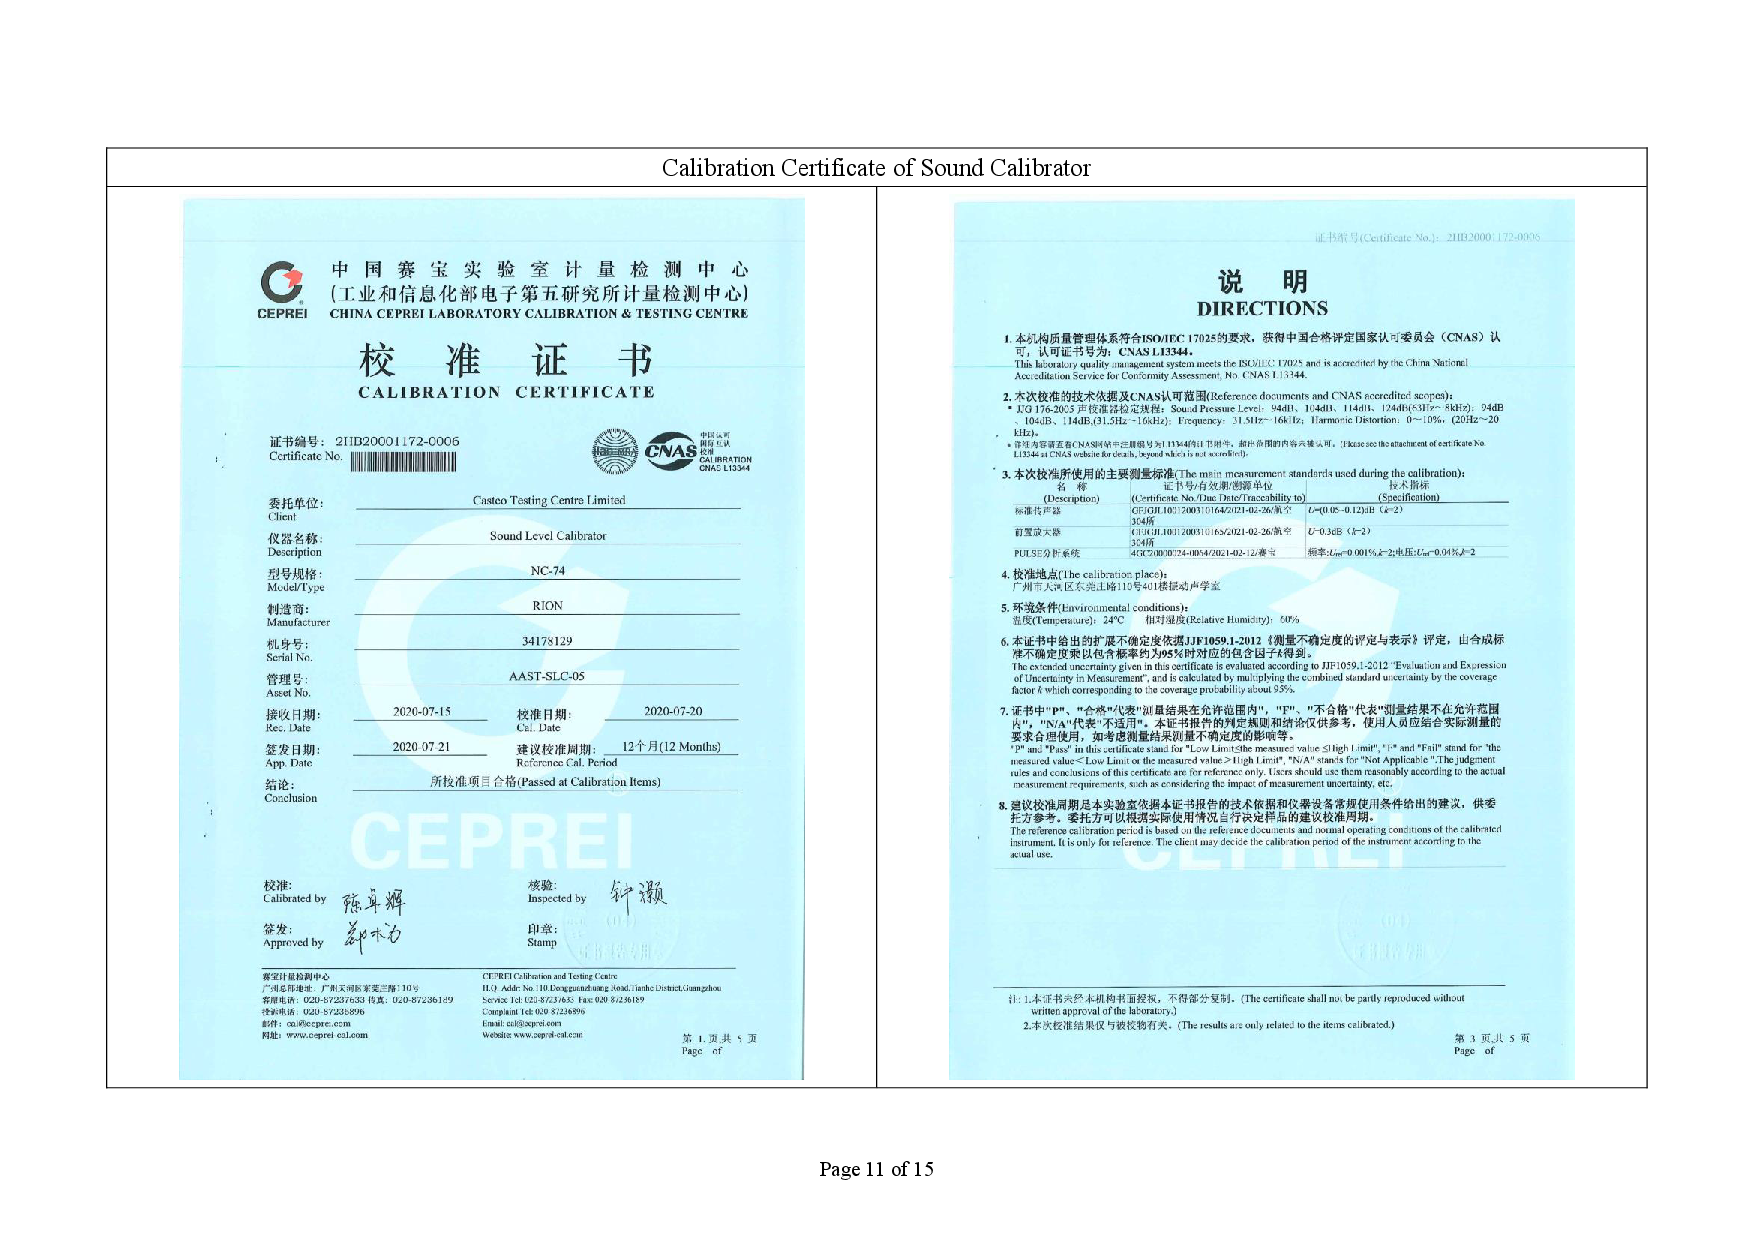
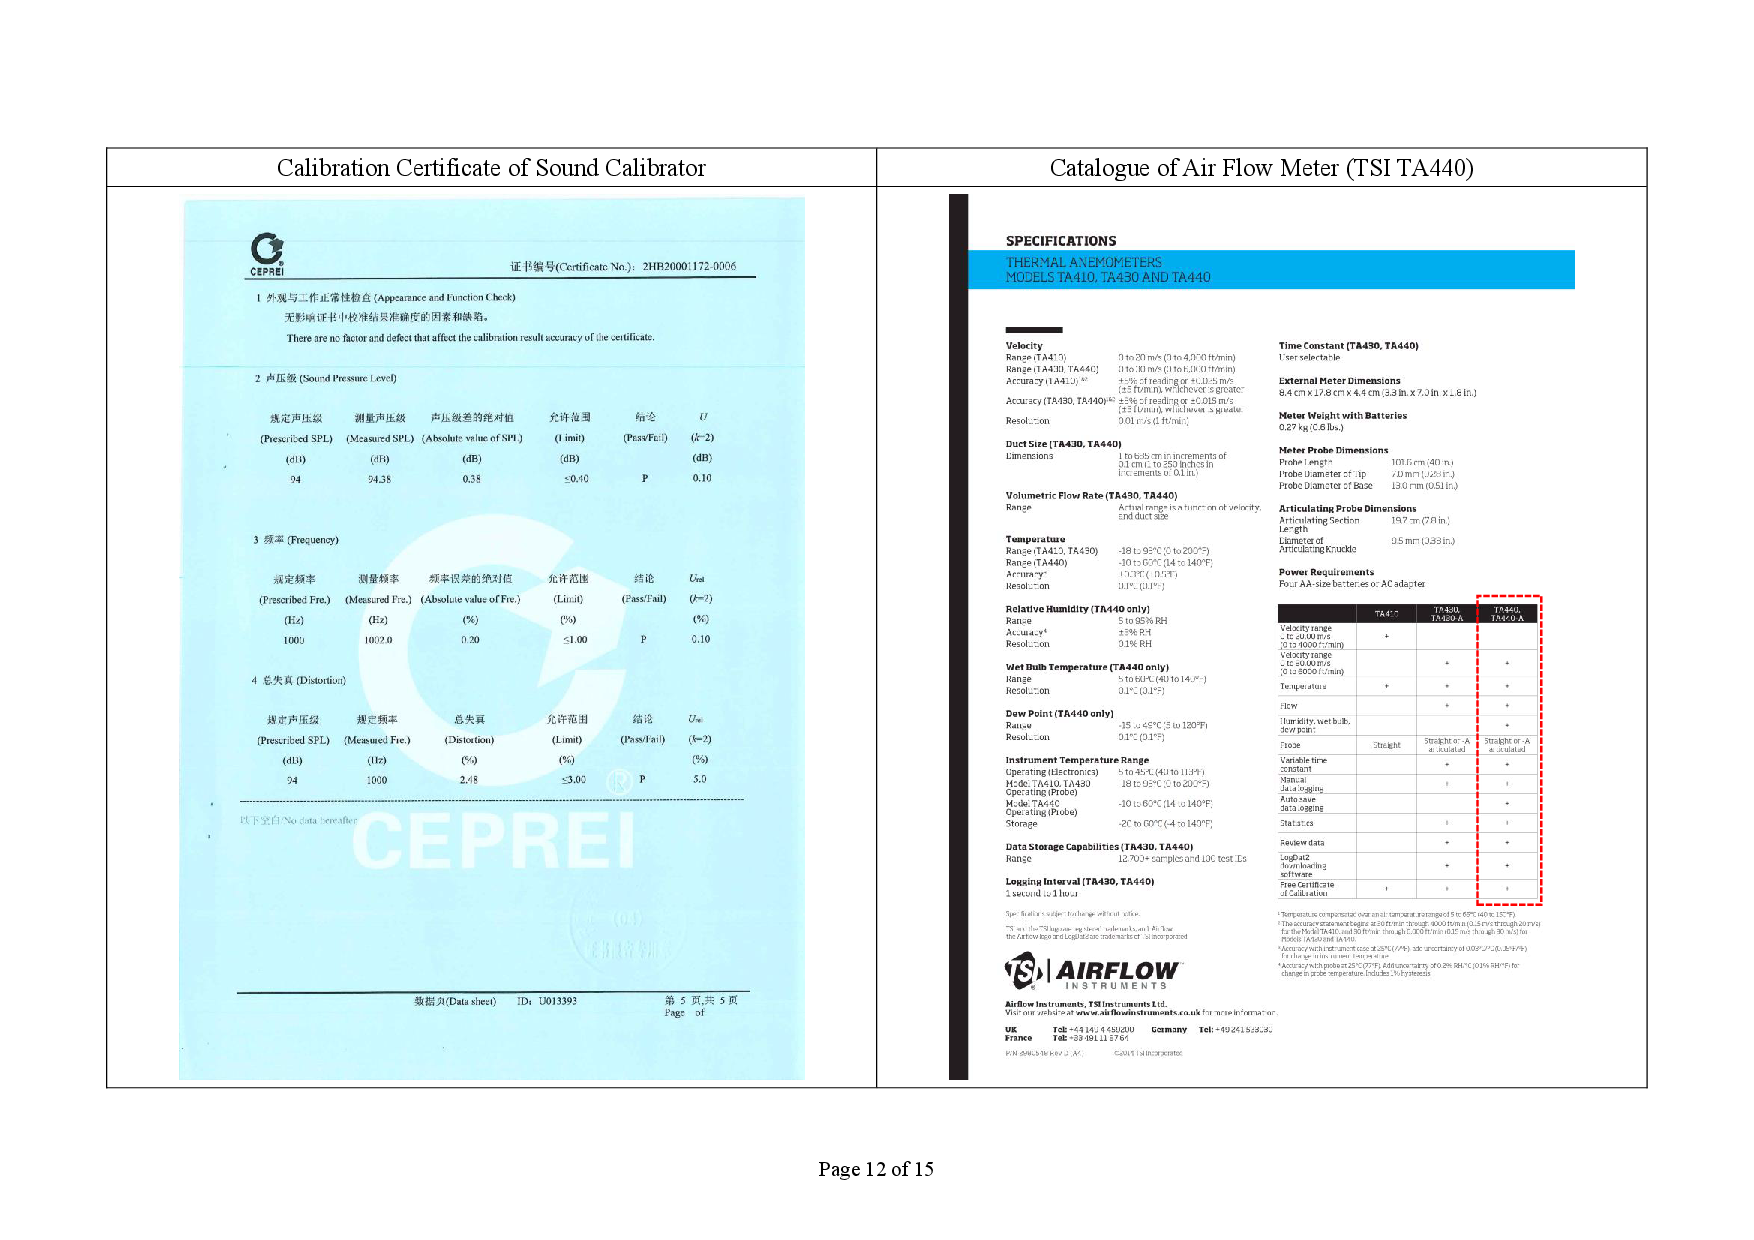
Sound Level Calibrator |
RION NC 74 |
2 |
|
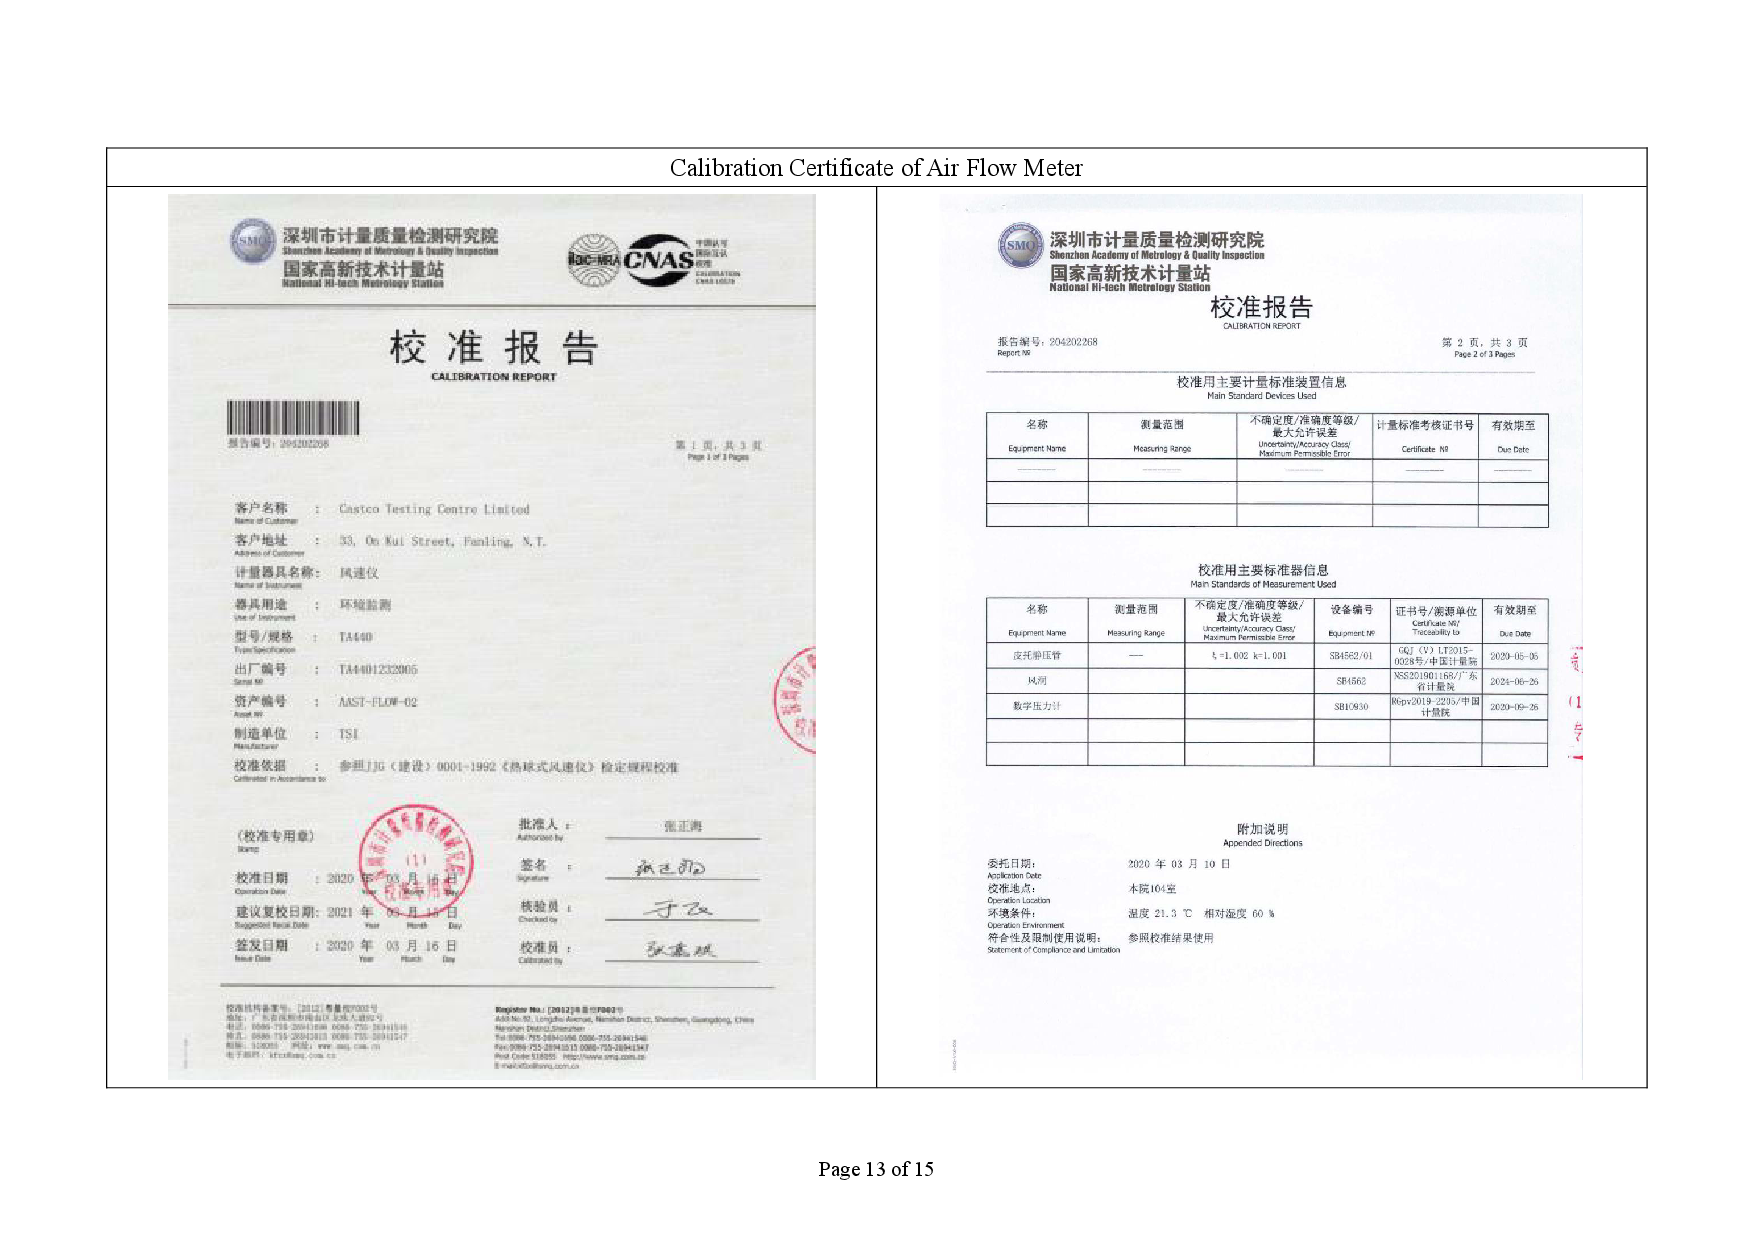
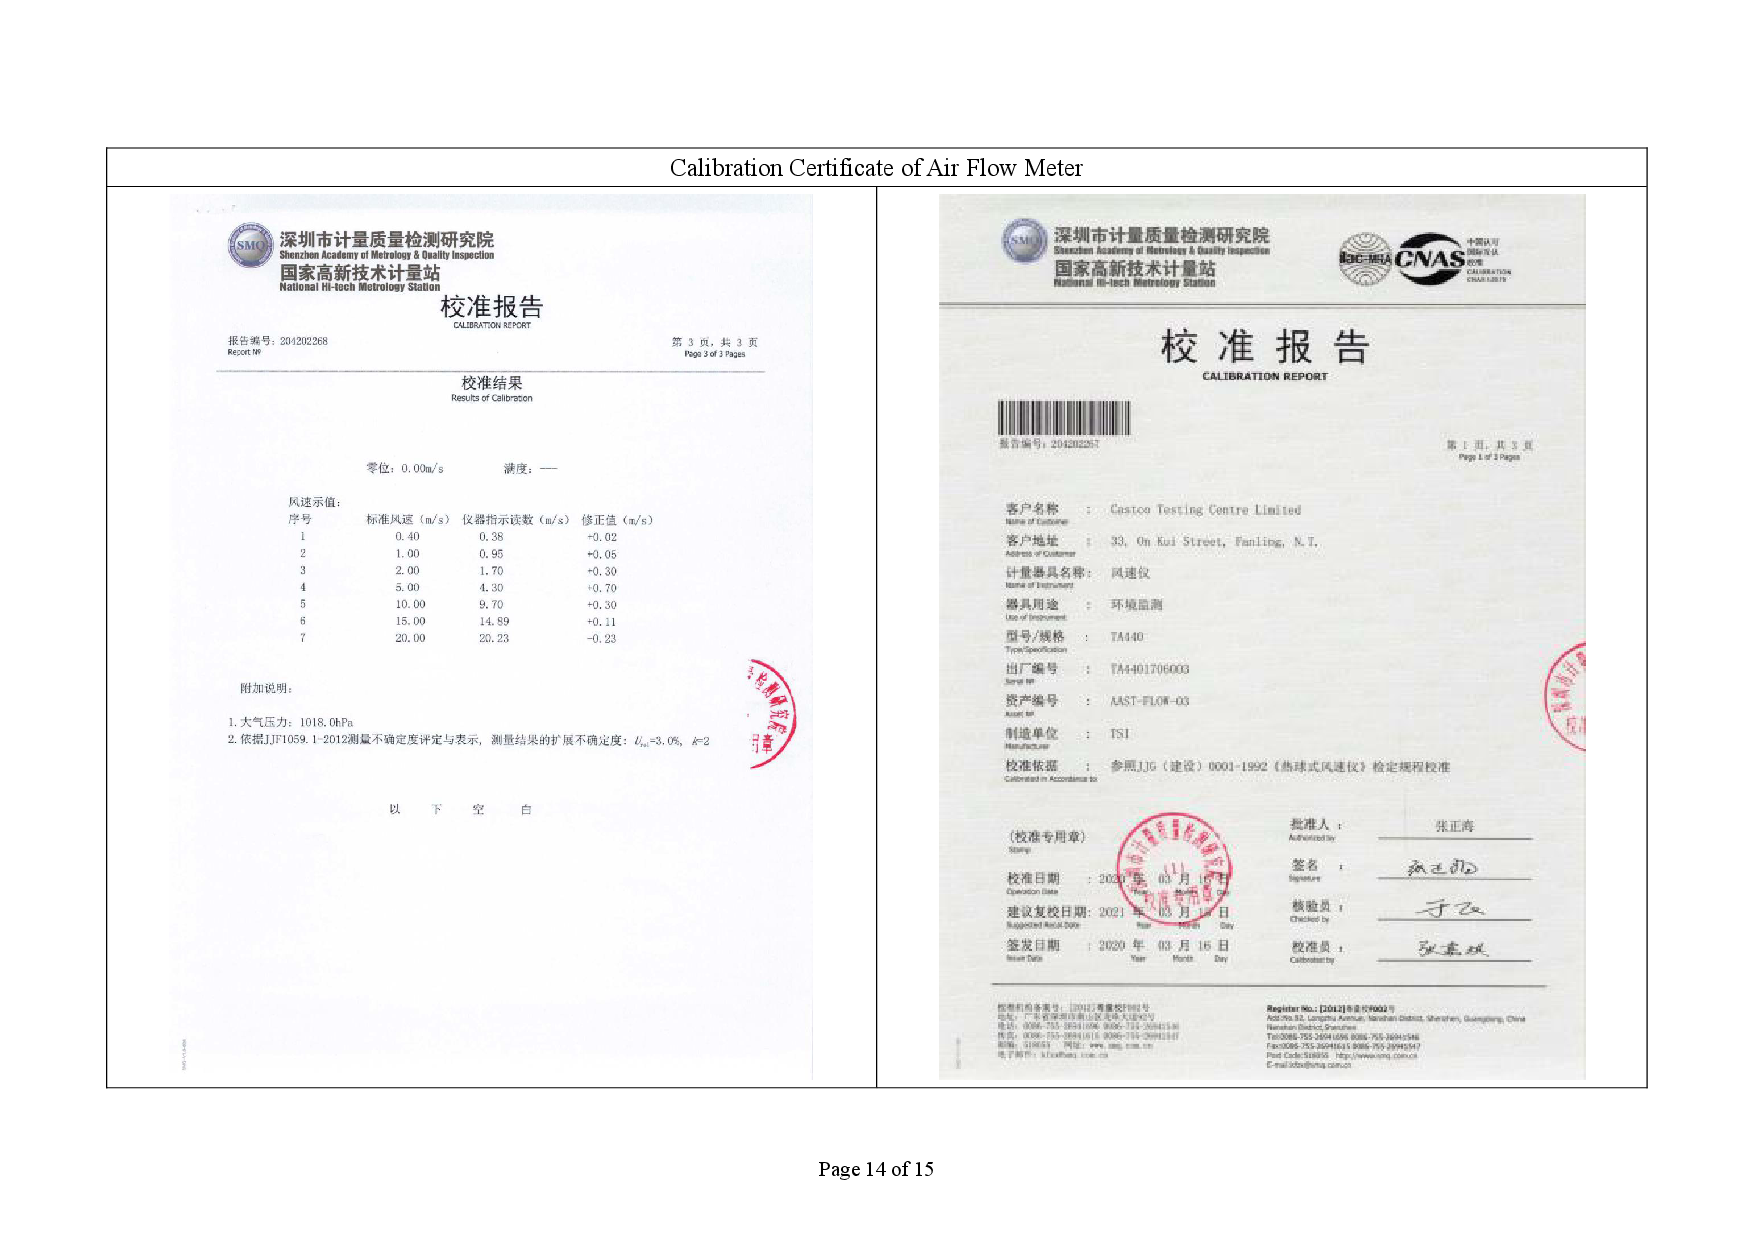
Air Flowmeter |
TSI TA440 Air Velocity |
2 |
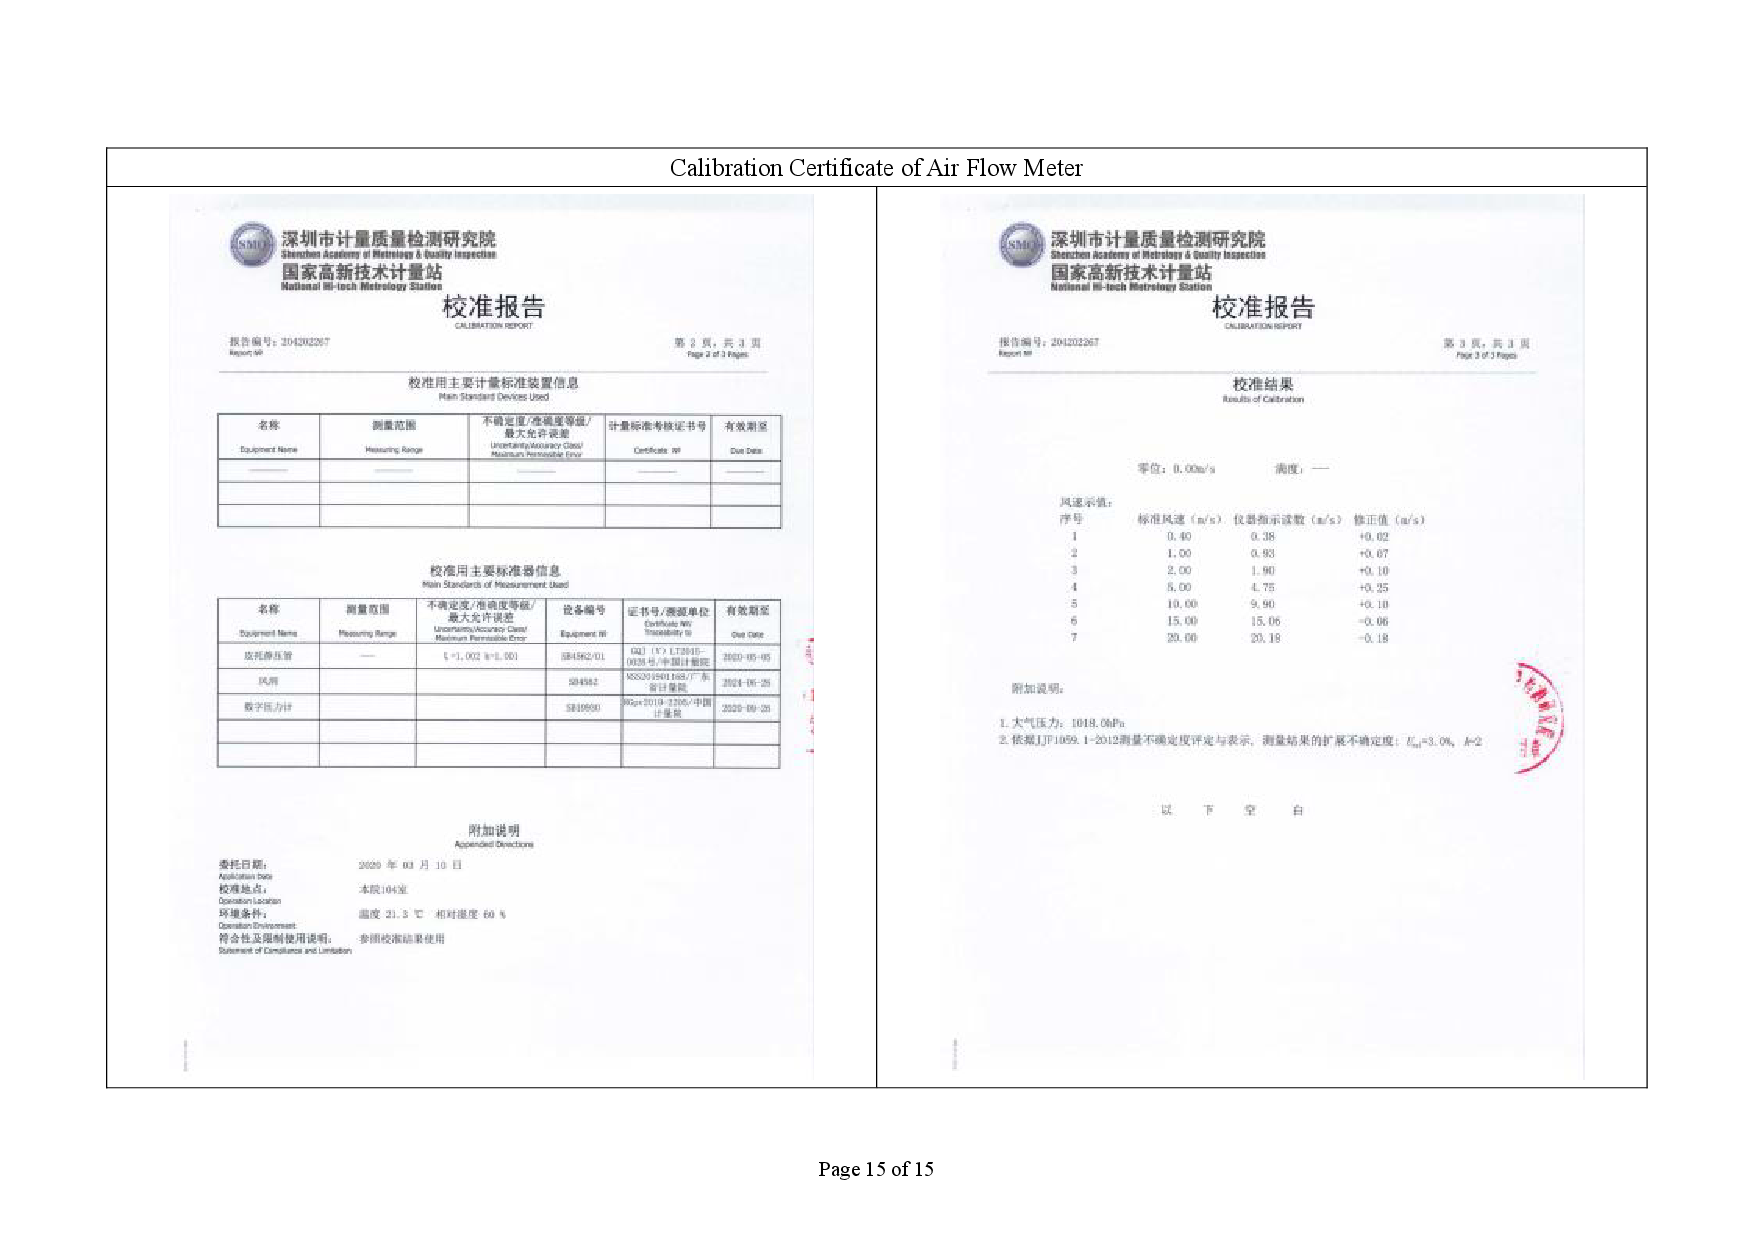
3.9 Calibration certificates, catalogue of equipment are given in Appendix J.
3.10 The noise level measurement was conducted at 1m from the exterior of the nearby noise sensitive receivers building façade and at 1.2m above the ground and facing to the source area or the planned measurement area.
3.11 No noise measurement was conducted in the presence of fog, rain, wind with a steady speed exceeding 5 m/s or wind with gusts exceeding 10 m/s. Air flow was measured by air flow meter.
3.12 Turned on the sound level meter and check the battery, if too low, change new ones.
3.13 Calibration was conducted immediately prior to and after each noise measurement, the accuracy of the sound level meters was checked by using sound calibrator generating 1,000 Hz with 94dB. Measurement data was found to be valid only if the calibration levels from before and after the noise measurement agreed to within 1.0 dB.
3.14 Noise level was recorded.
3.15 Recorded any activities that may generate noise during measurement period.
3.16 The microphone head of the sound level meter and calibrator was cleaned with a soft cloth at quarterly intervals.
3.17 The sound level meter and sound calibrator were calibrated annually.
3.18 Calibration for sound level meter was conducted immediately prior to and following each noise measurement by using sound calibrator generating a known sound pressure level at a known frequency (1,000 Hz with 94dB). Measurements may be accepted as valid only if the calibration levels from before and after the noise measurement agree to within 1.0 dB.
3.19 The Baseline Noise Levels and Action and Limit Levels for construction noise is presented in Table 3.4.
|
Time Period |
Noise Monitoring Station |
Baseline Noise Levels, dB (A) |
Action Level |
Limit Level ^ |
|
0700 – 1900 on normal weekdays |
M11 |
68.3 |
When one documented complaint is received. |
75 dB(A) |
|
M12 |
61.9 |
Note: ^ If works are to be carried out during restricted hours, the conditions stipulated in the Construction Noise Permit (CNP) issued by the Noise Control Authority have to be followed.
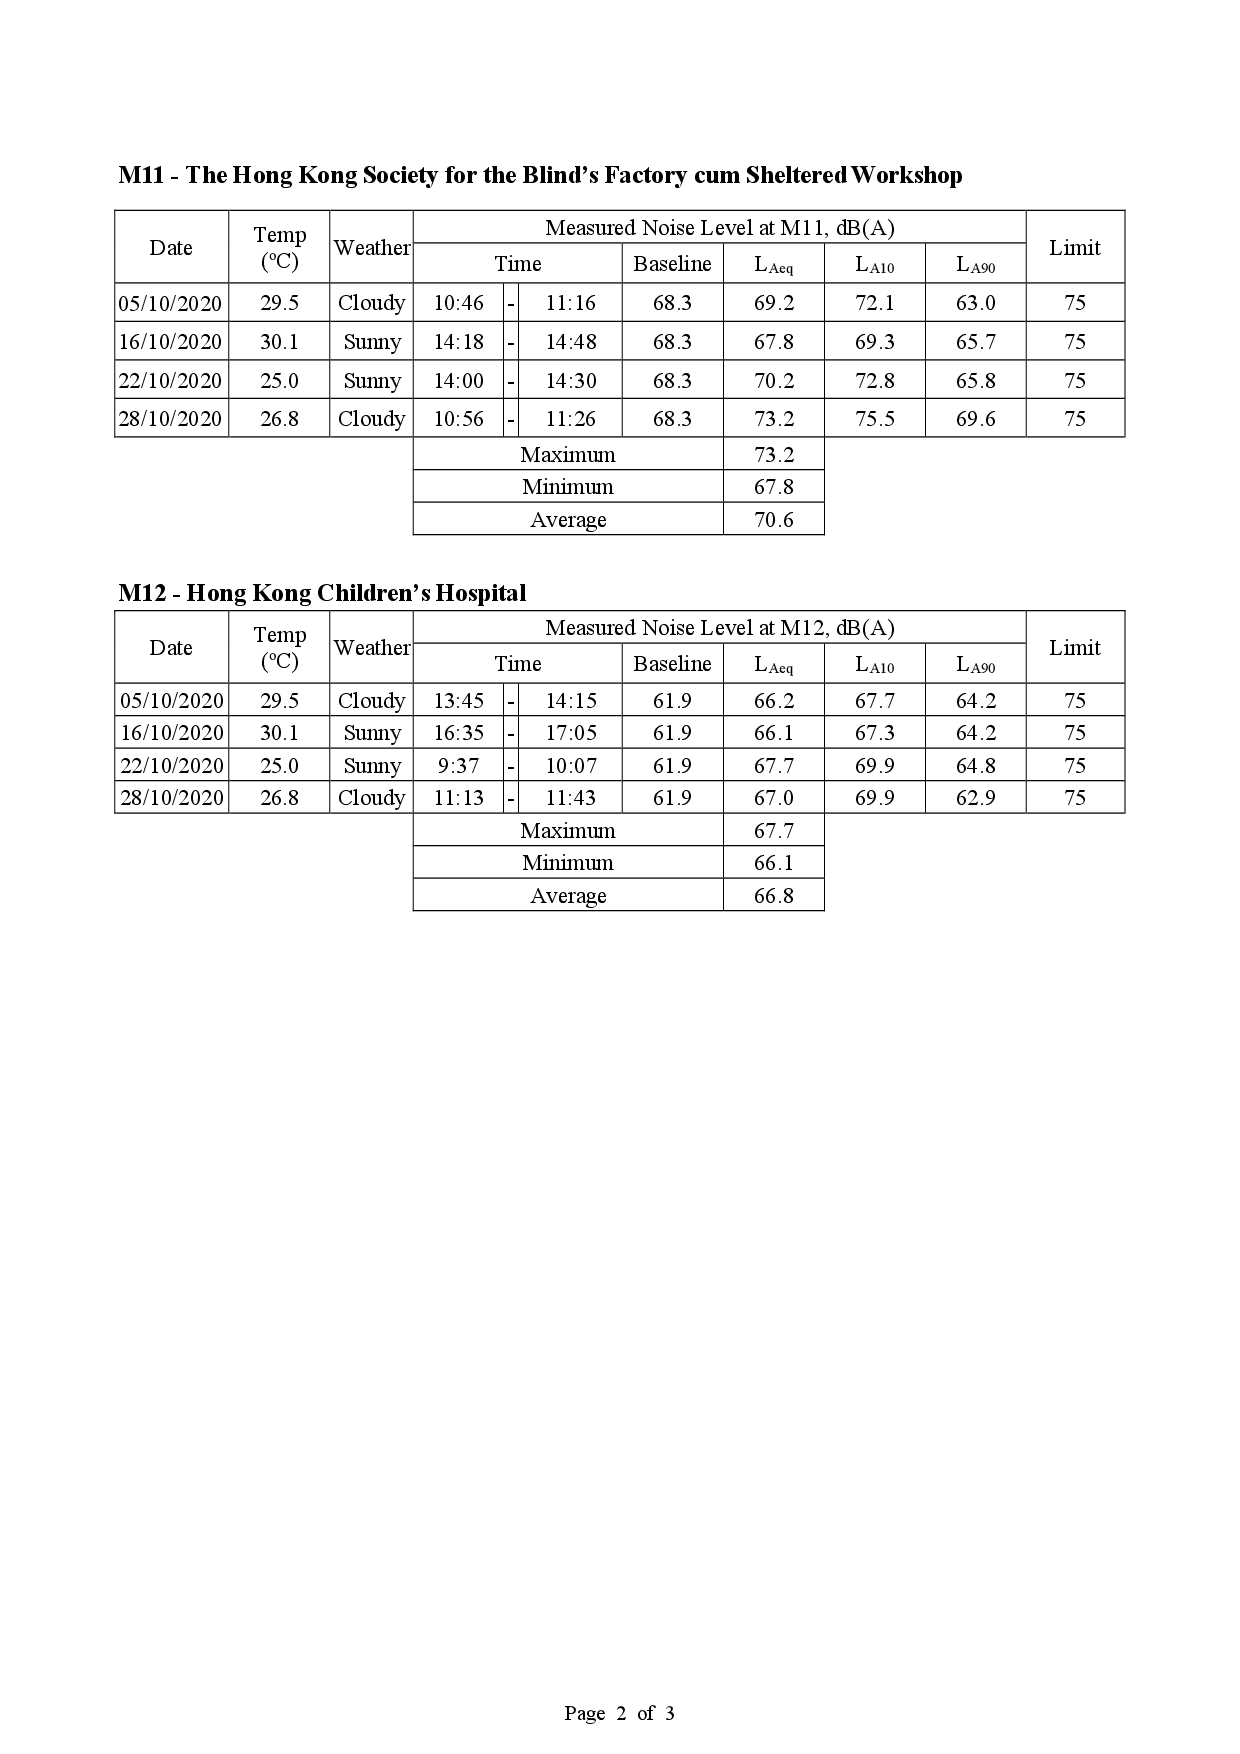
3.20 Impact noise monitoring results at the designed noise monitoring stations are summarized in Table 3.5 respectively.
|
Noise Monitoring Station |
Measured LAeq, 30-min, Average, dB(A) |
Measured LAeq, 30-min, Range, dB(A) |
Action Level |
Limit Level ^ |
|
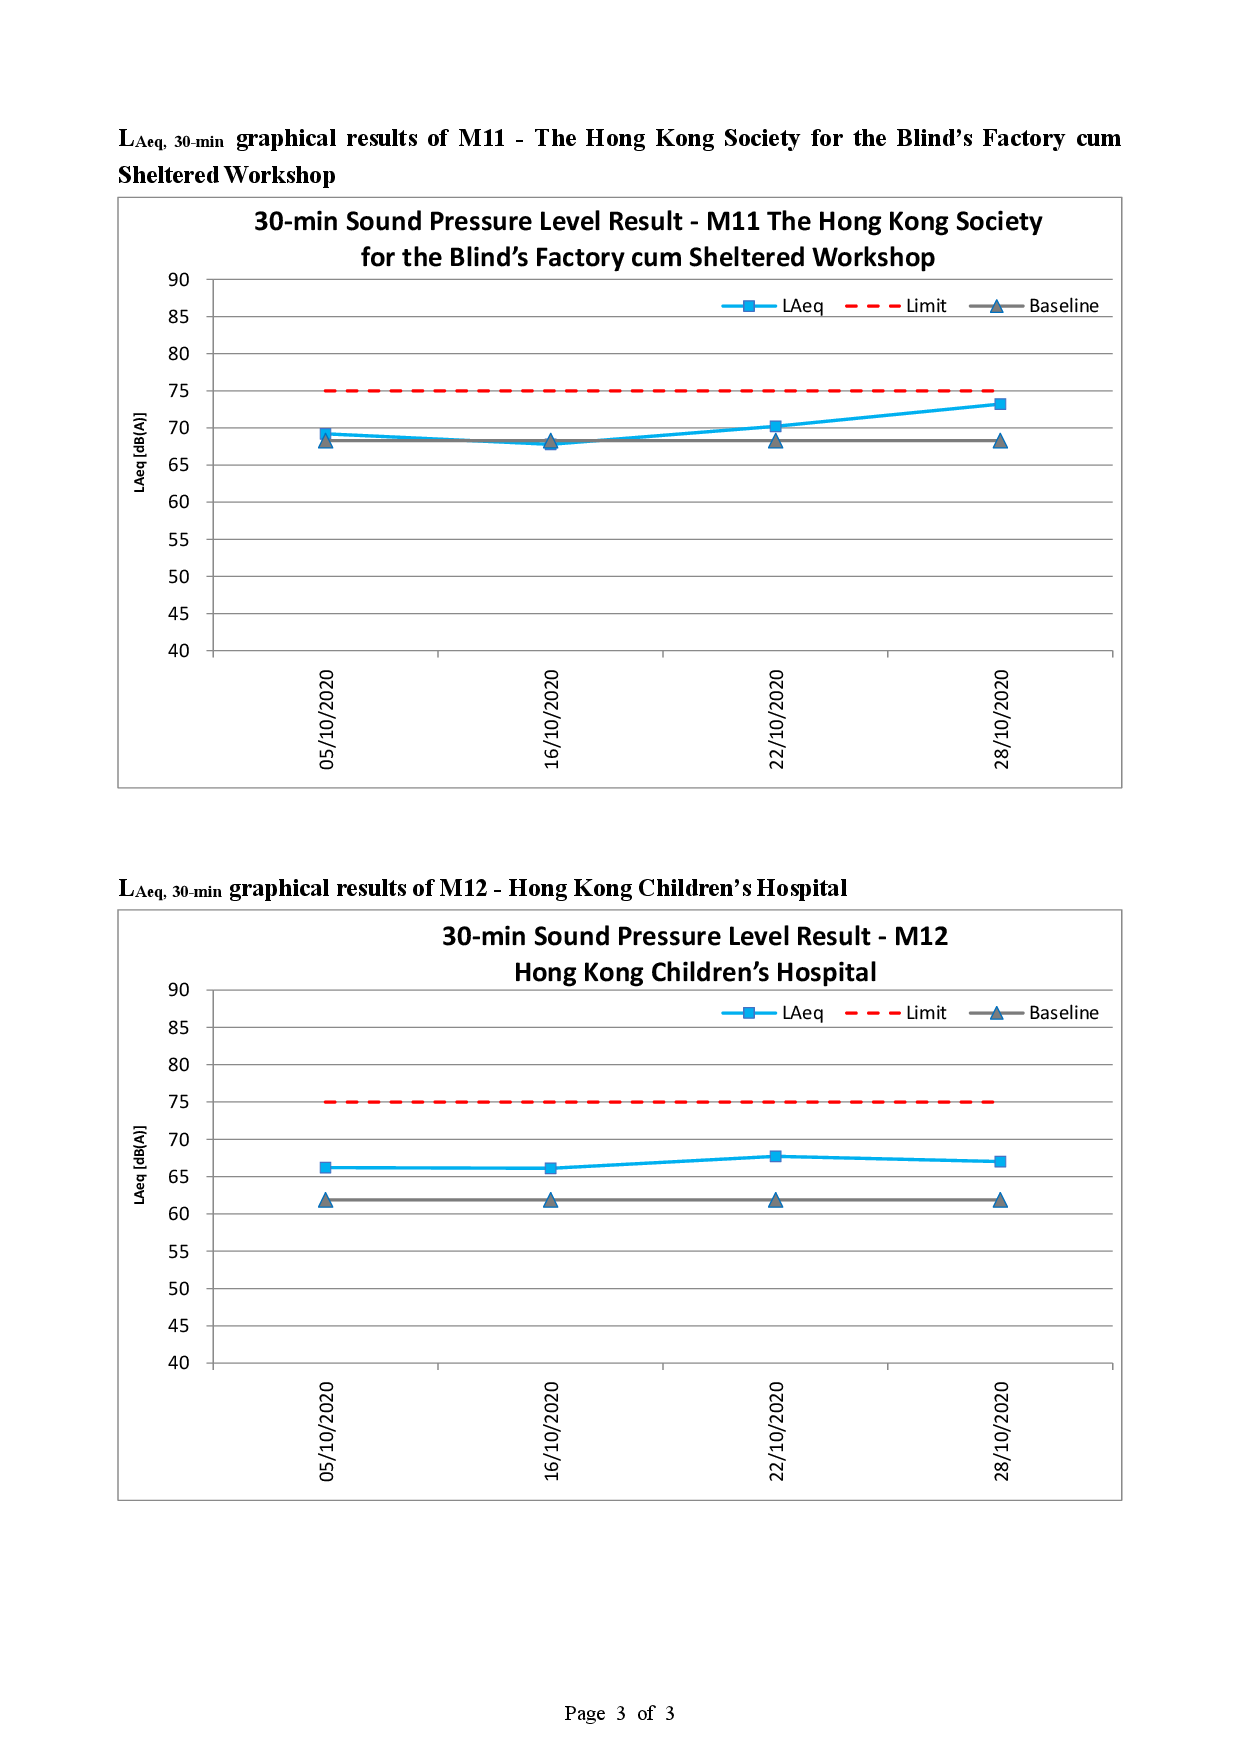
M11 |
70.6 |
67.8 – 73.2 |
When one documented complaint is received |
75 dB(A) |
|
M12 |
66.8 |
66.1 – 67.7 |
Note: ^ If works are to be carried out during restricted hours, the conditions stipulated in the Construction Noise Permit (CNP) issued by the Noise Control Authority have to be followed.
3.21 There were no action level exceedance of noise monitoring and limit level exceedance of LAeq, 30min recorded during the reporting month.
3.22 Graphical presentation and detailed monitoring results are shown in Appendix K.
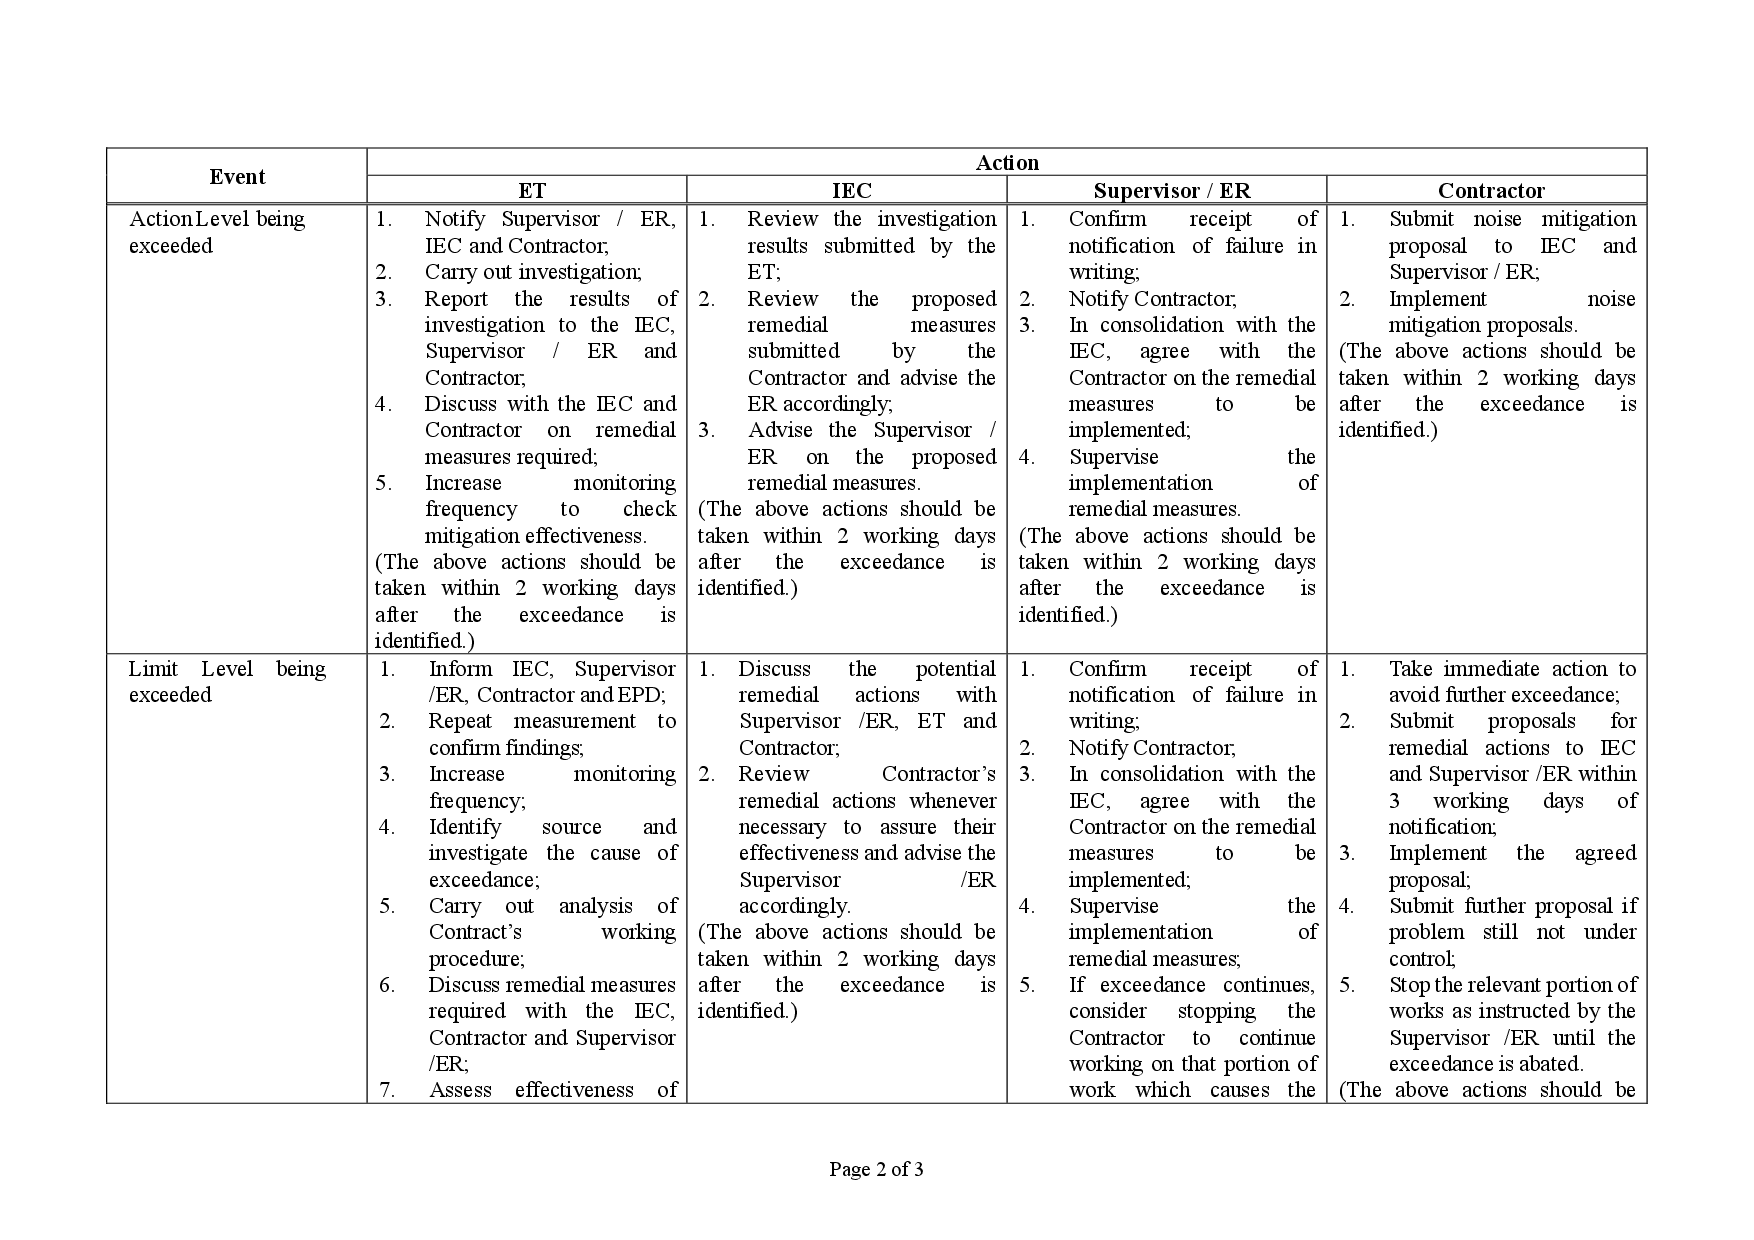
3.23 The Event and Action Plan is provided in Appendix L.
3.24 Non-project related construction activities in the adjacent construction sites were observed during the reporting period and may affect the monitoring results.
4.1 The environmental impacts predictions were given in Agreement No. CE 35/2006(CE) Kai Tak Development Engineering Study cum Design and Construction of Advance Works - Investigation, Design and Construction - Kai Tak Development Environmental Impact Assessment Report, EIA Register Nos. AEIAR-130/2009 for Kai Tak Development (The EIA Report). The EM&A data was compared with the EIA predictions as summarized in Table 4.1 to Table 4.3.
|
Air Monitoring Station |
ASR No. in EIA report |
Predicted Cumulative Maximum 24-hour average TSP concentration |
Measured 24-hr average TSP in Reporting Month (October 2020) mg/m3 |
|
|
Scenario 1 (Mid 2009 to Mid 2013), µg/m3 |
Scenario 2 (Mid 2013 to Late 2016), µg/m3 |
|||
|
AM3 - Sky Tower |
A40^ |
106 |
138 |
53 – 72 |
|
AM4(A) - The Hong Kong Society for the Blind’s Factory cum Sheltered Workshop |
A43^ |
123 |
195 |
39 – 72 |
|
AM7 – Hong Kong Children’s Hospital |
PA60 |
NA |
NA |
44 – 68 |
Note:
^ Prediction results are given in the Table 3.13 of the EIA report EIA Register Nos. AEIAR-130/2009 for Kai Tak Development.
|
Air Monitoring Station |
ASR No. in EIA report |
Predicted Cumulative Maximum 1-hour average TSP concentration |
Measured 1-hr average TSP in Reporting Month (October 2020) mg/m3 |
|
|
Scenario 1 (Mid 2009 to Mid 2013), µg/m3 |
Scenario 2 (Mid 2013 to Late 2016), µg/m3 |
|||
|
AM3 - Sky Tower |
A40 |
217^ |
247^ |
70 – 94 |
|
AM4(A) - The Hong Kong Society for the Blind’s Factory cum Sheltered Workshop |
A43 |
283^ |
409^ |
74 – 95 |
|
AM7 – Hong Kong Children’s Hospital |
PA60 |
NA |
NA |
67 – 131 |
Note:
^ Prediction results are given in the Table 3.13 of the EIA report EIA Register Nos. AEIAR-130/2009 for Kai Tak Development.
|
Noise Monitoring Station |
NSR No. in EIA report |
Predicted Mitigated Construction Noise Levels during Normal Daytime Working Hour LAeq, 30min, dB(A) |
Measured Noise Level in Reporting Month (October 2020) LAeq, 30min, dB(A) |
|
M11 - The Hong Kong Society for the Blind’s Factory cum Sheltered Workshop |
N18 |
50 – 76* |
67.8 – 73.2 |
|
M12 - Hong Kong Children’s Hospital |
PN83, PN84, PN84A |
NA |
66.1 – 67.7 |
Note:
* Prediction results are given in the Table 3.20 of the EIA report EIA Register Nos. AEIAR-130/2009 for Kai Tak Development.
4.2 24-hour TSP monitoring results at AM3, AM4(A) were recorded lower than the prediction in the EIA Report.
4.3 No prediction in the EIA Report for 24-hour TSP monitoring results at AM7.
4.4 1-hour TSP monitoring results at AM3, AM4(A) were recorded lower than the prediction in the EIA Report.
4.5 No prediction in the EIA Report for 1-hour TSP monitoring results at AM7.
4.6 Noise monitoring results at M11 was recorded lower than the prediction in the EIA Report.
4.7 No prediction in the EIA Report for noise monitoring results at M12.
5.1 In accordance with EM&A Manuals (EIA Register Nos. AEIAR-130/2009 and AEIAR-170/2013), Landscape and Visual Monitoring shall be carried out during the construction phase of the Project. Regular impact monitoring will be conducted at least once per week.
5.2 Site inspections were carried out on a weekly basis to monitor the timely implementation of proper environmental management practices and mitigation measures in the Project site.
5.3 Site inspections were conducted on 8, 14, 22 and 29 October 2020 in the reporting month.
5.4 The summaries of site audits are attached in Table 5.1.
|
Inspection Date |
Key Observations |
Recommendations / Actions |
Close-out Date / Status |
|
8 October 2020 |
No |
NA |
NA |
|
14 October 2020 |
No |
NA |
NA |
|
22 October 2020 |
No |
NA |
NA |
|
29 October 2020 |
No |
NA |
NA |
5.5 No non-compliance of the landscape and visual impact was recorded in the reporting month.
5.6 Should non-compliance of the landscape and visual impact occur, action in accordance with the action plan presented in Appendix M shall be performed.
6.1 Site inspections were carried out on a weekly basis to monitor the timely implementation of proper environmental management practices and mitigation measures in the Project site.
6.2 Site inspections were conducted on 8, 14, 22 and 29 October 2020 in the reporting month.
6.3 The summaries of site audits are attached in Table 6.1.
|
Inspection Date |
Key Observations |
Recommendations / Actions |
Close-out Date / Status |
|
8 October 2020 |
No |
NA |
NA |
|
14 October 2020 |
Observation: 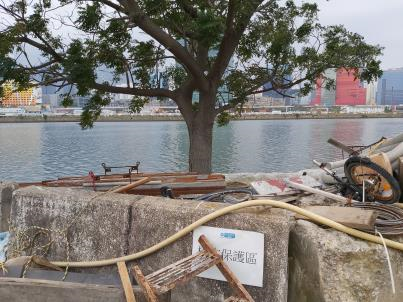
The tree protection zone should be kept clean. |
Action Taken: 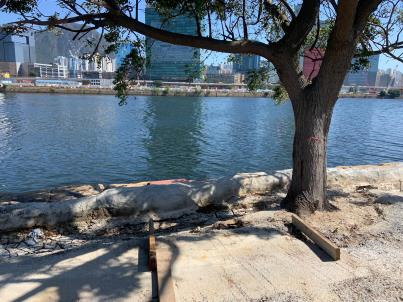
The tree protection zone were cleaned. |
Closed-out 22 October 2020 |
|
Observation: 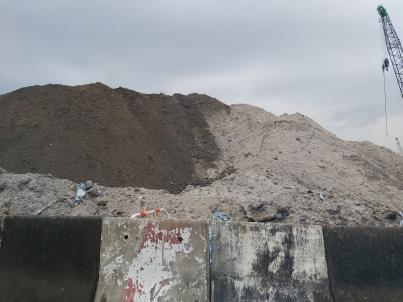
The open stockpiles of construction materials on sites should be covered. |
Action Taken: 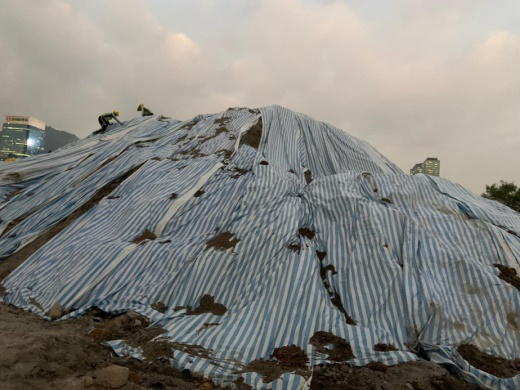
The open stockpiles of construction materials on sites were covered. |
Closed-out 22 October 2020 |
|
|
22 October 2020 |
No |
NA |
NA |
|
29 October 2020 |
No |
NA |
NA |
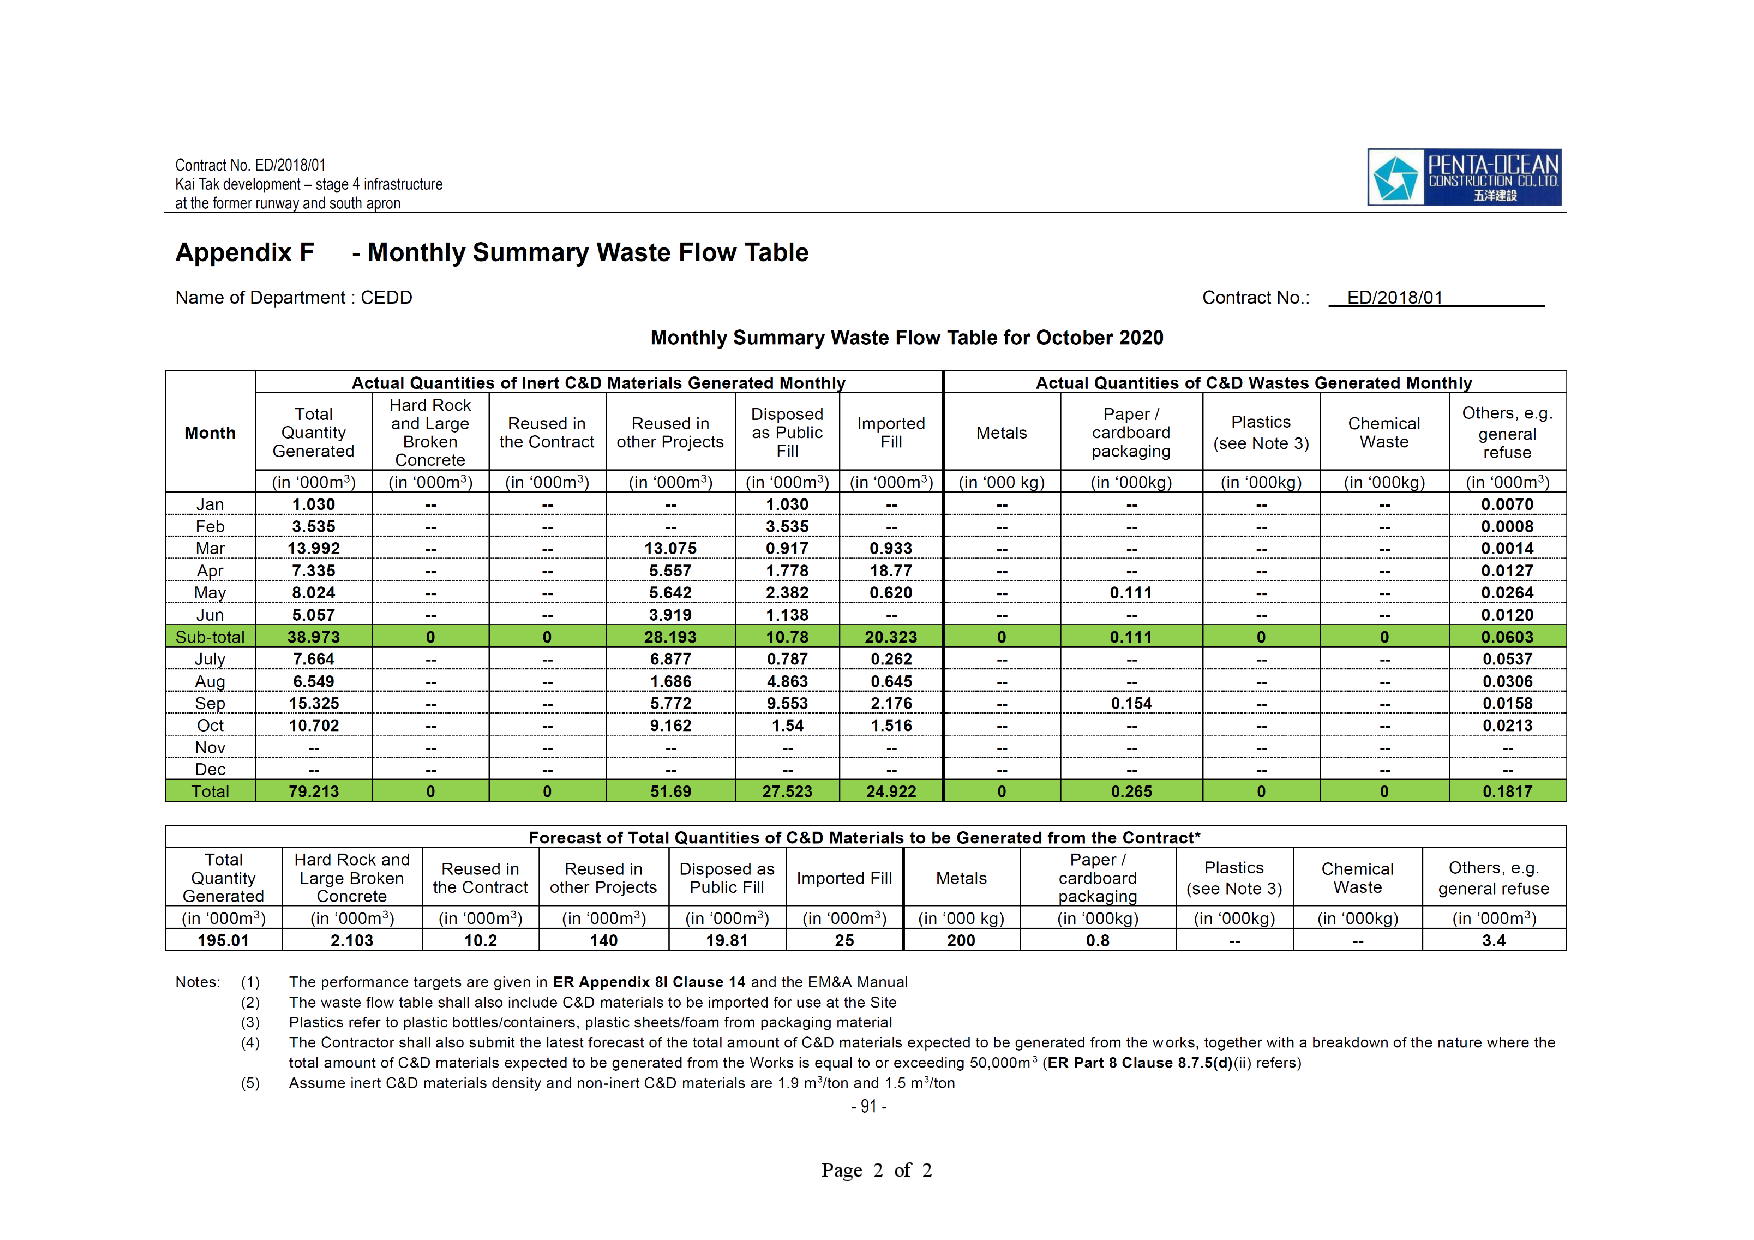
6.4 The amount of wastes generated by the major site activities of the work contracts within the Project during the reporting month is shown in Appendix N.
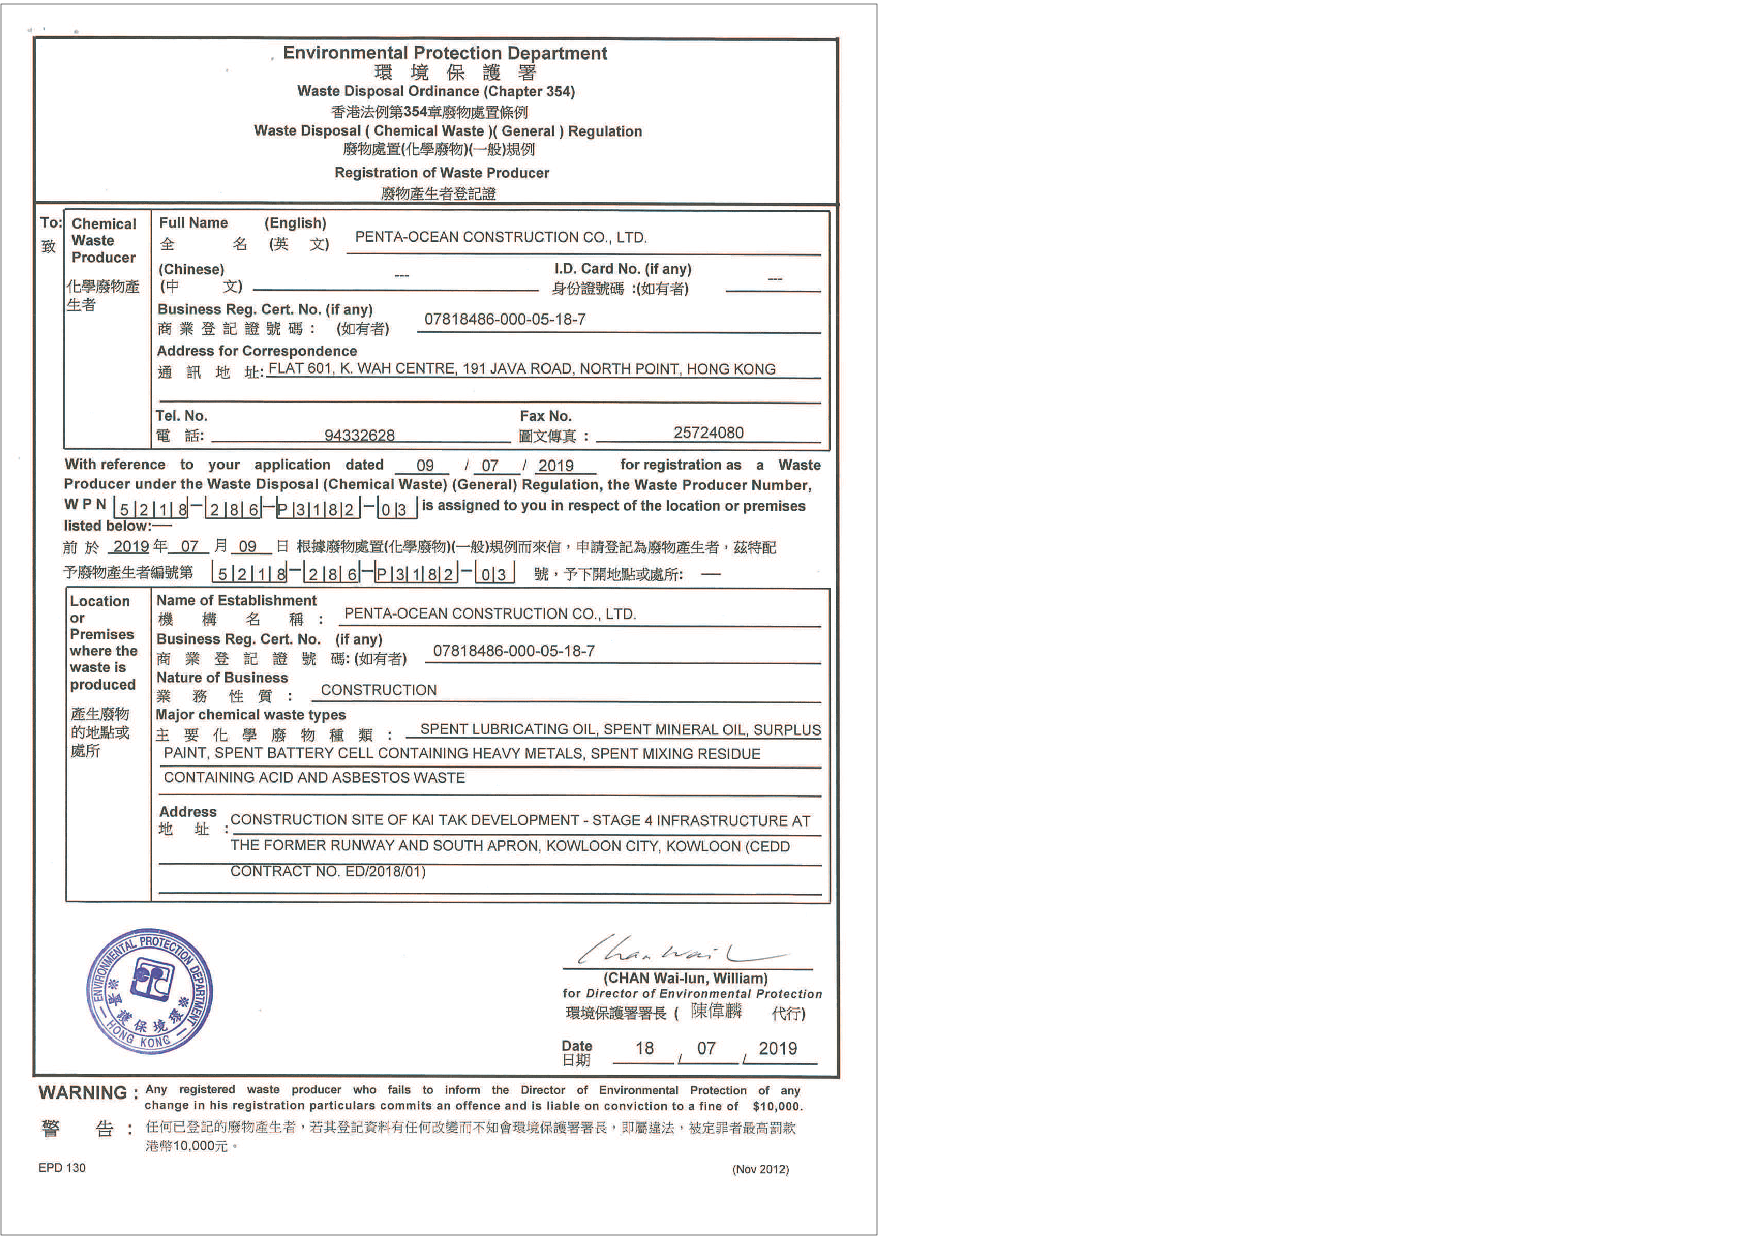
6.5 The Contractor was registered as a chemical waste producer for the Project. The Contractor was reminded that chemical waste containers should be properly treated and stored temporarily in designated chemical waste storage area on site in accordance with the Code of Practice on the Packaging, Labelling and Storage of Chemical Wastes.
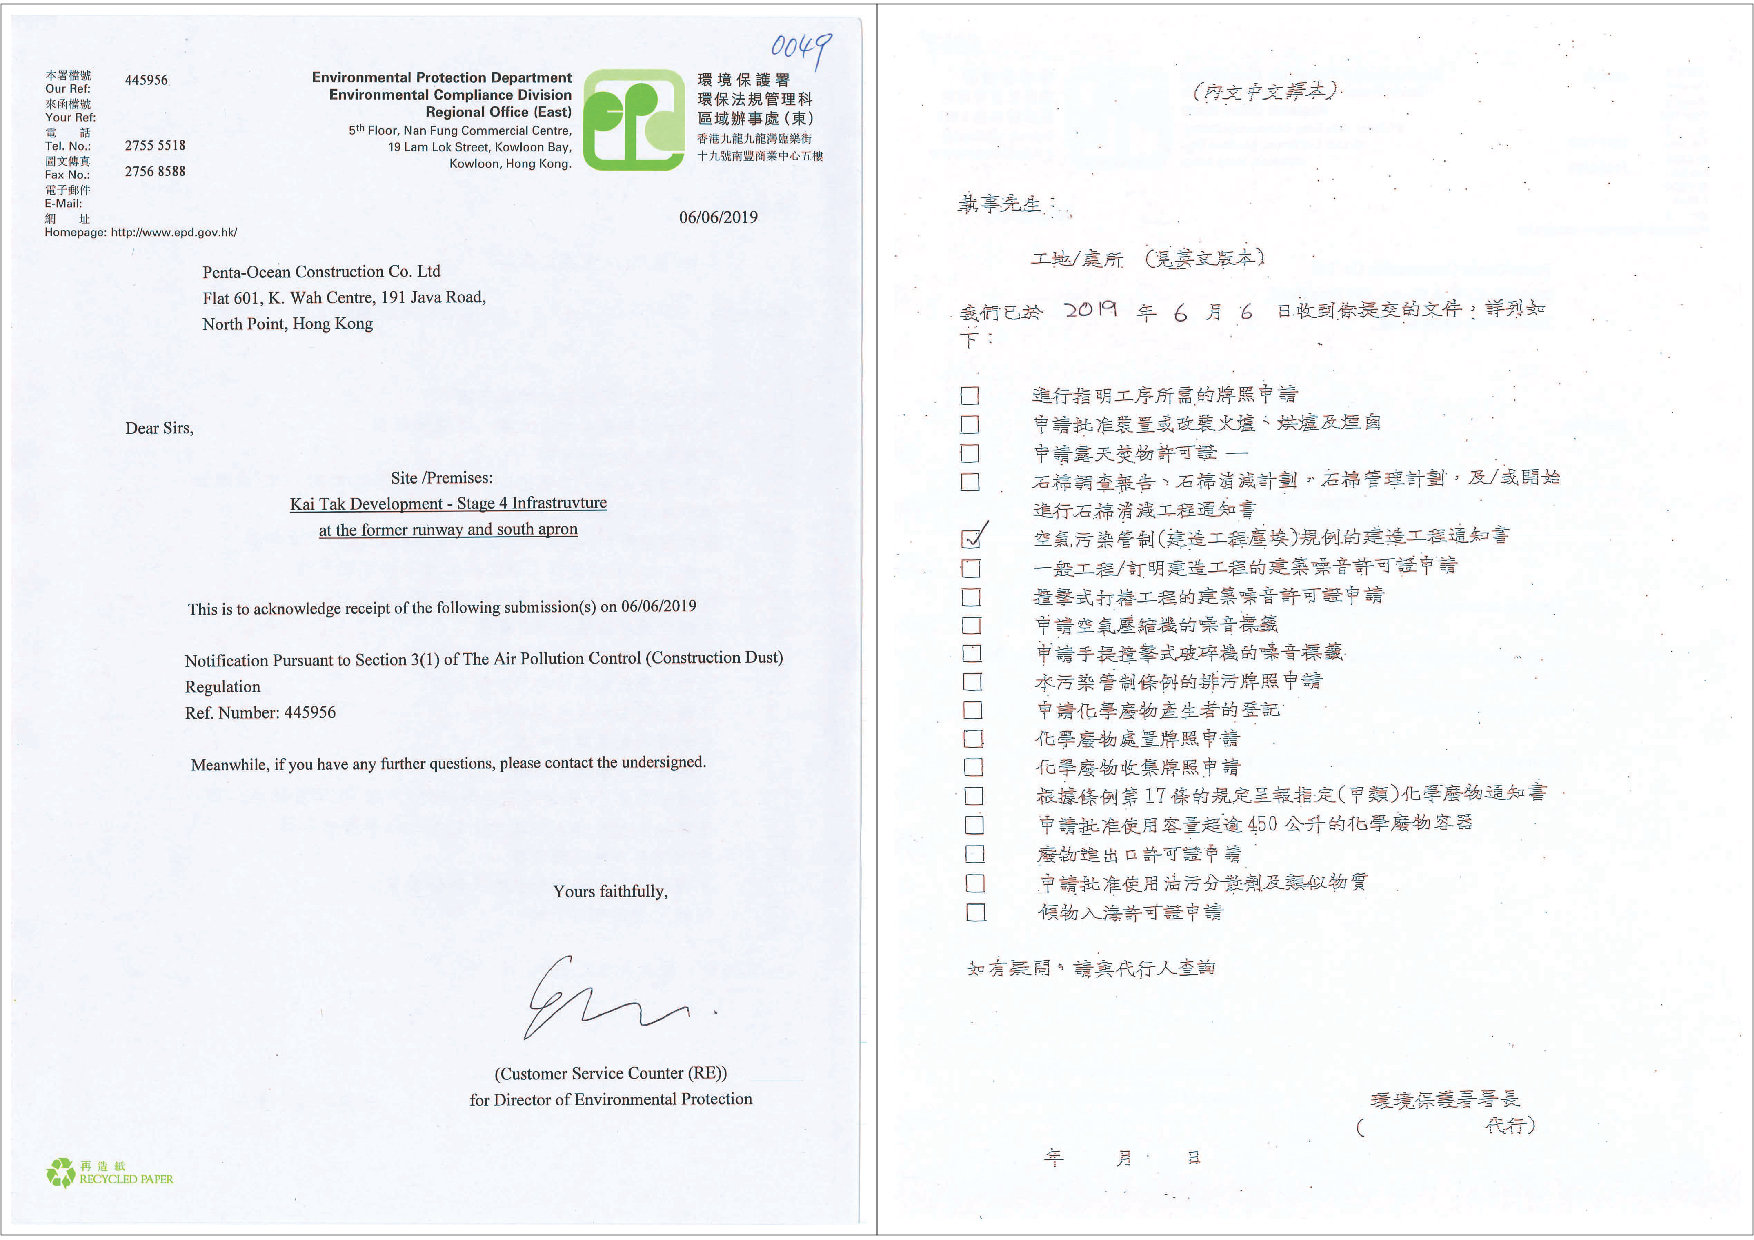
6.6 A summary of the relevant permits, licenses and/or notifications on environmental protection for the Project is shown in Table 6.2. Environmental licenses and notifications are reported in Appendix O.
|
Environmental Licenses, Notifications and Permits |
Ref. No. |
Valid Form |
Valid Till |
|
Environmental Permit under EIAO |
EP-337/2009 |
23 Apr 2009 |
N/A |
|
EP-445/2013 |
3 May 2013 |
N/A |
|
|
EP-445/2013/A |
13 Aug 2014 |
N/A |
|
|
Construction Dust Notification under APCO |
445956 |
6 Jun 2019 |
N/A |
|
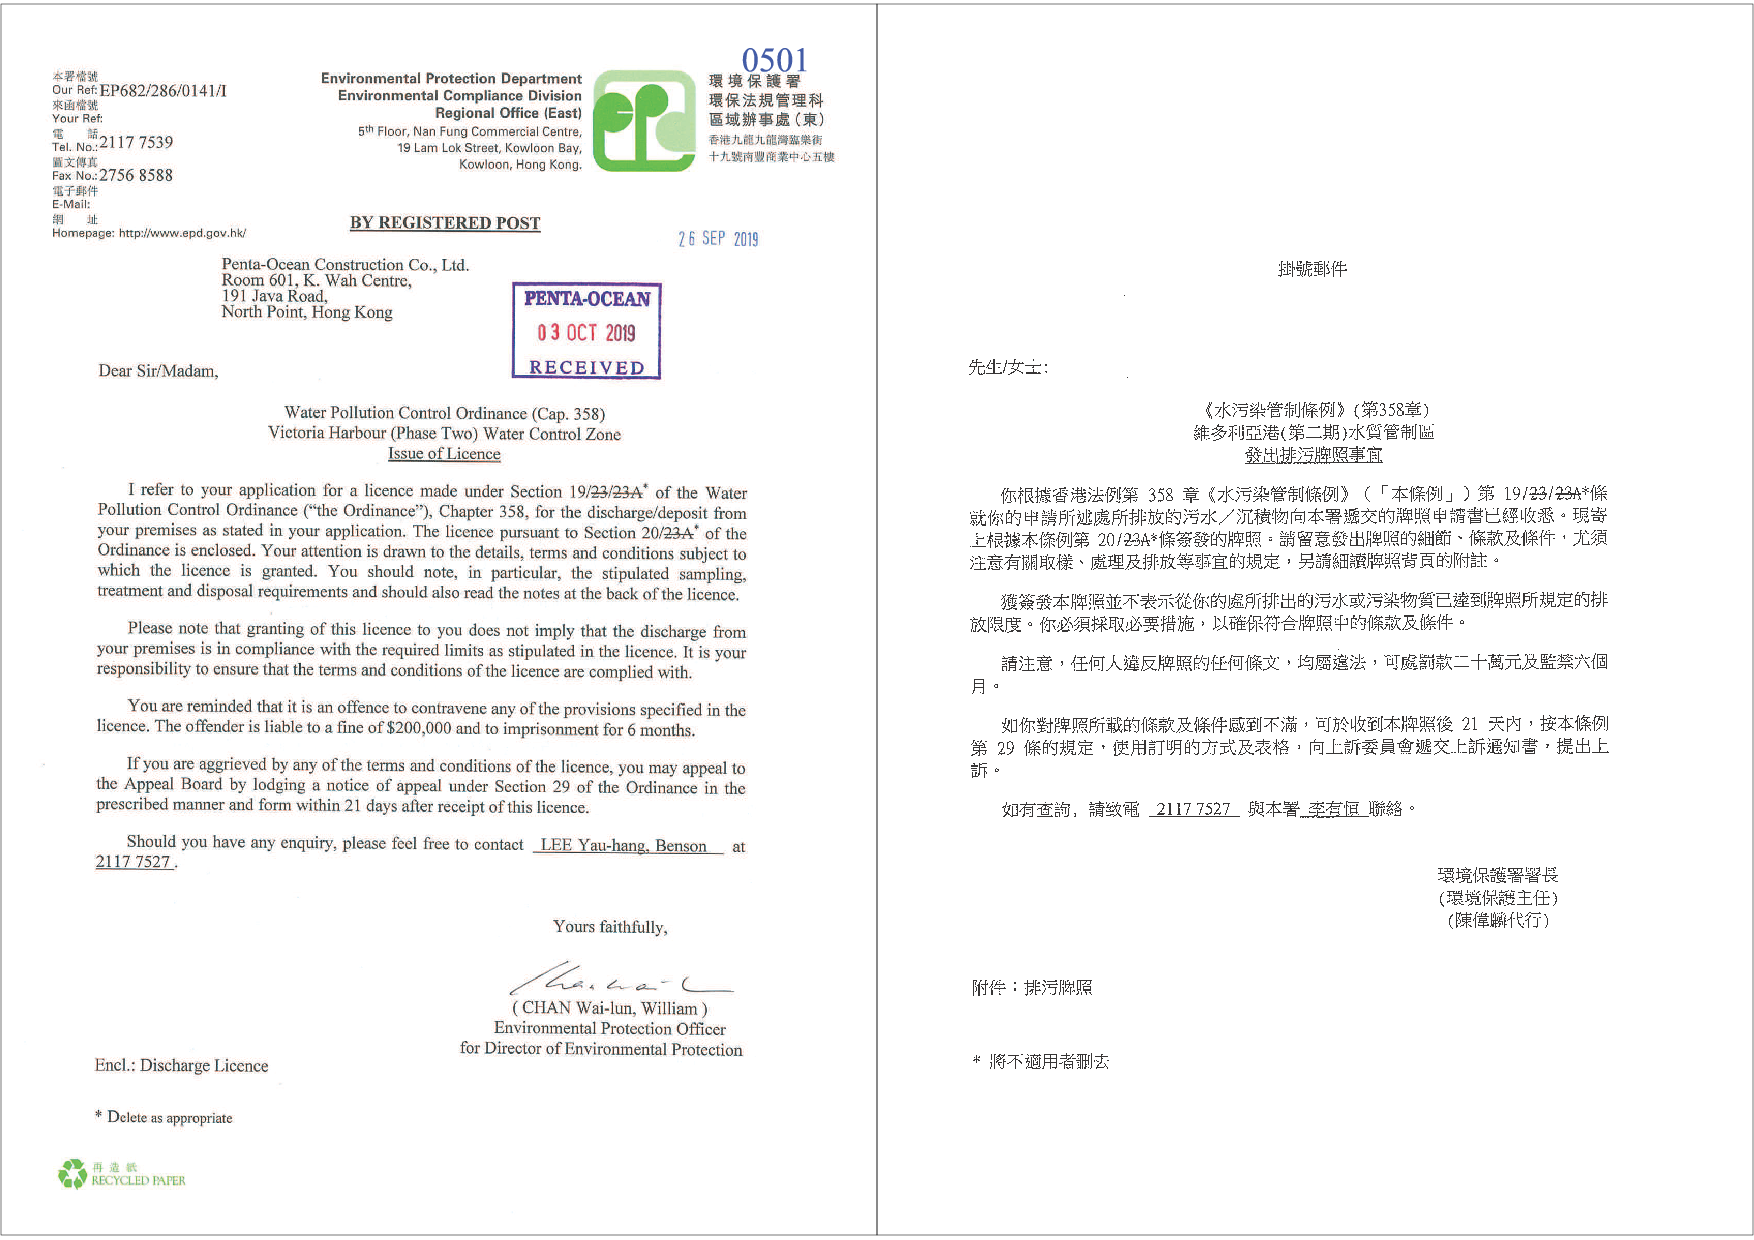
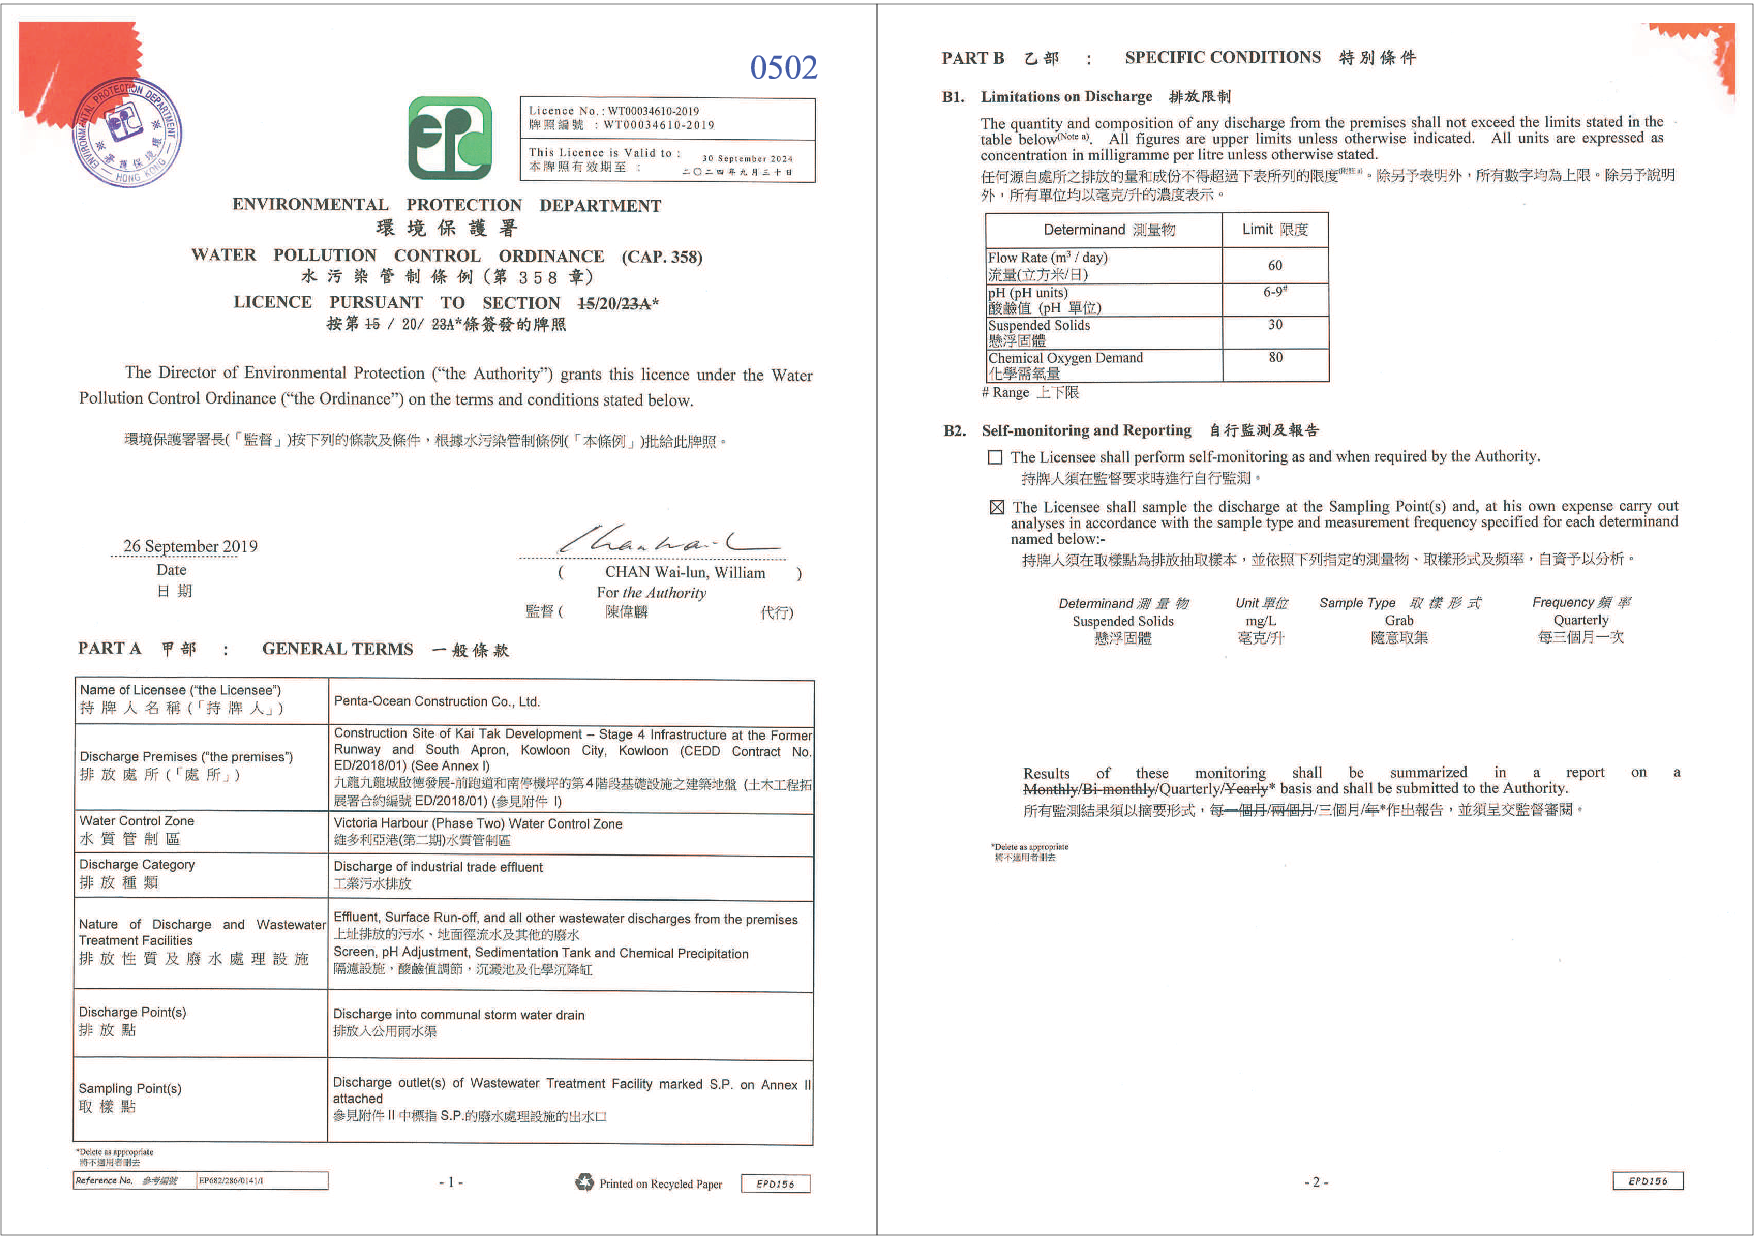
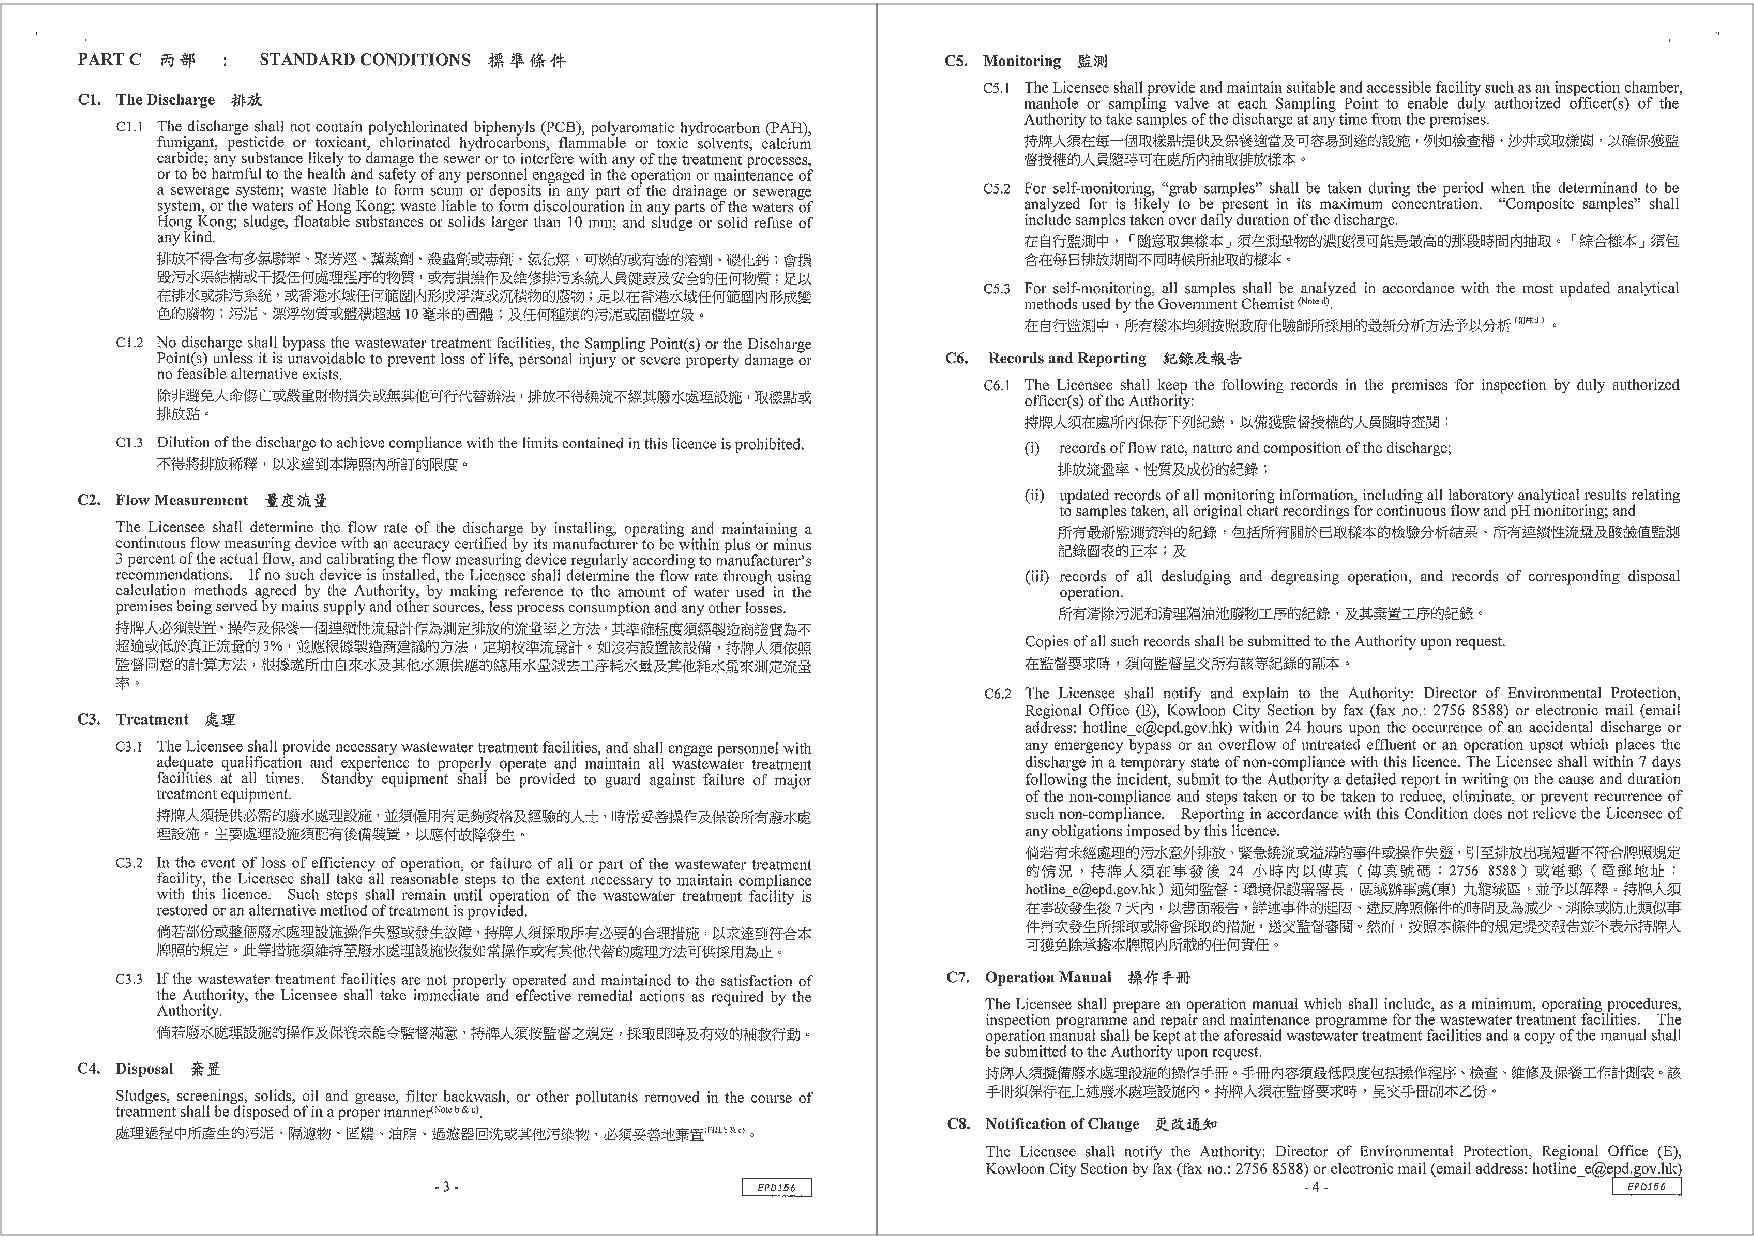
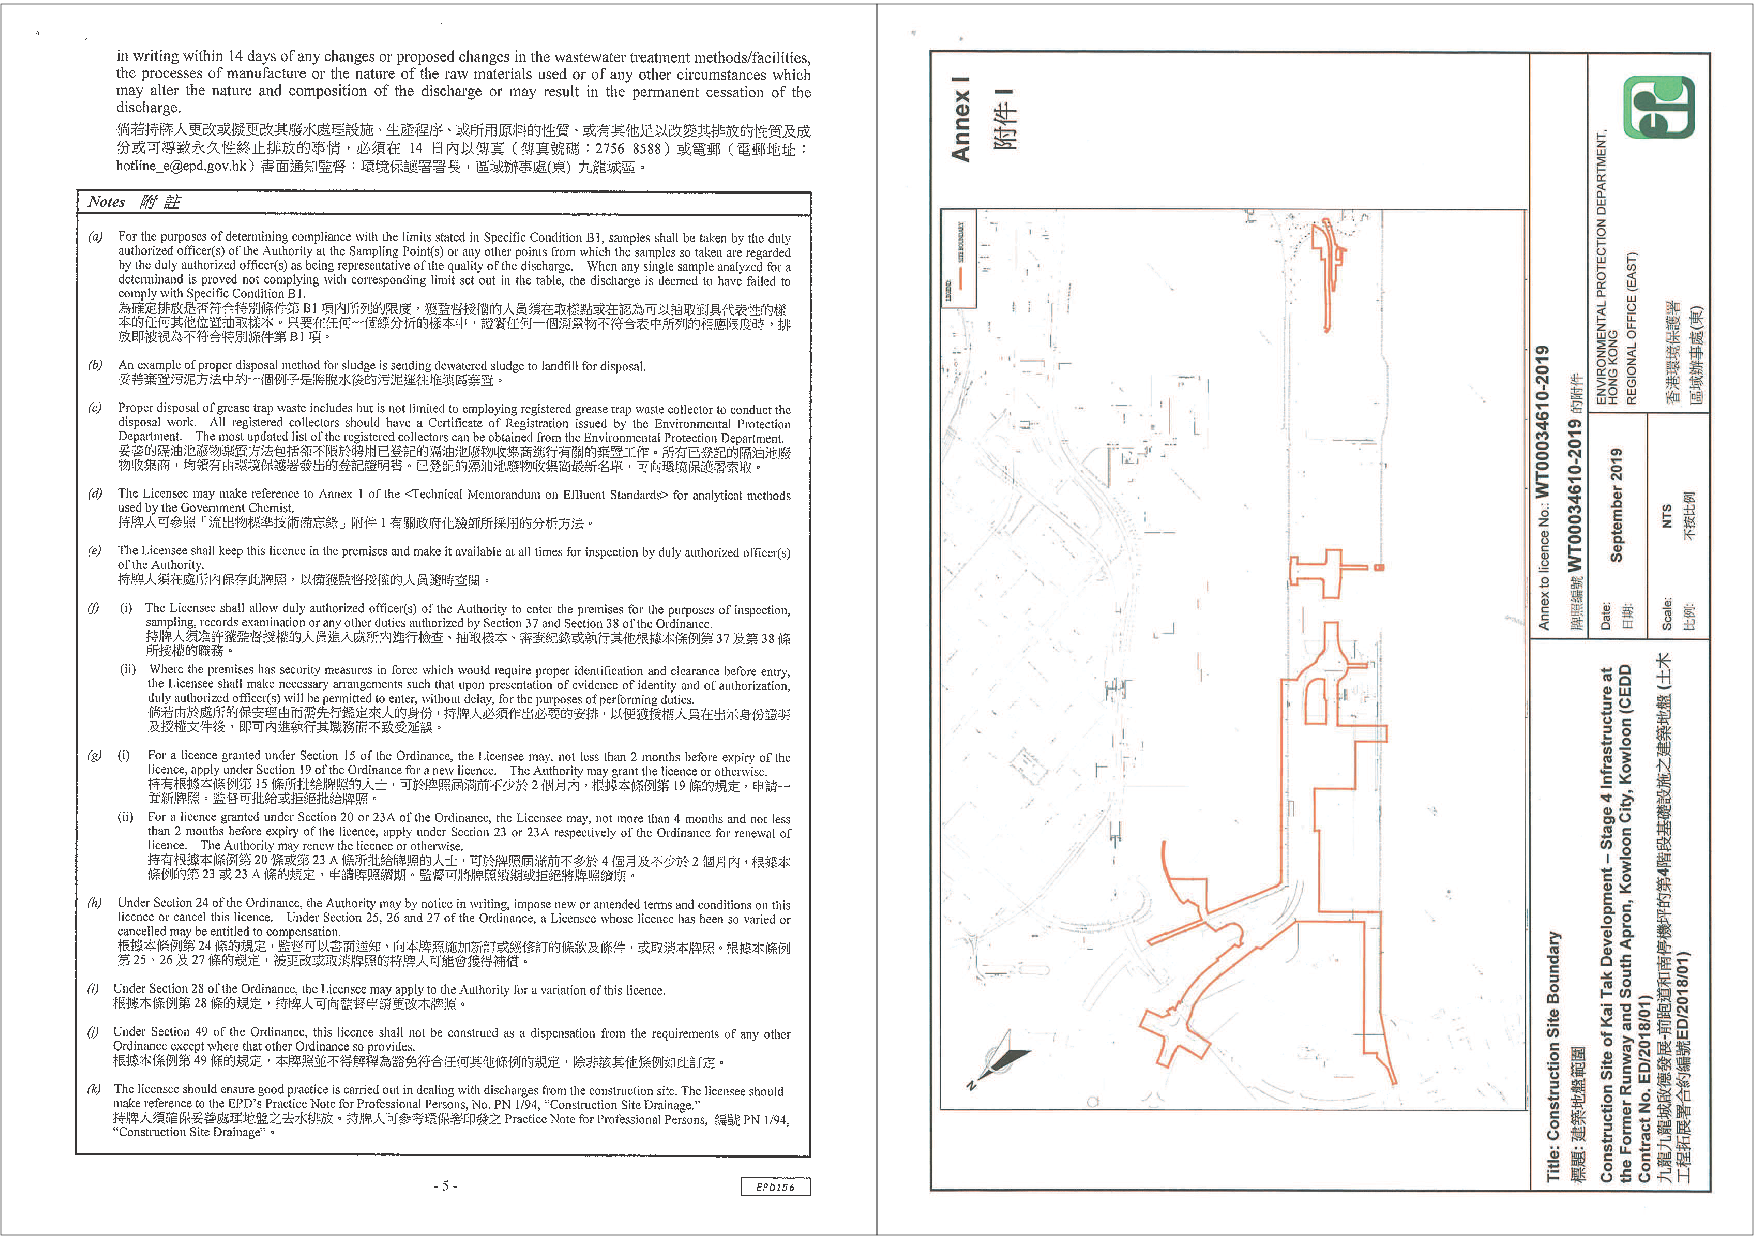
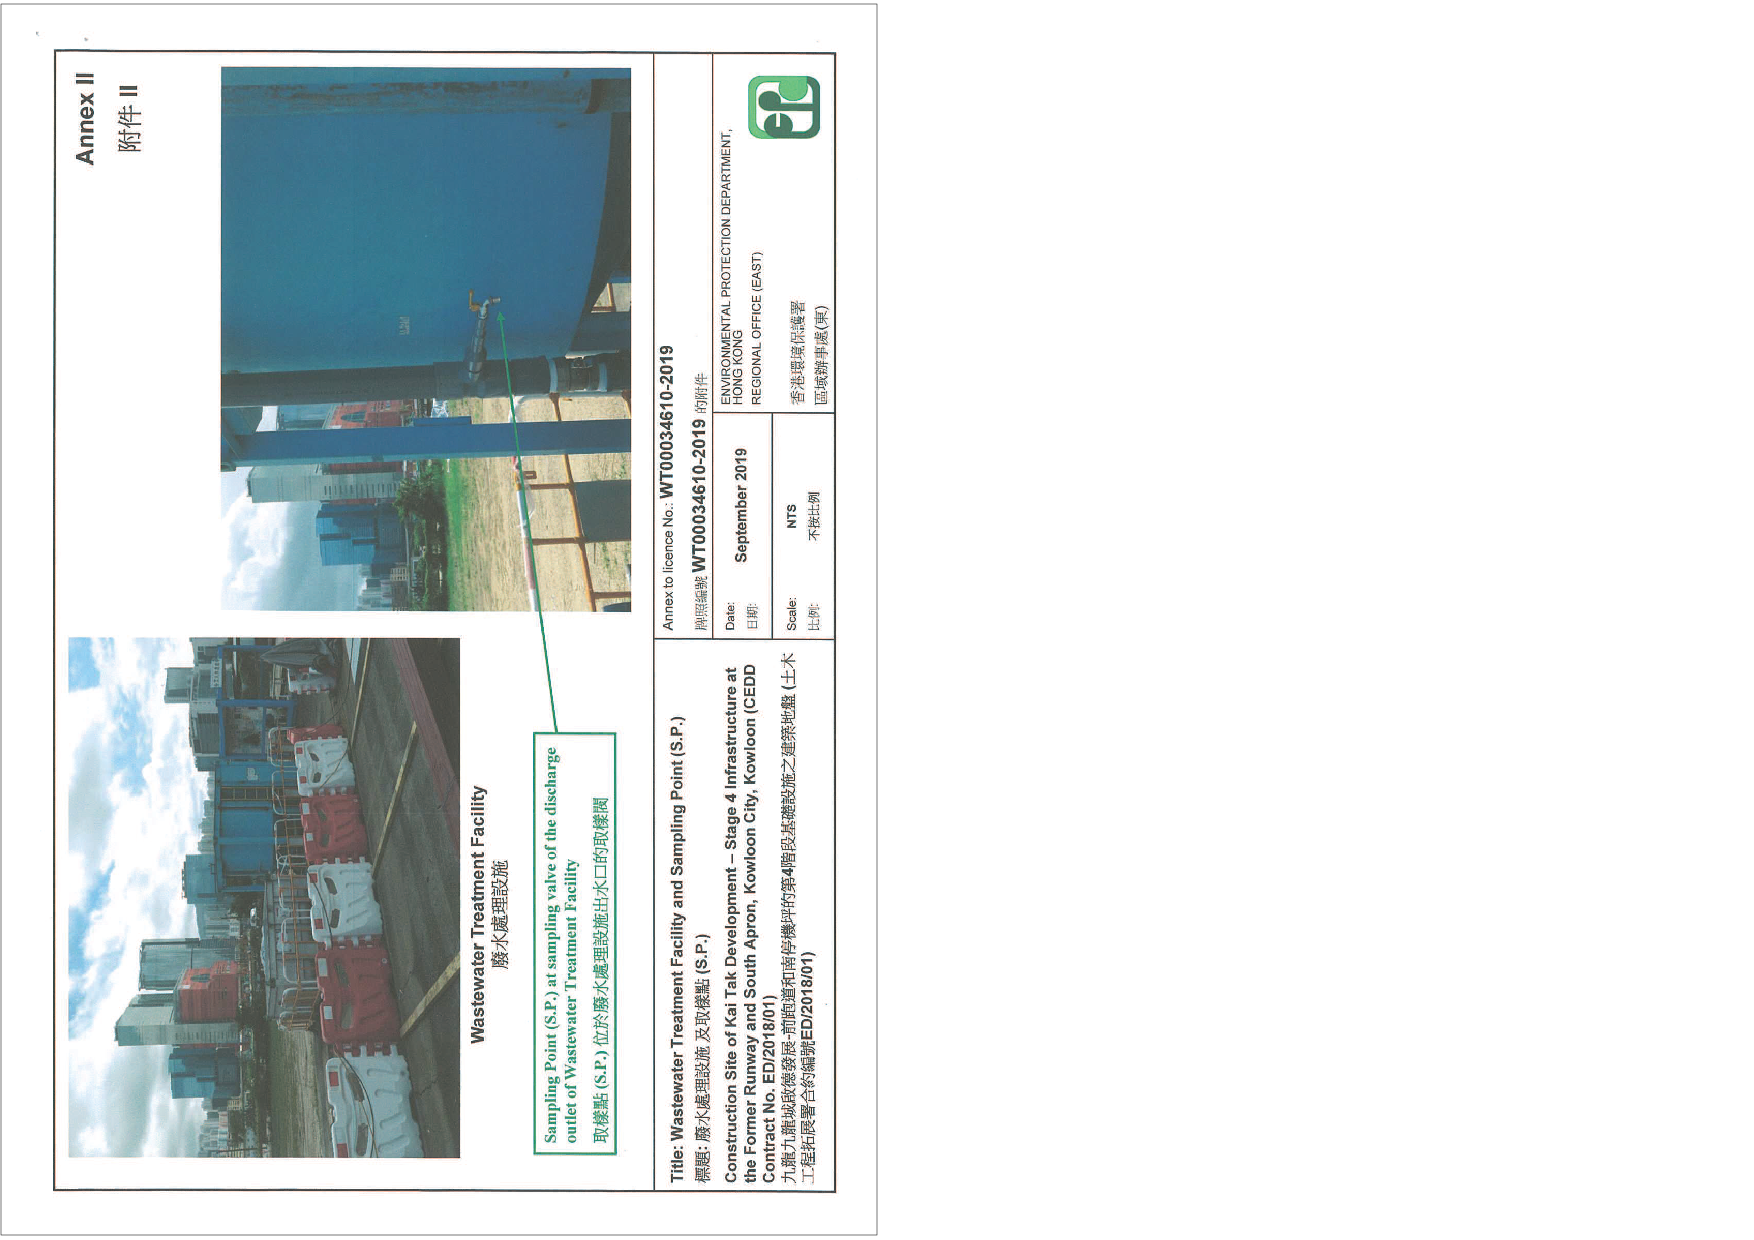
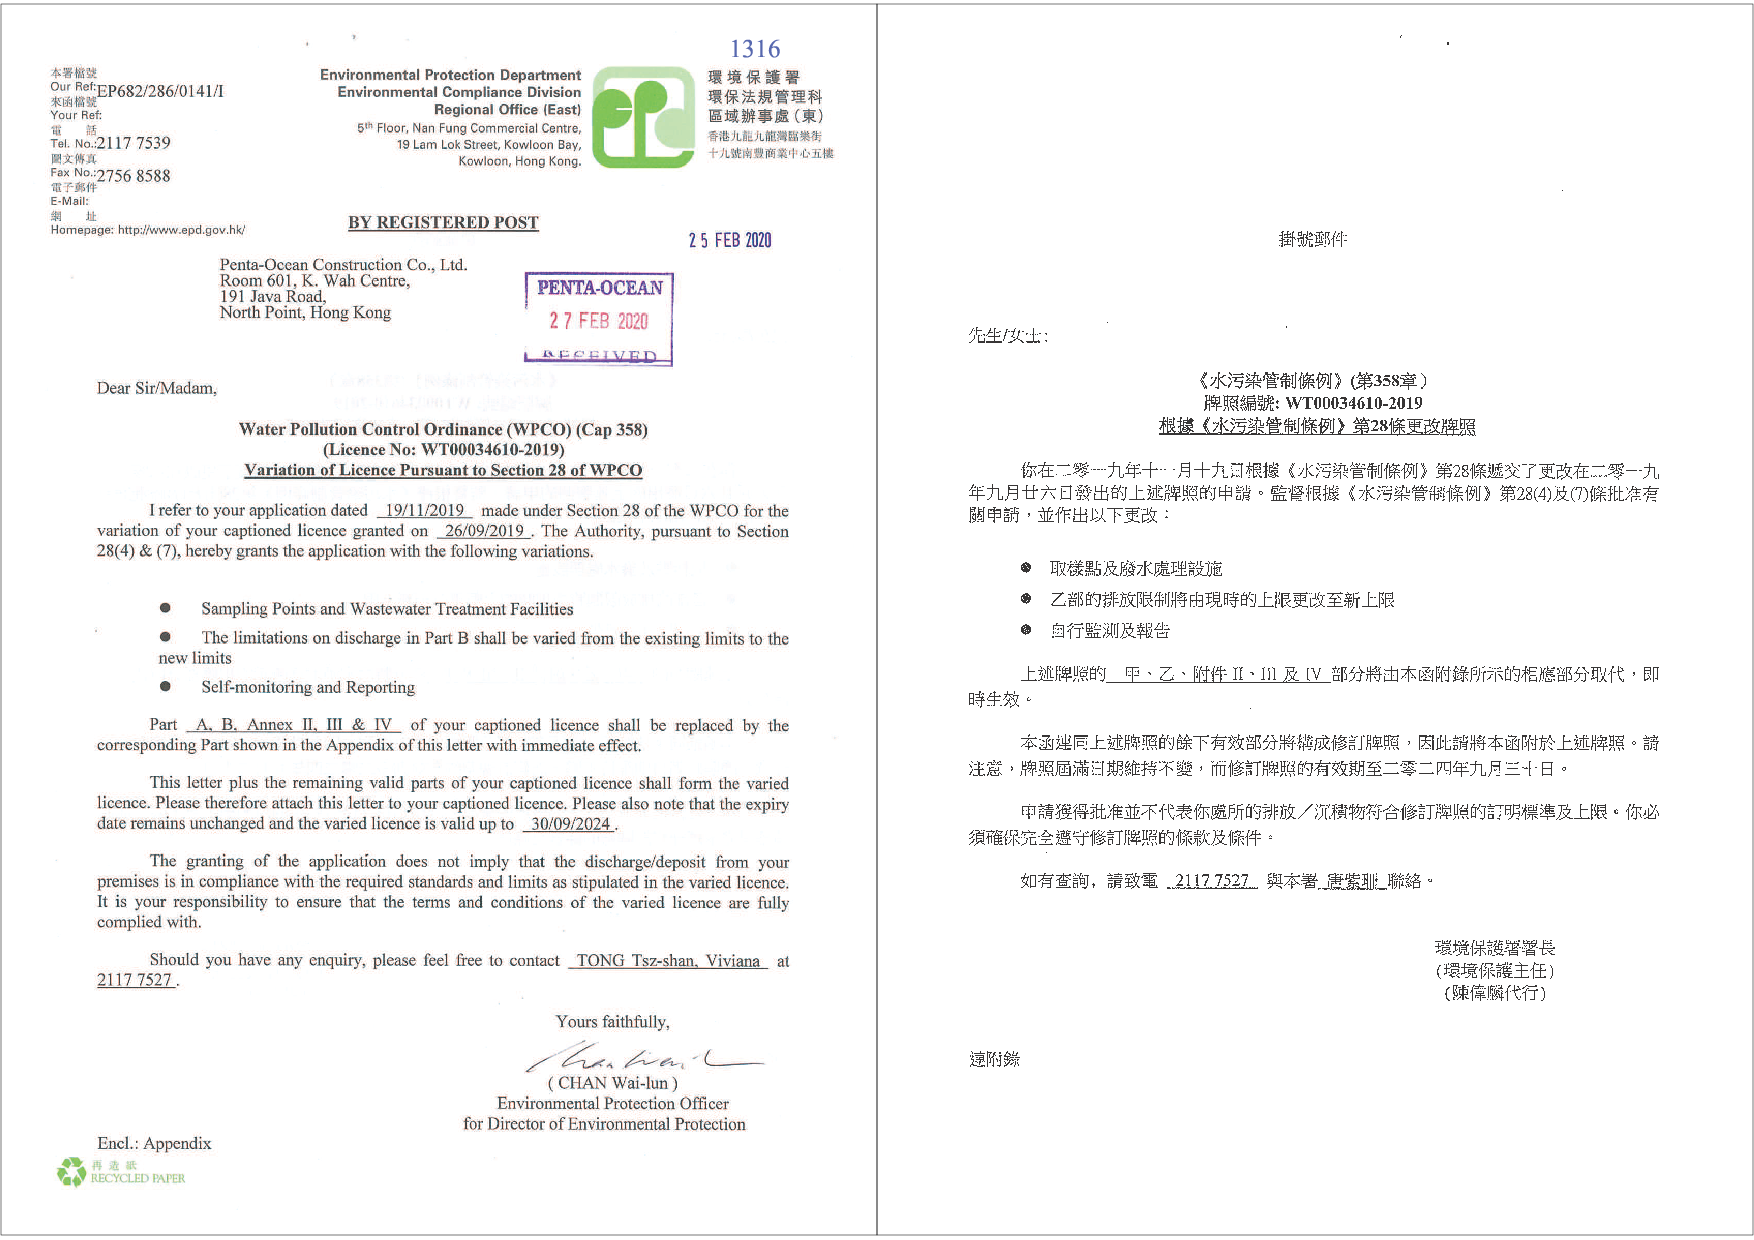
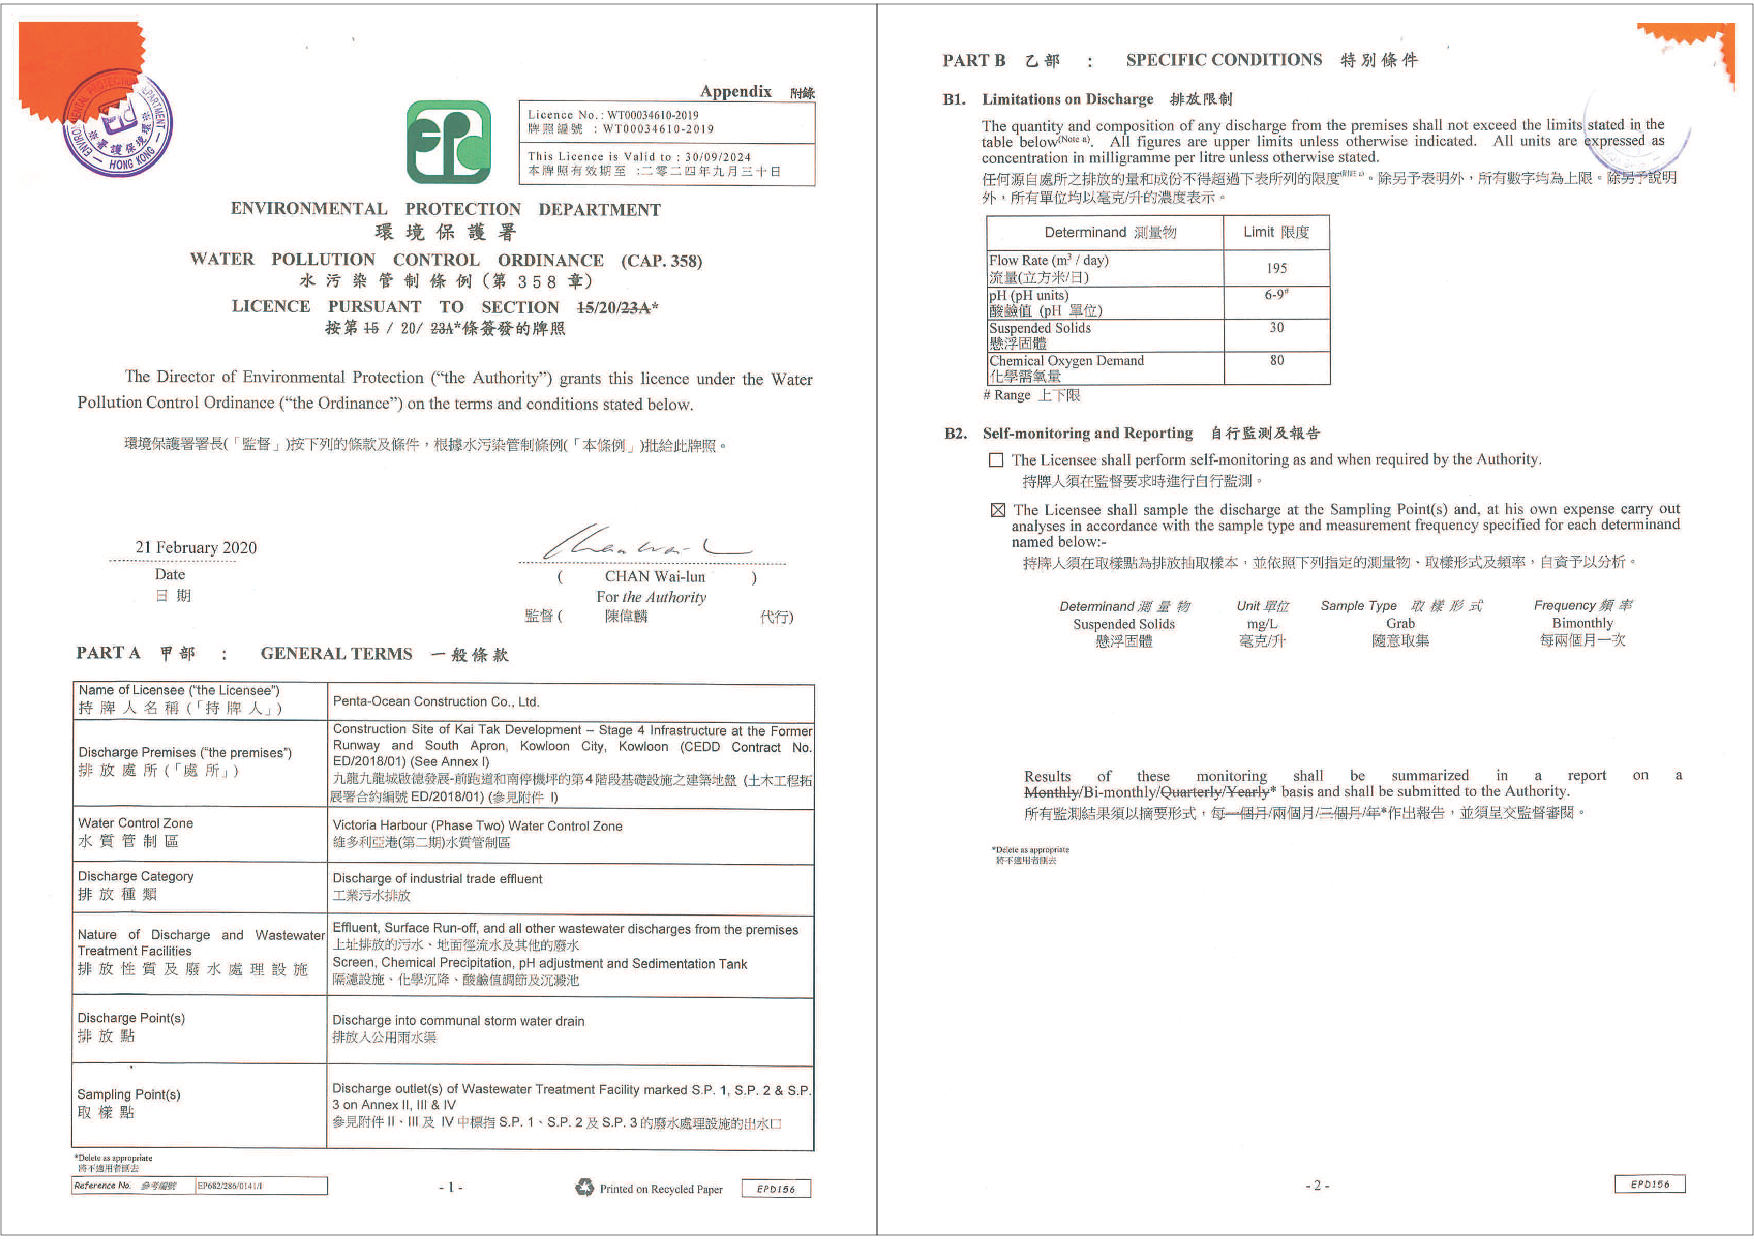
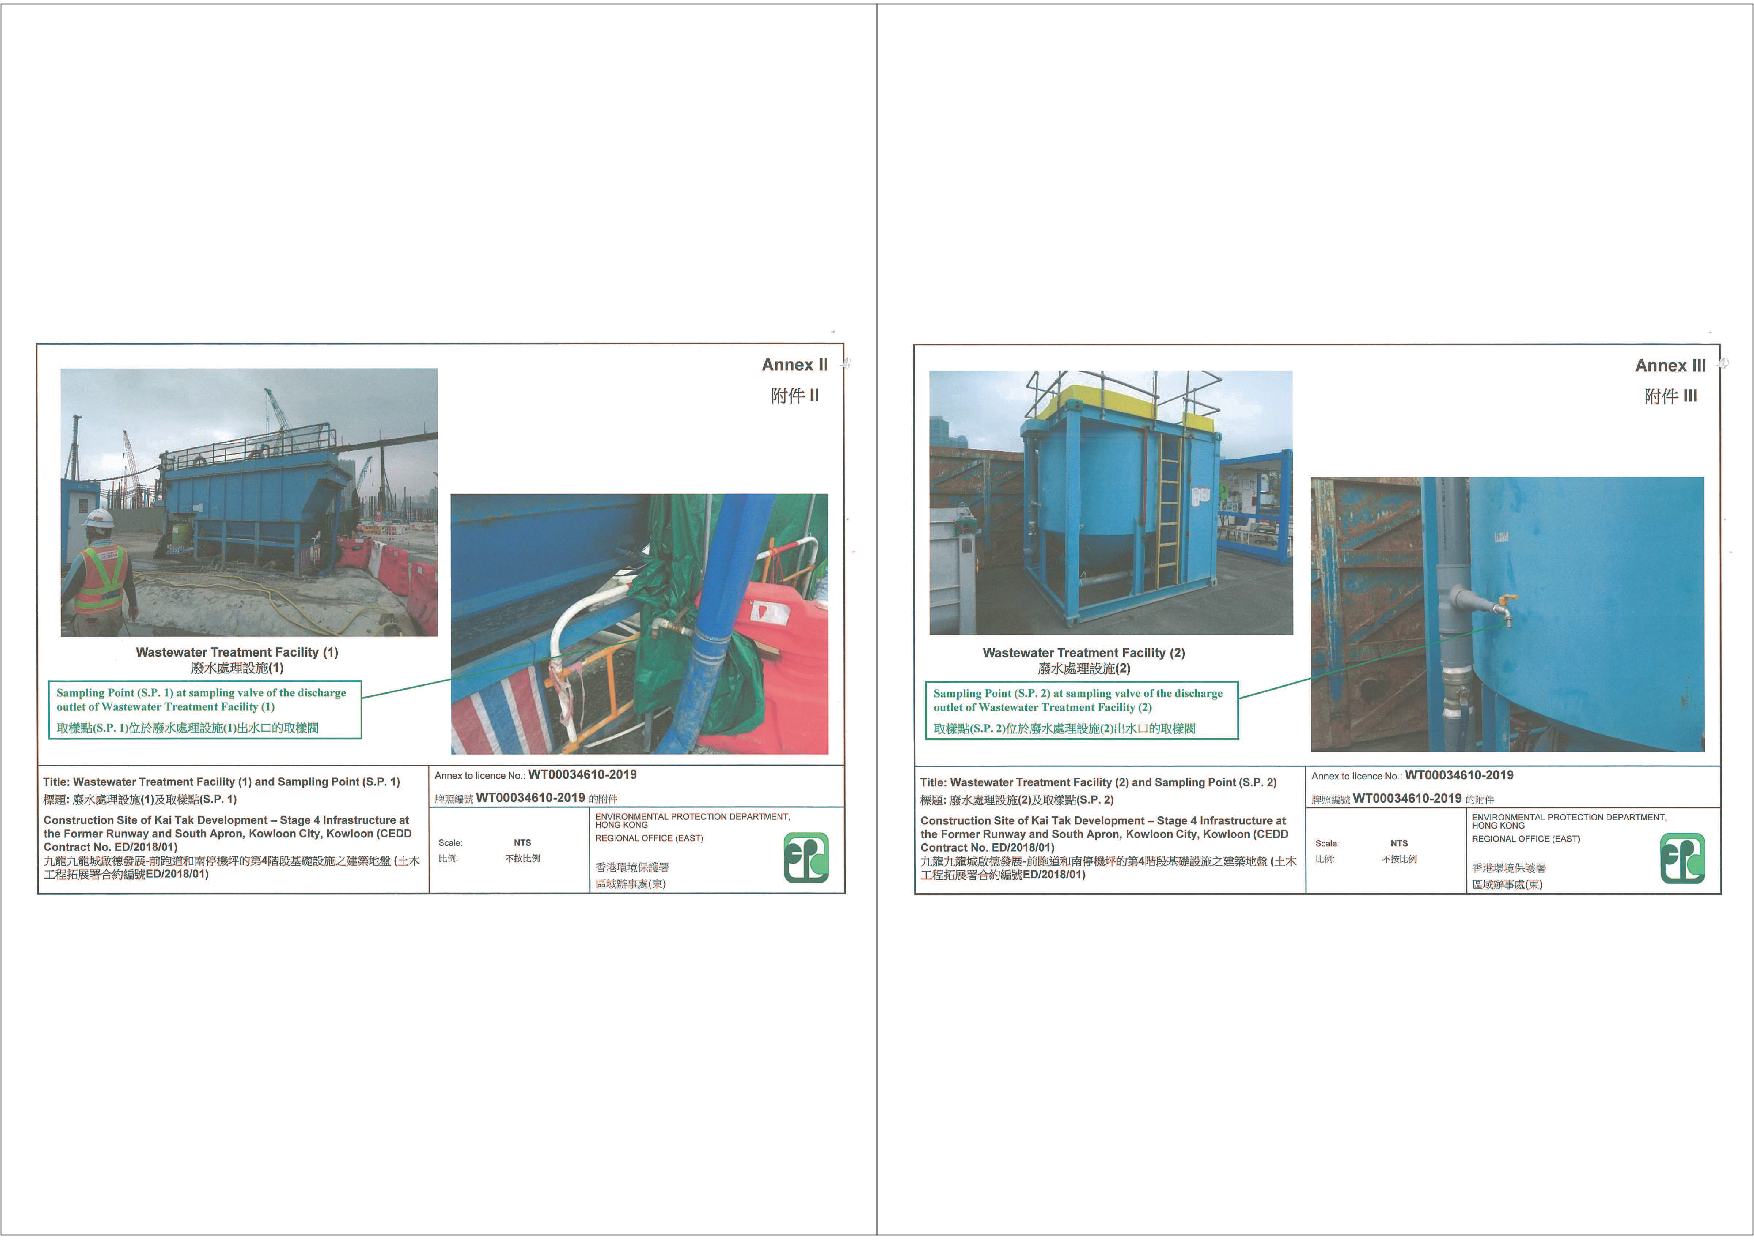
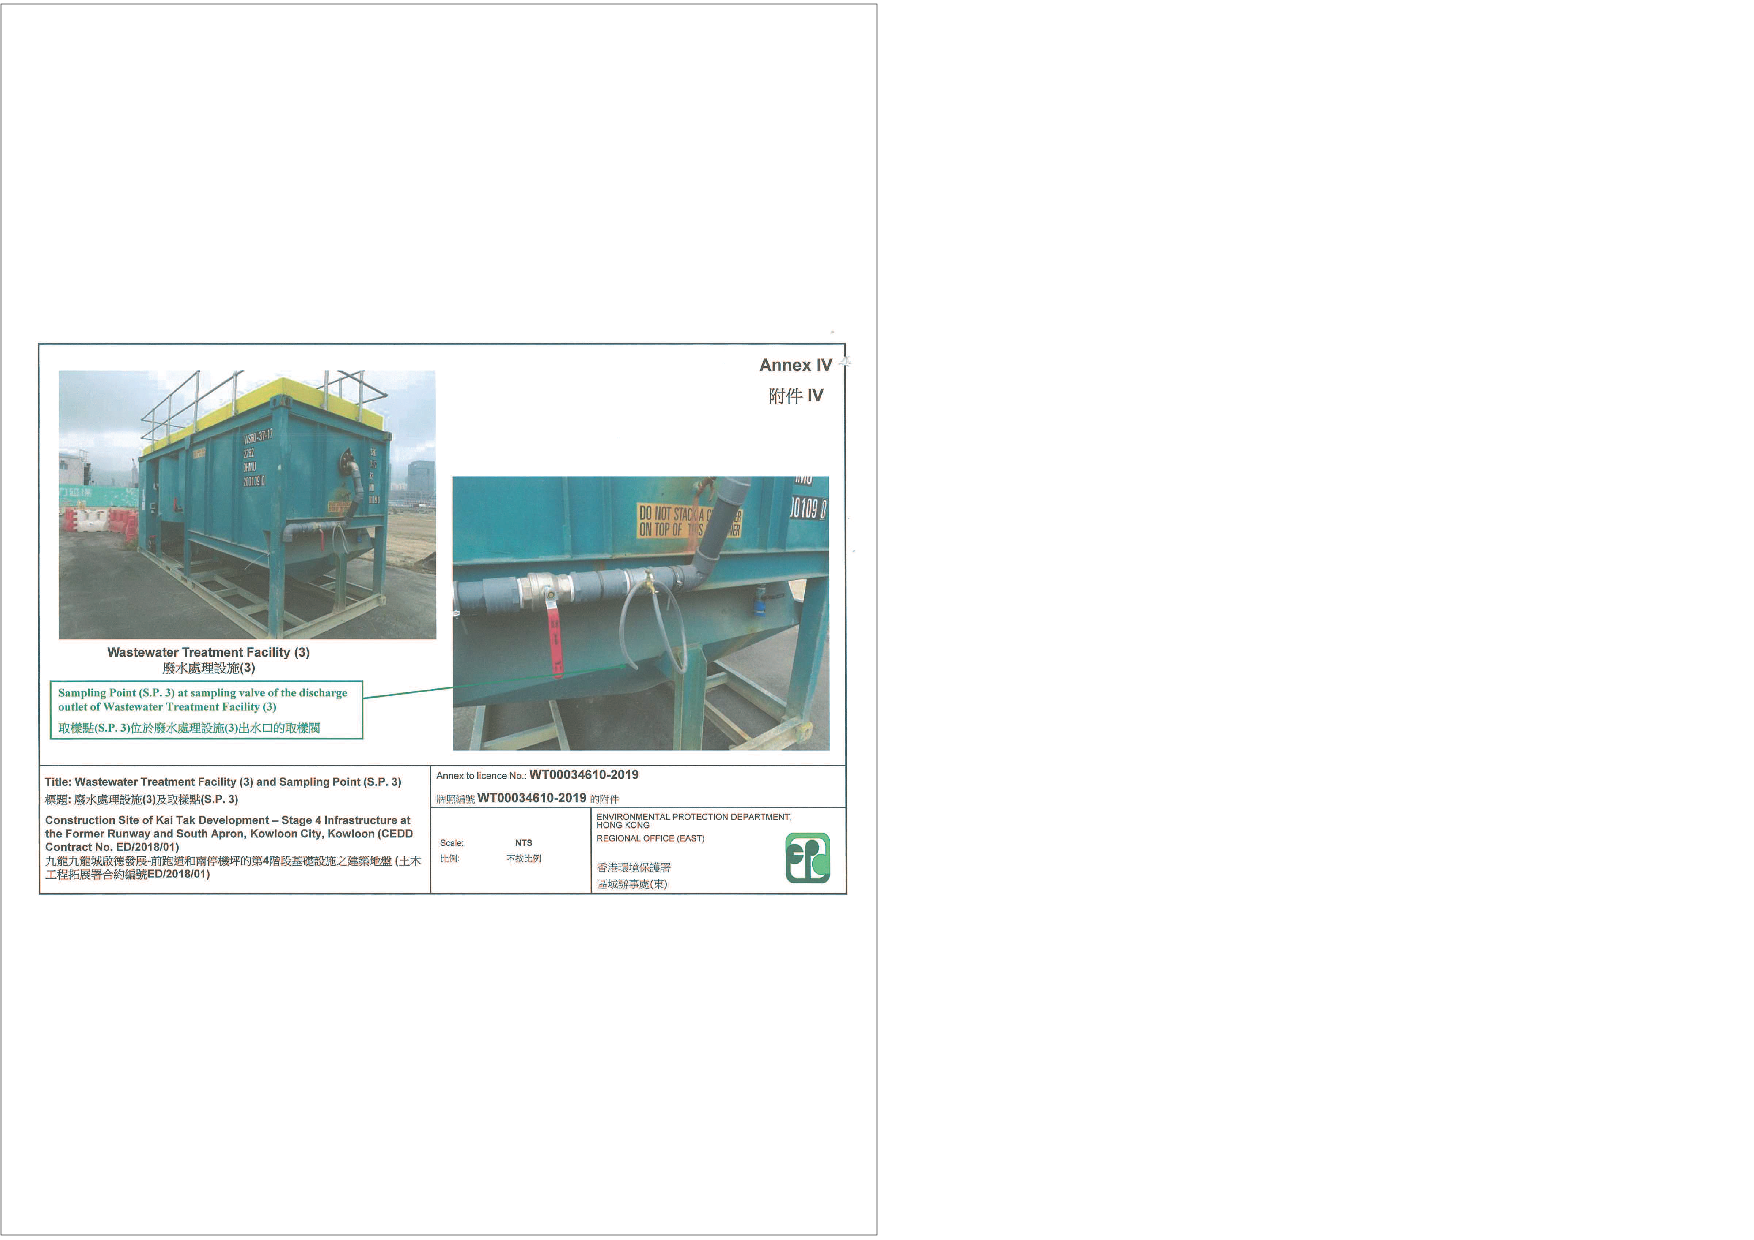
Wastewater Discharge License under WPCO |
WT00034610-2019 |
26 Sep 2019 |
30 Sep 2024 |
|
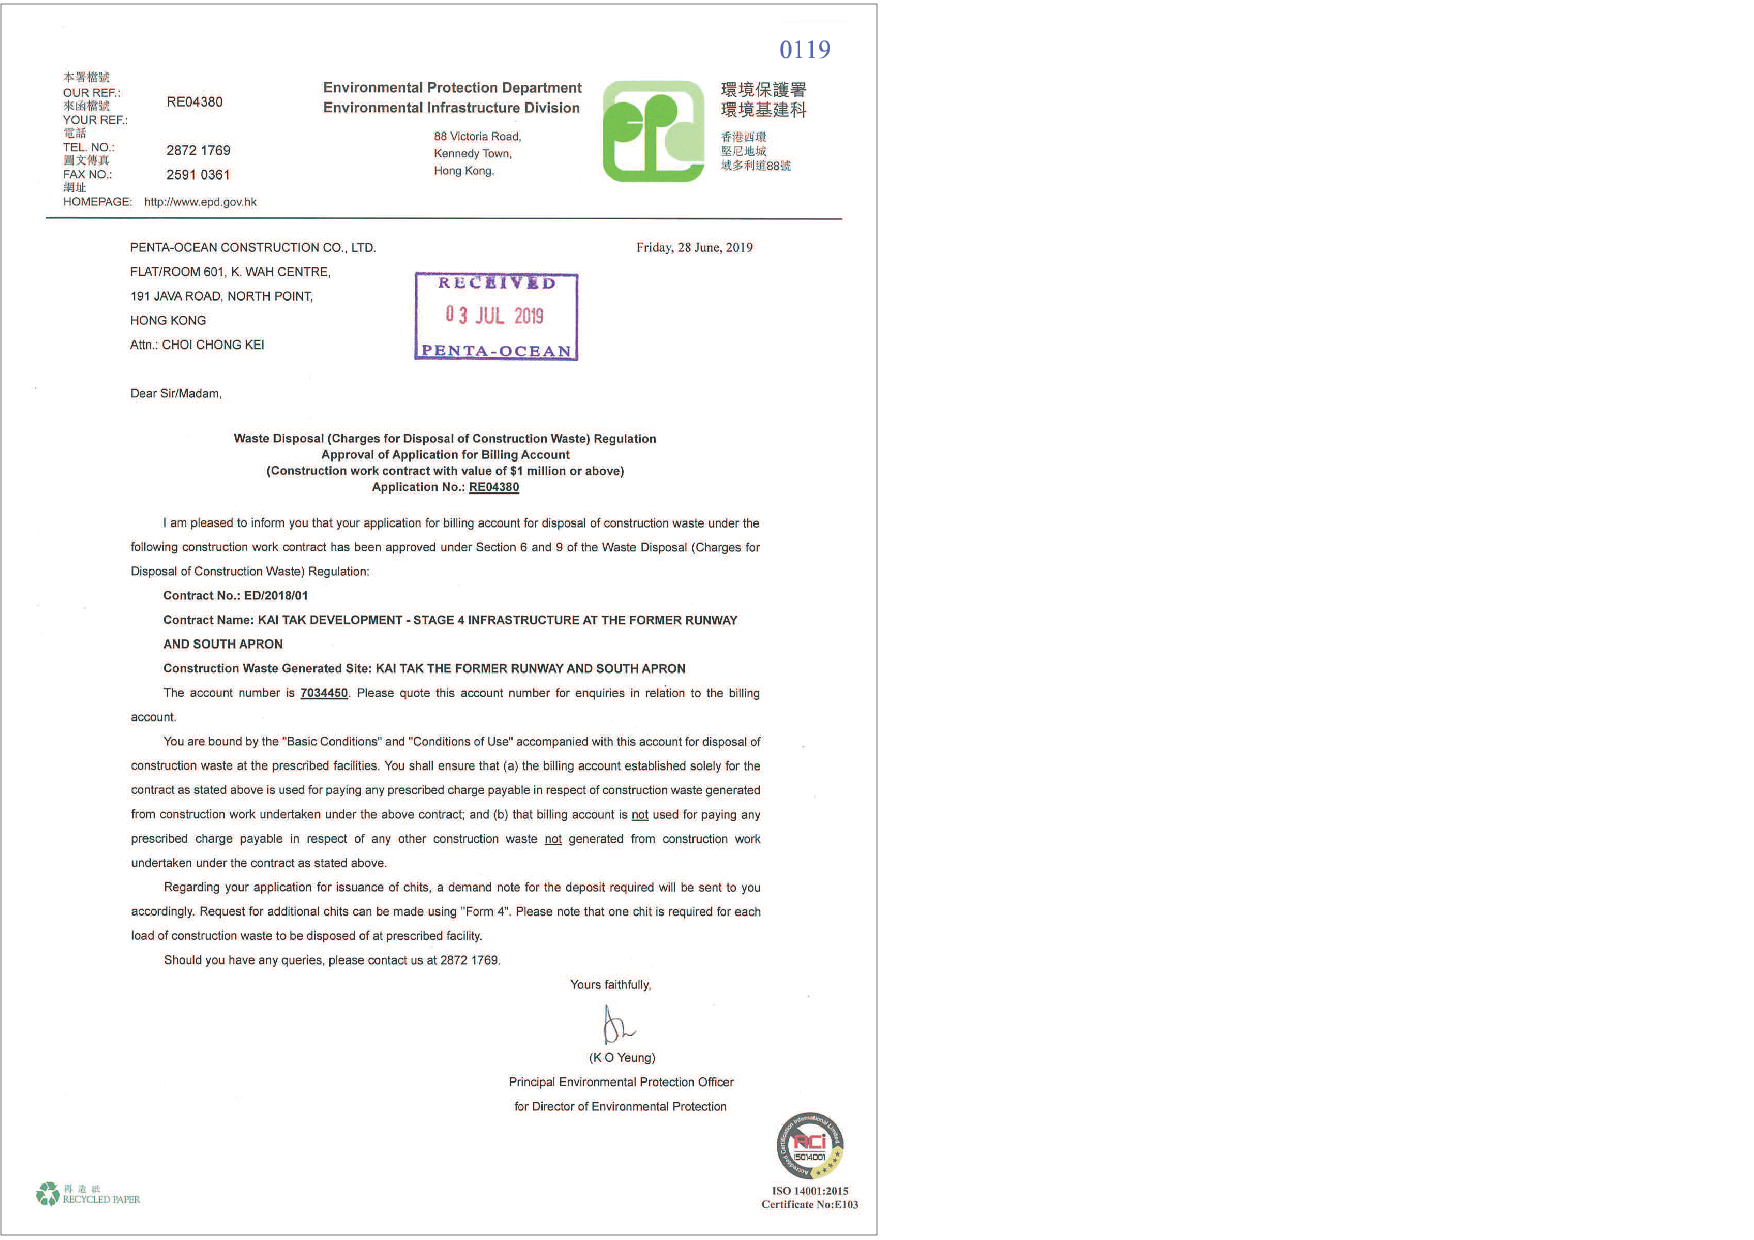
Waste Disposal Billing Account |
7034450 |
28 Jun 2019 |
N/A |
|
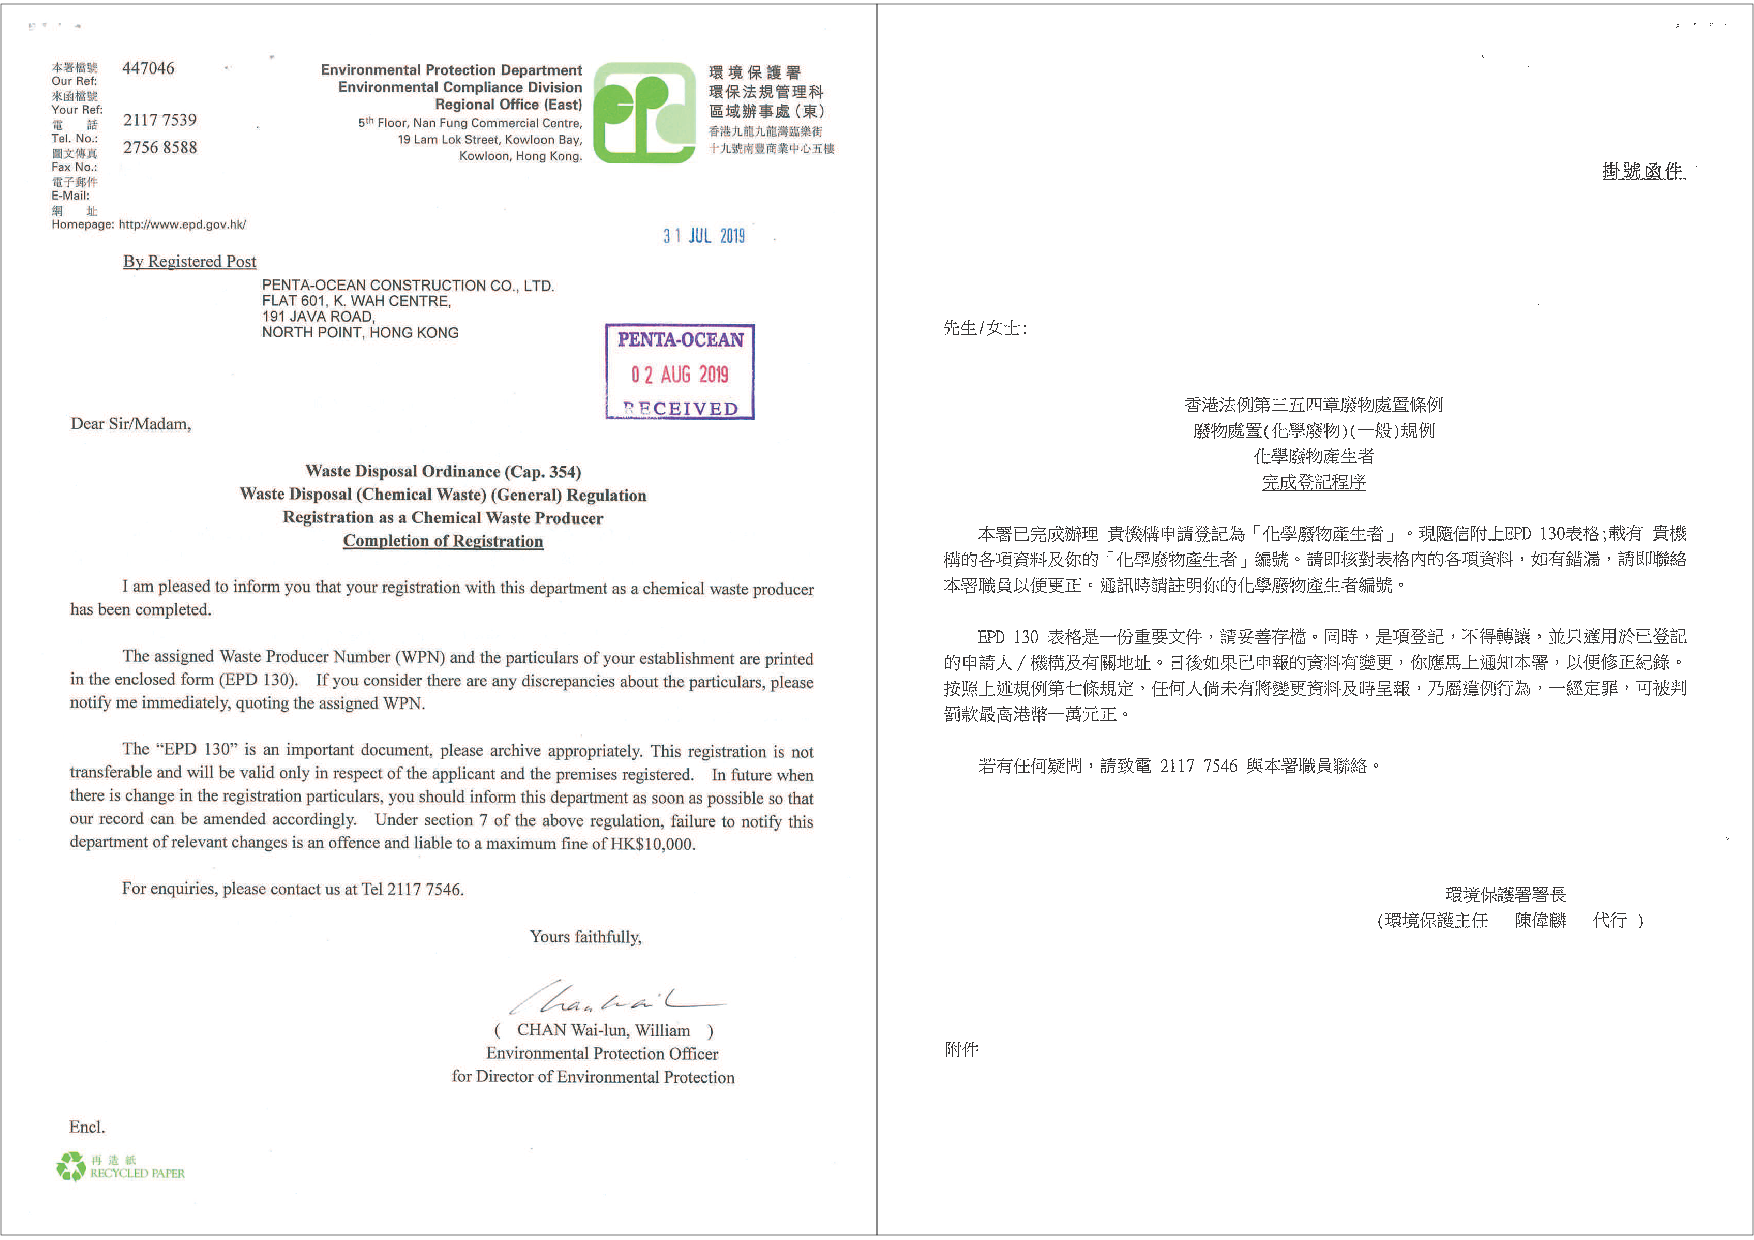
Registration as a Chemical Waste Producer |
5218-286-P3182-03 |
18 Jul 2019 |
N/A |
|
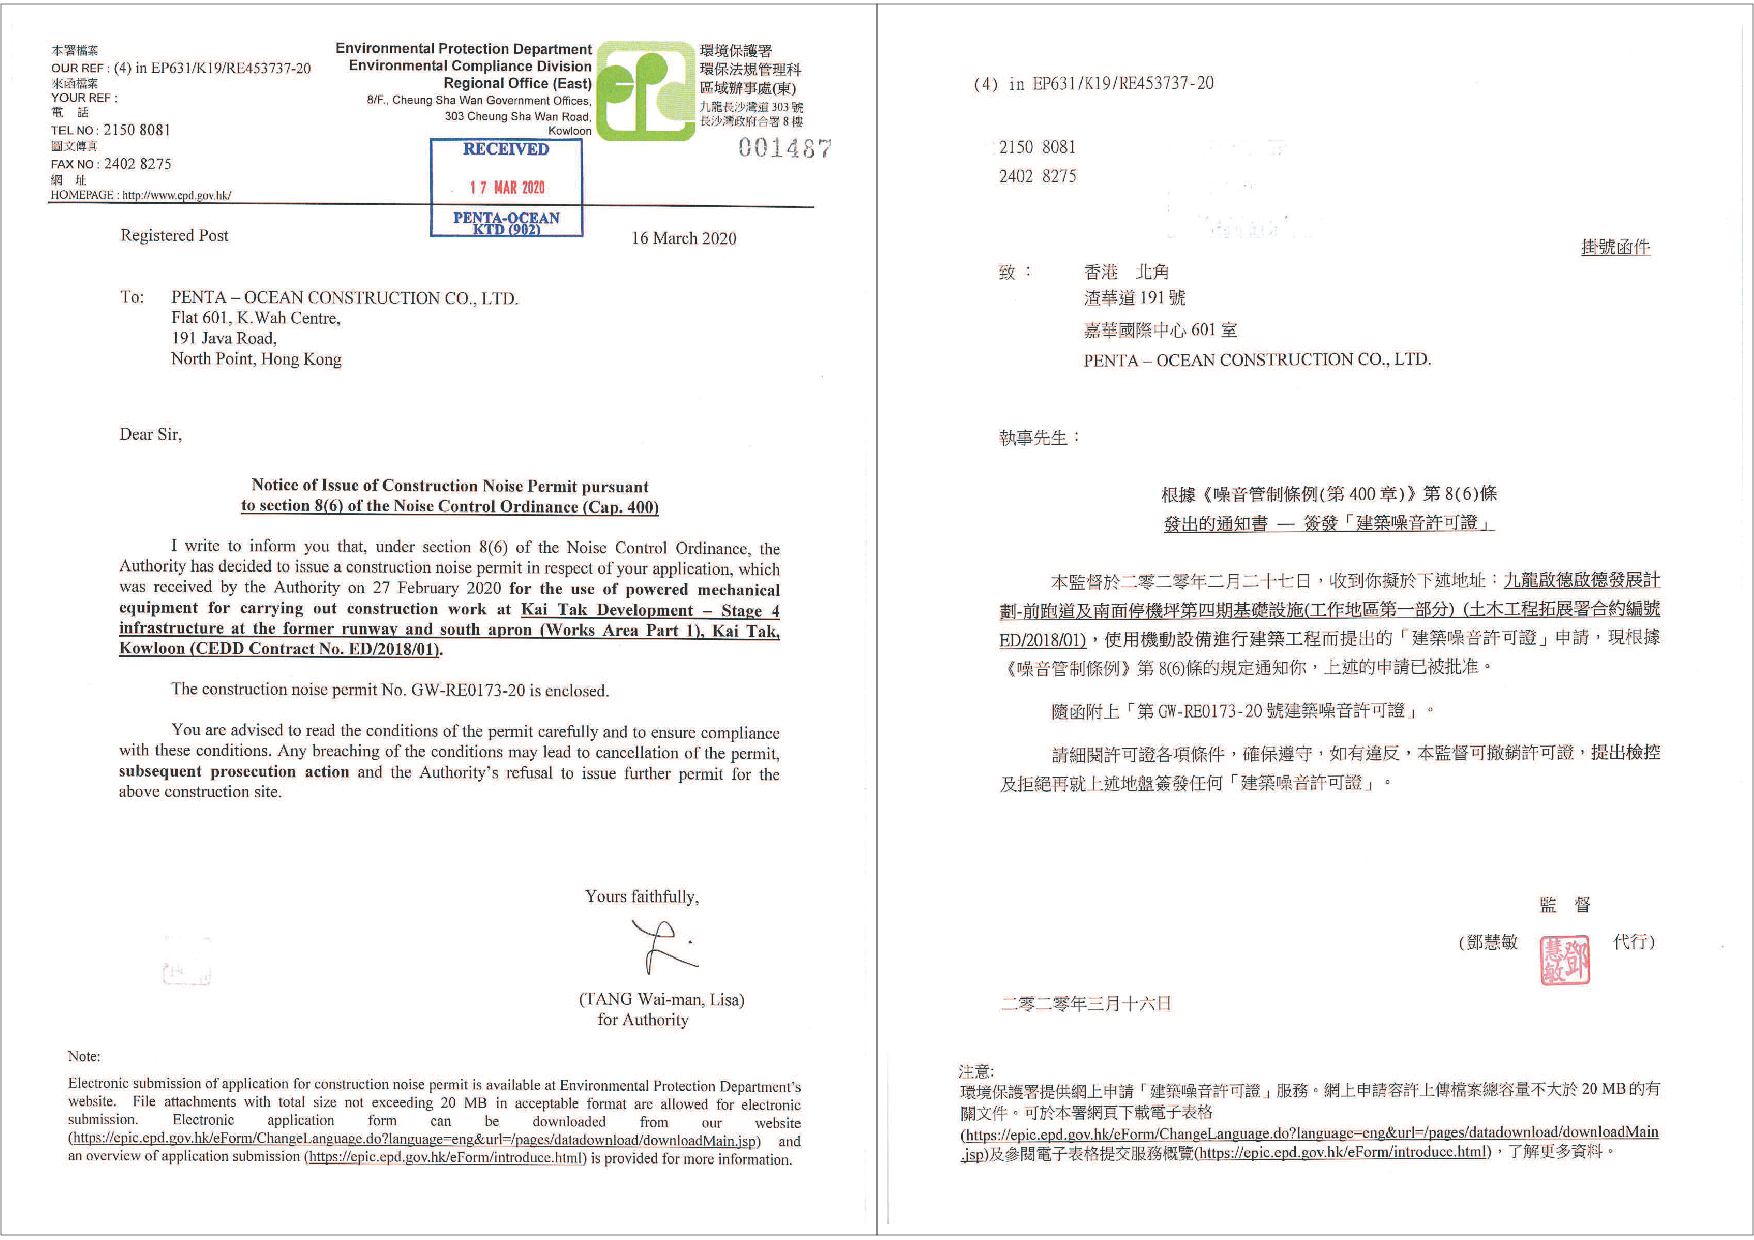
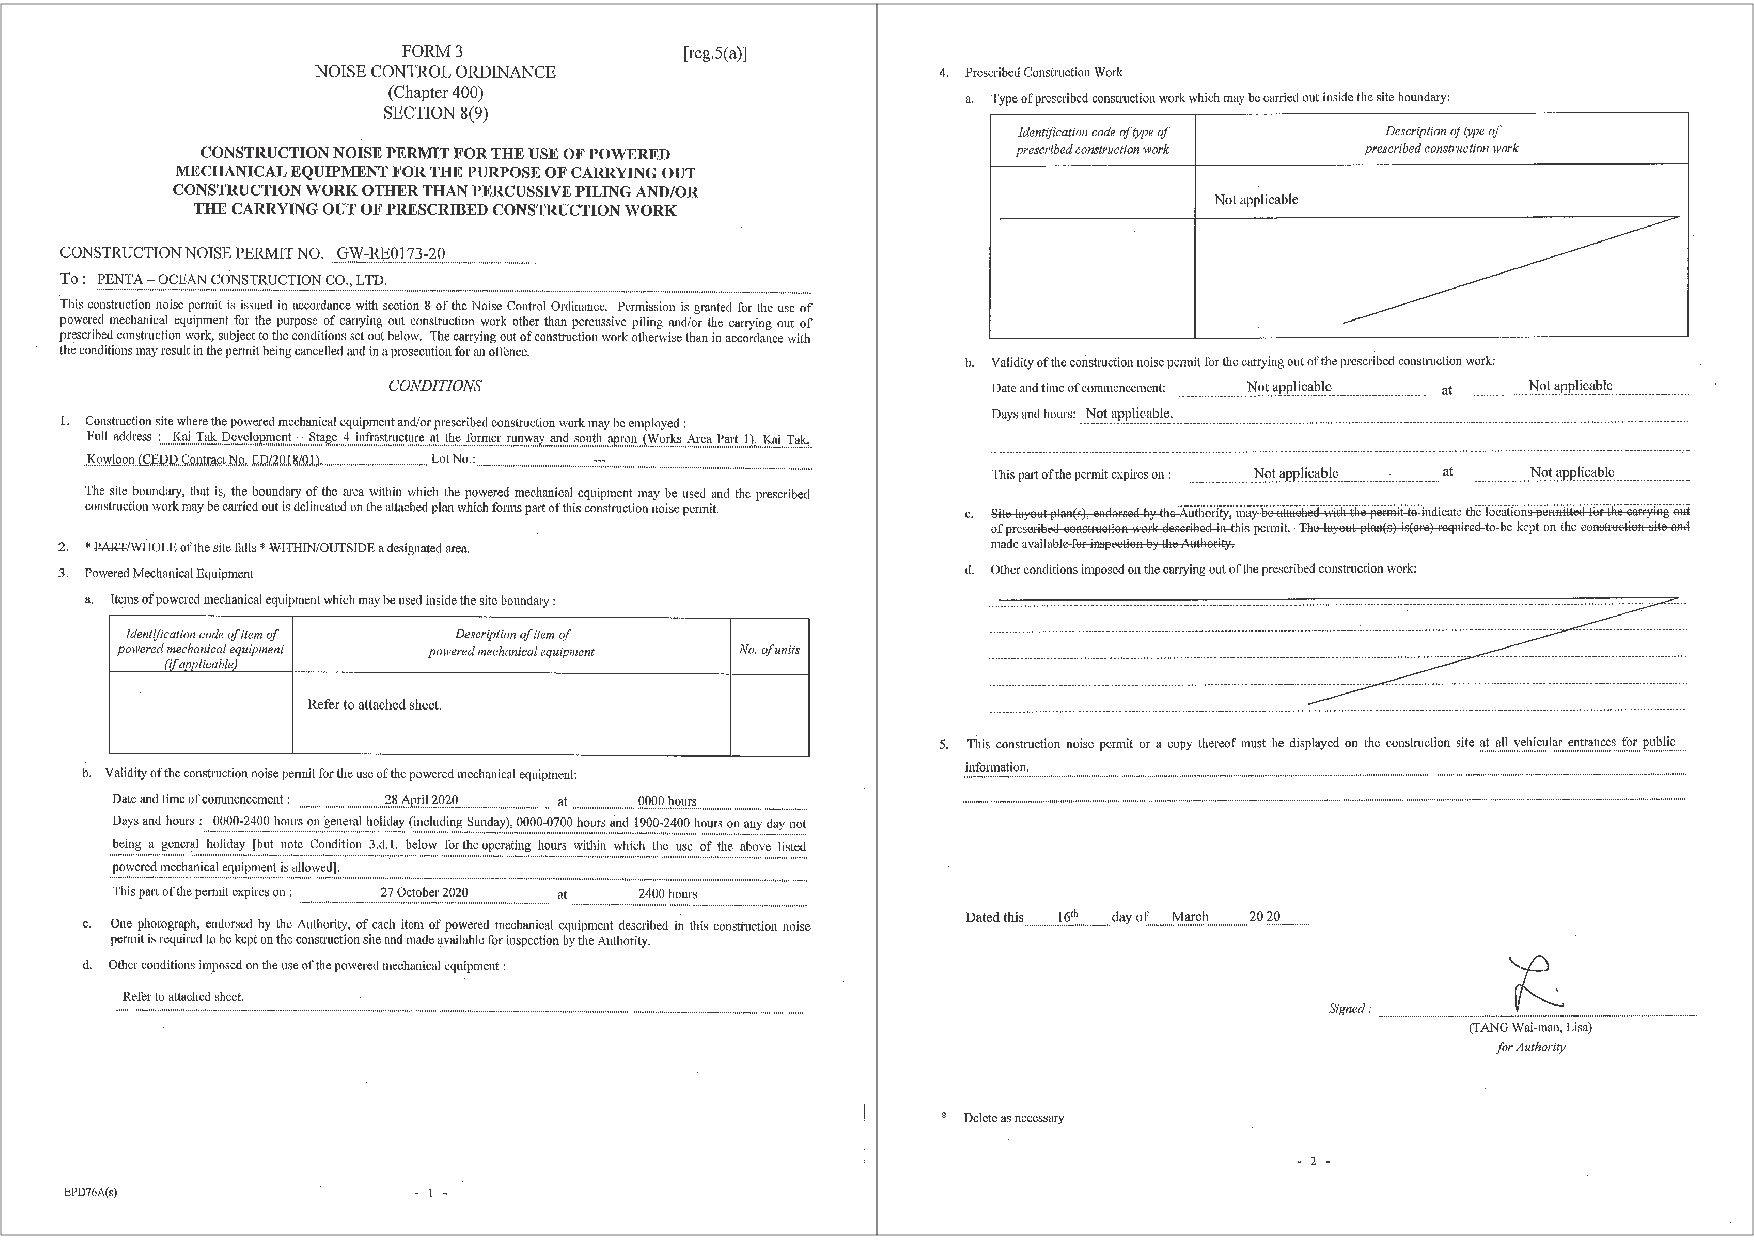
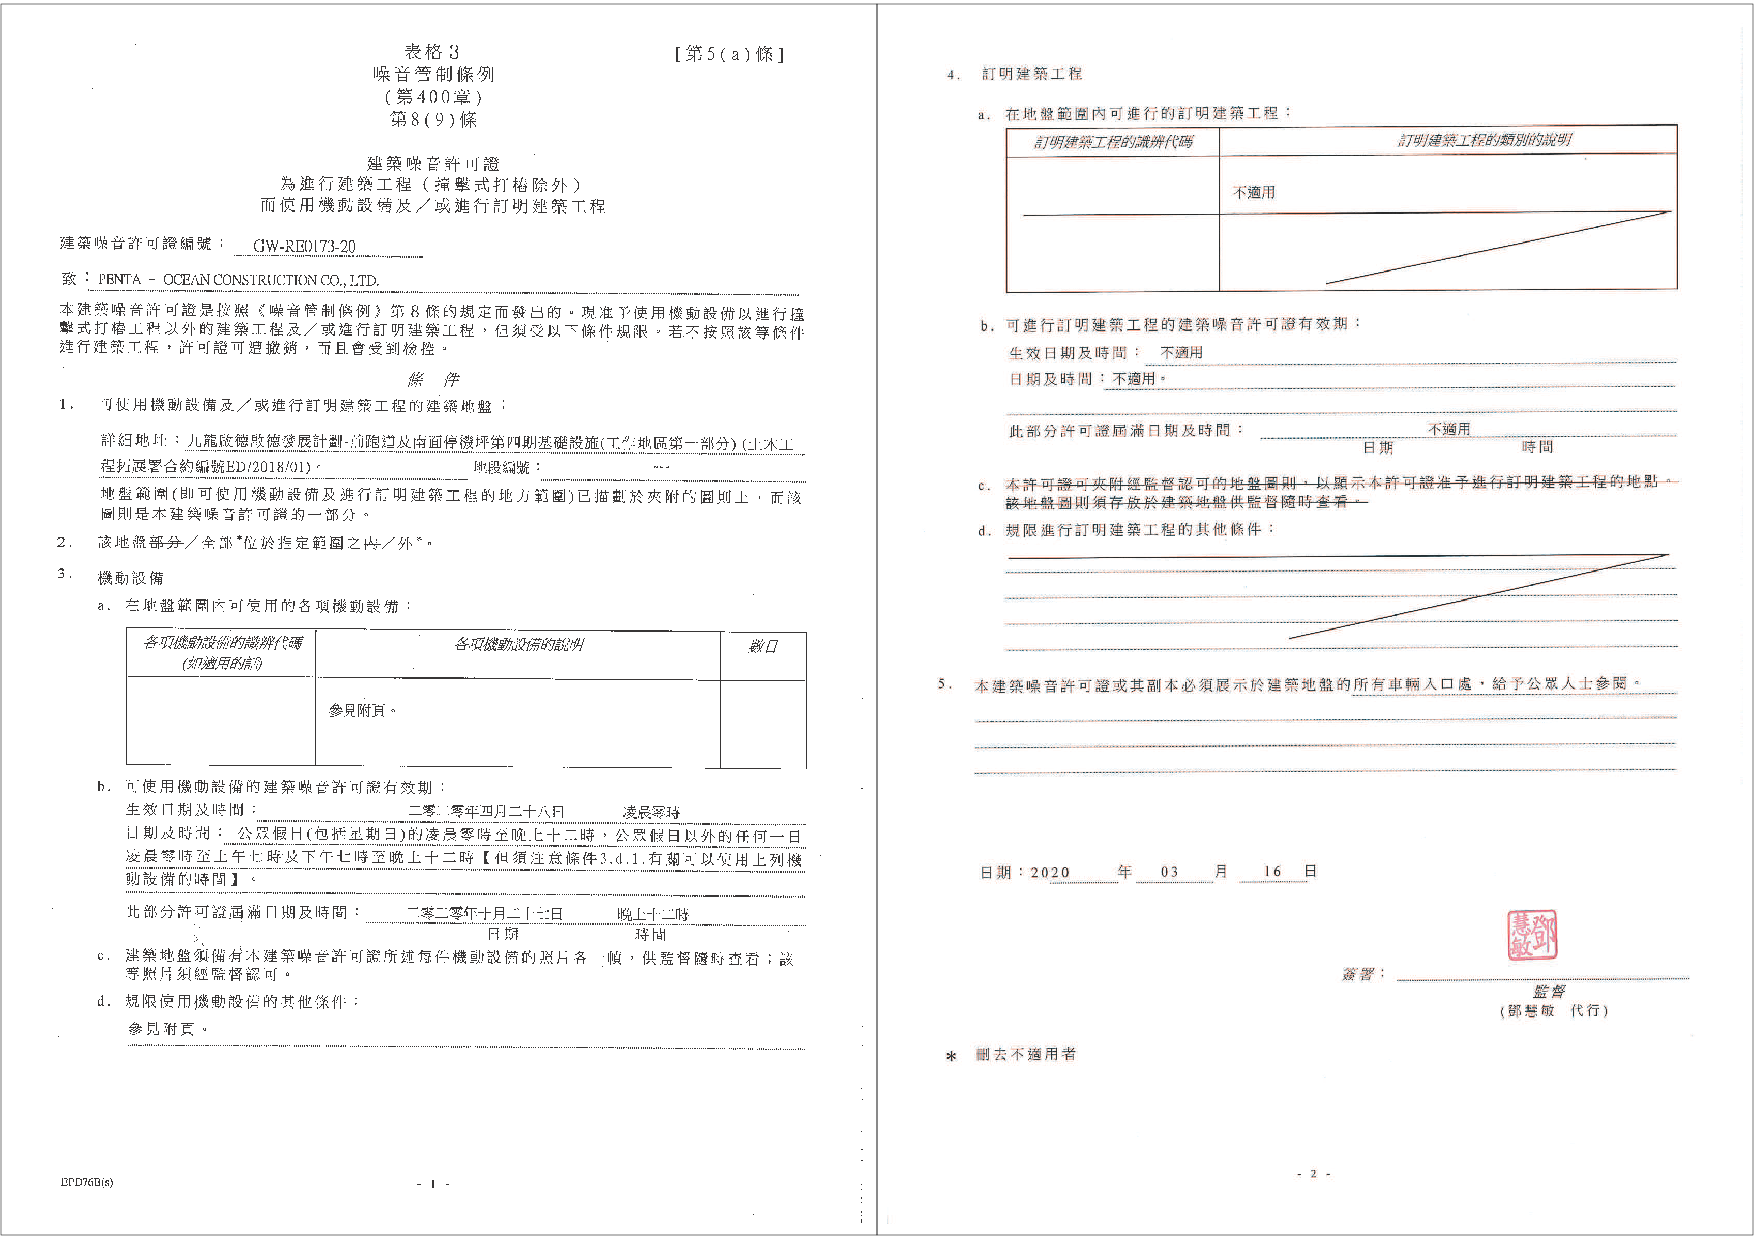
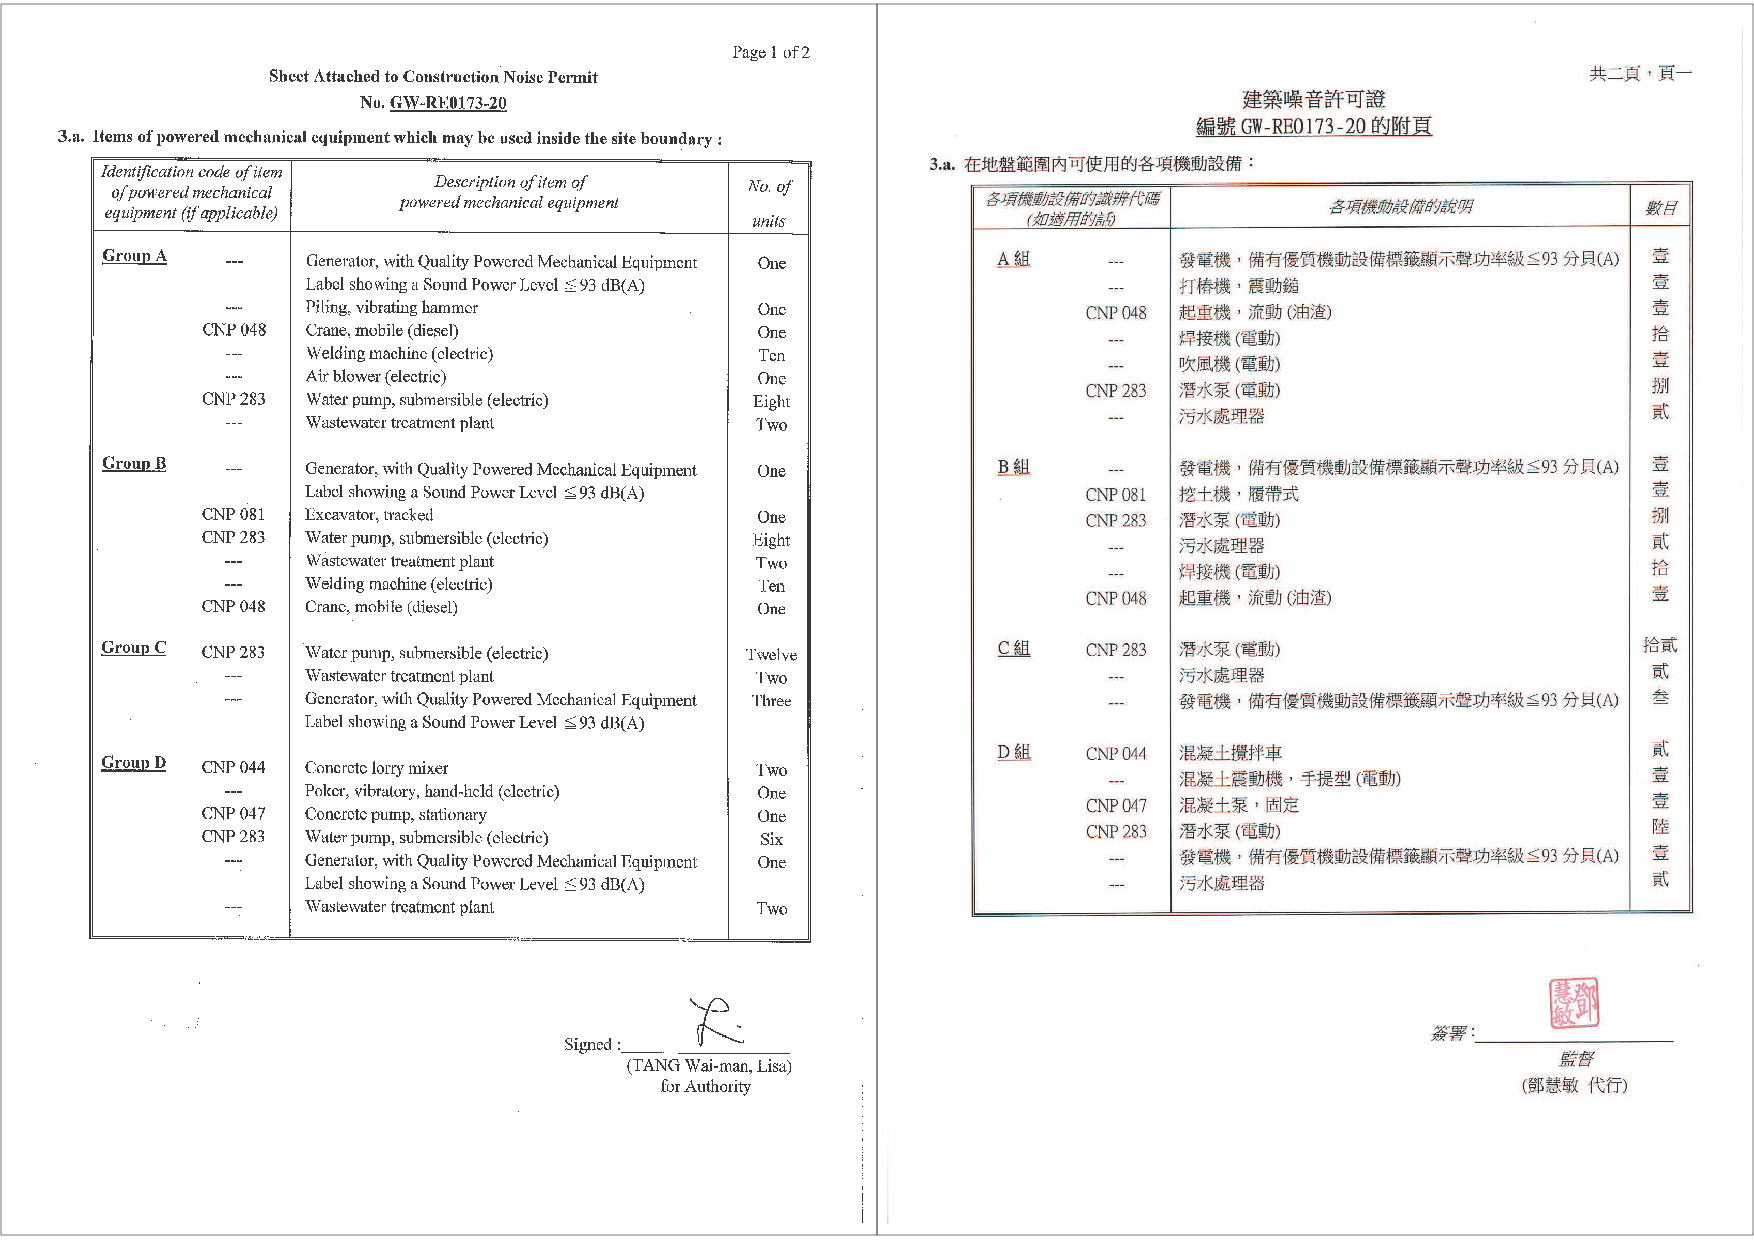
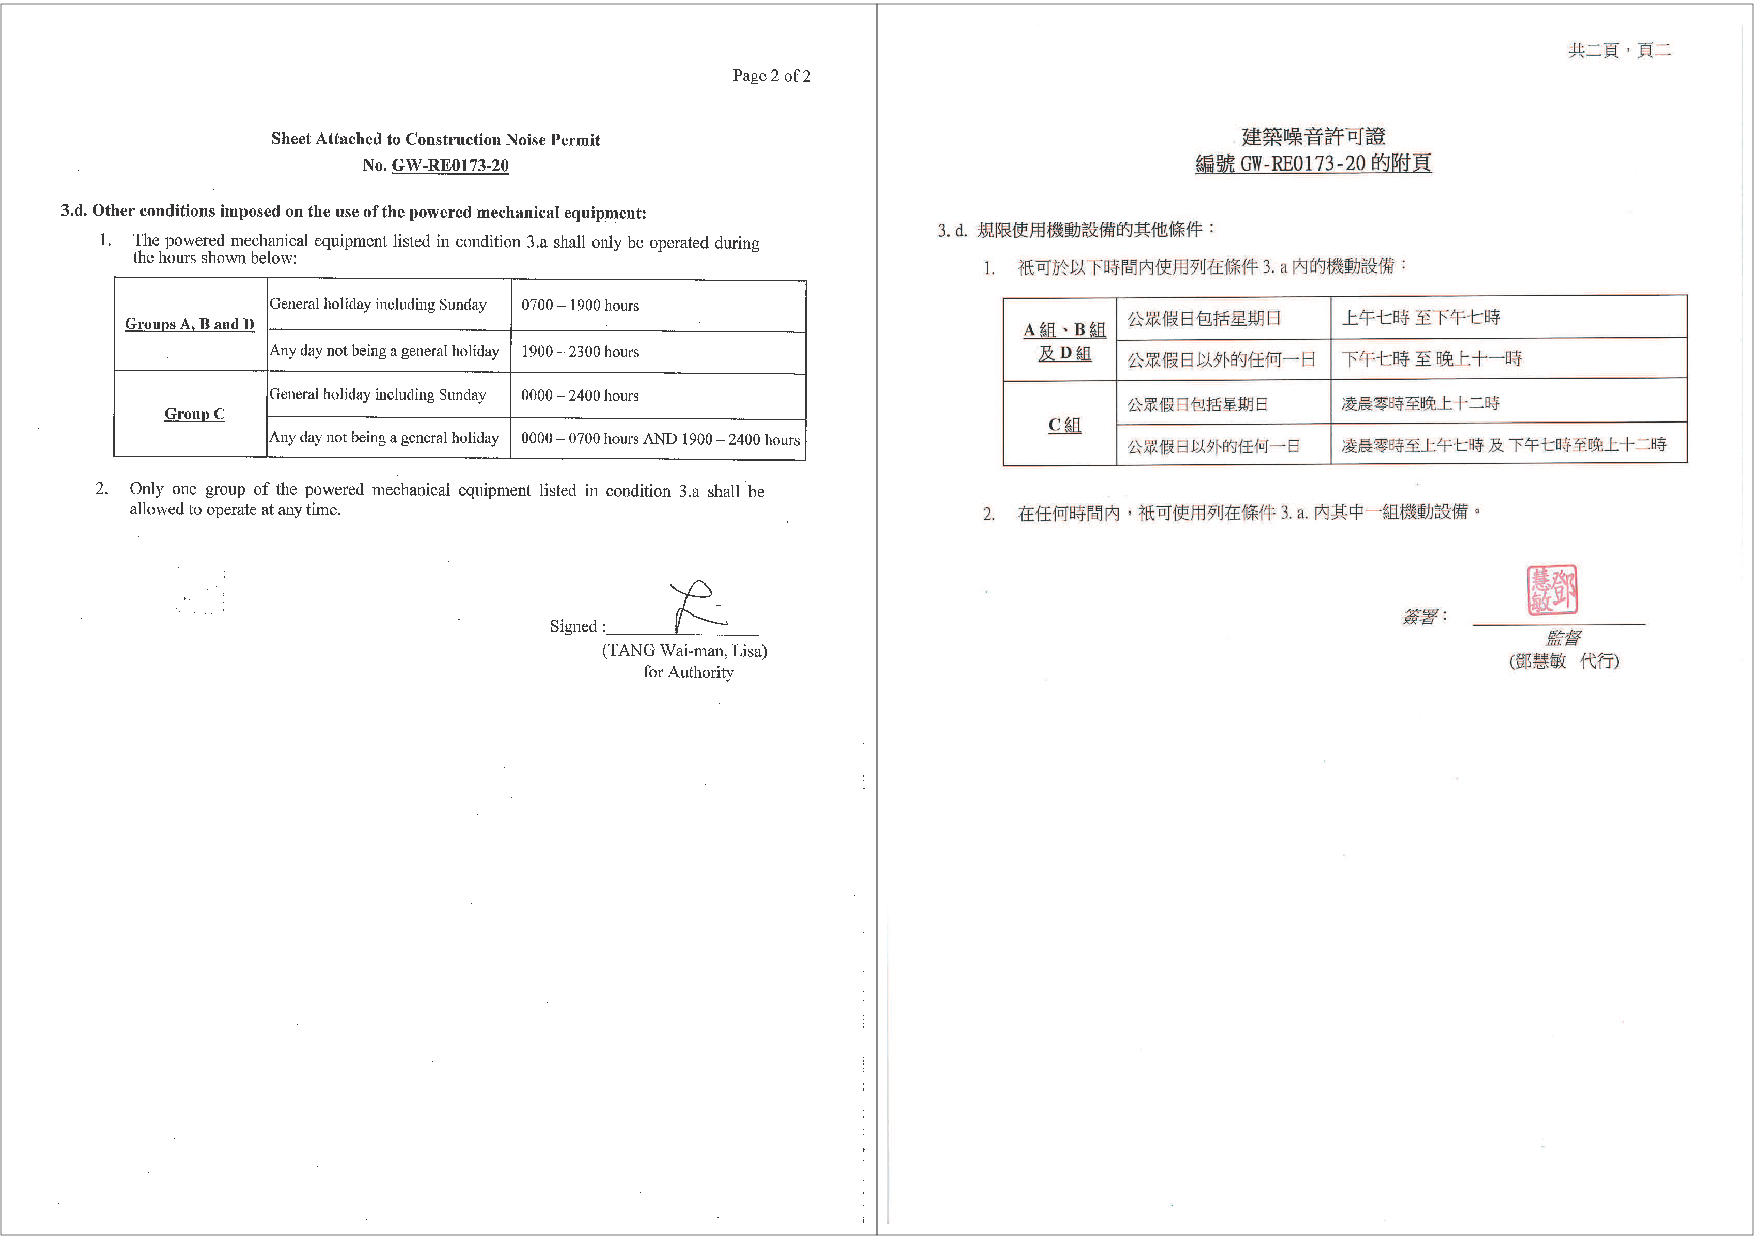
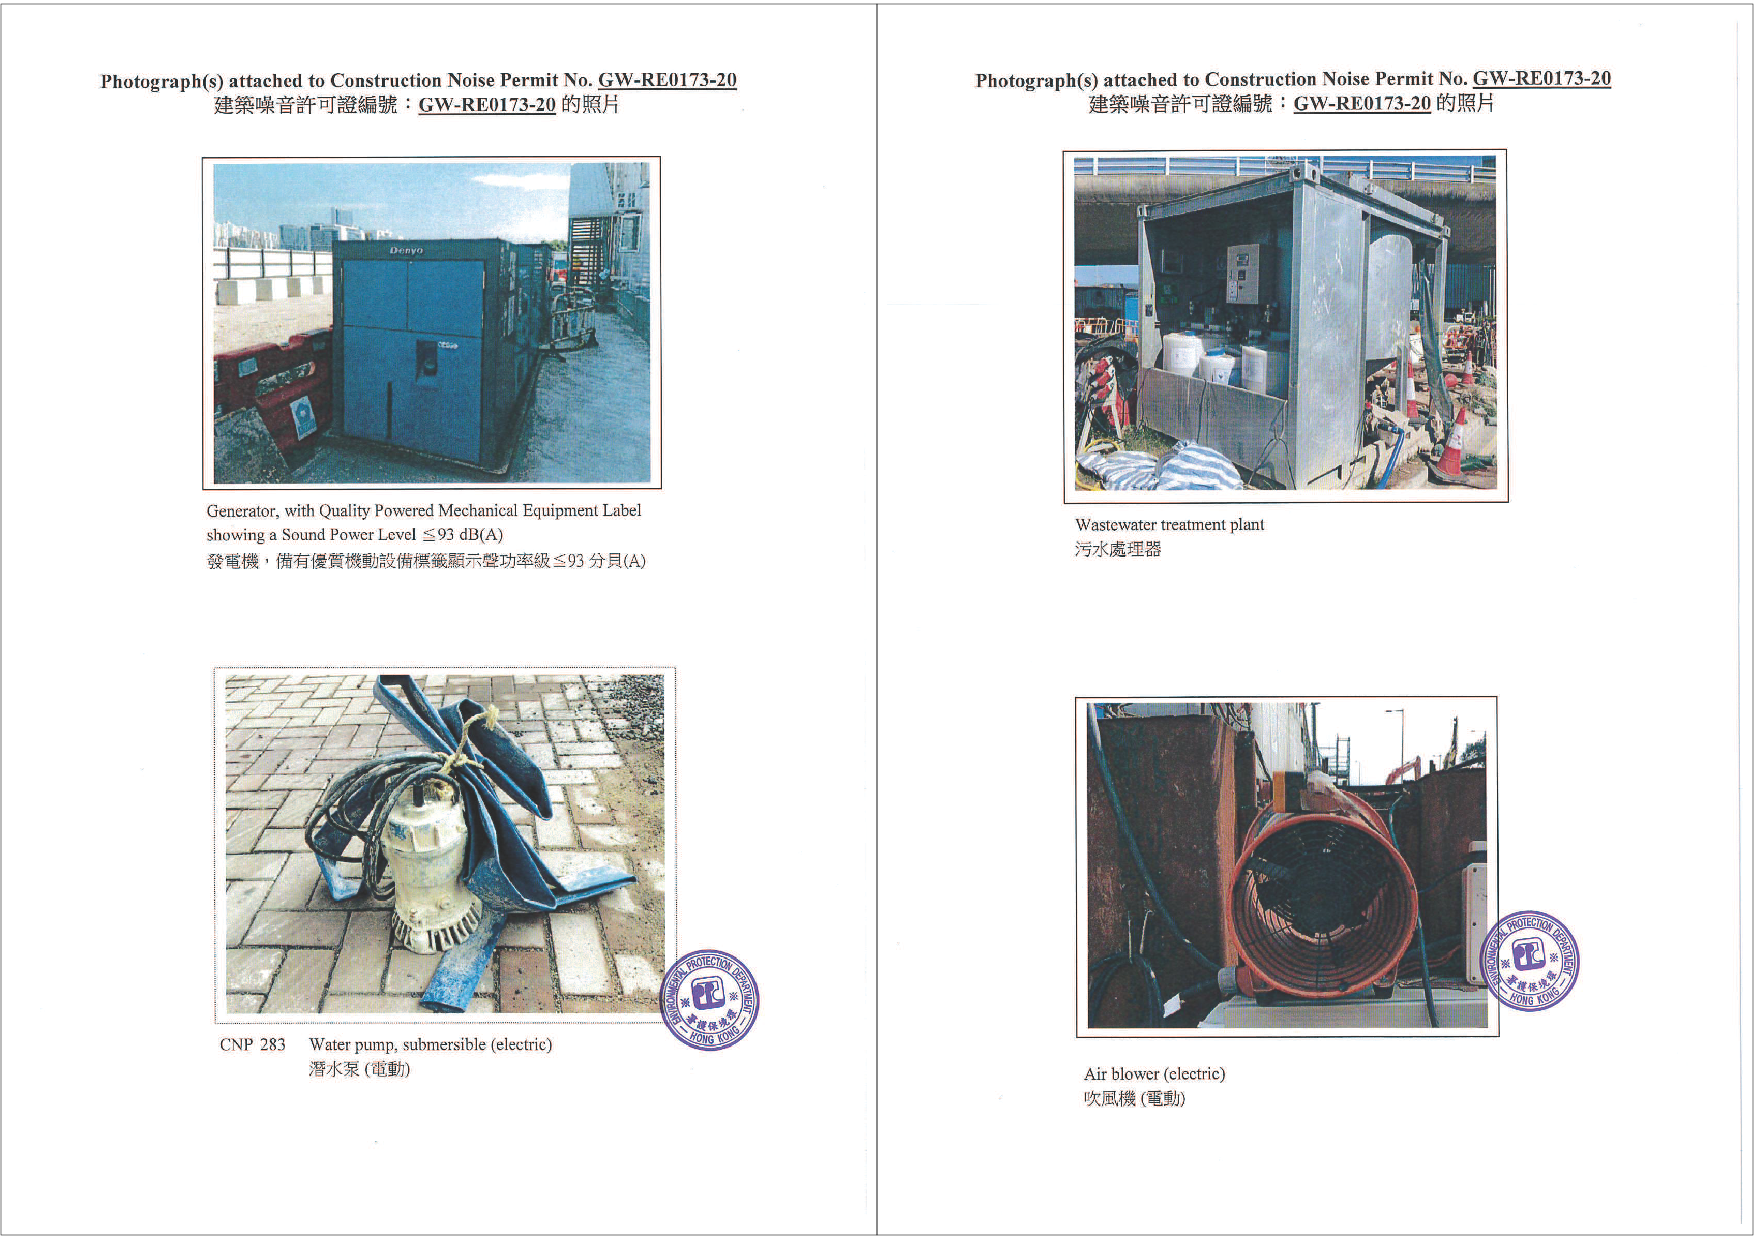
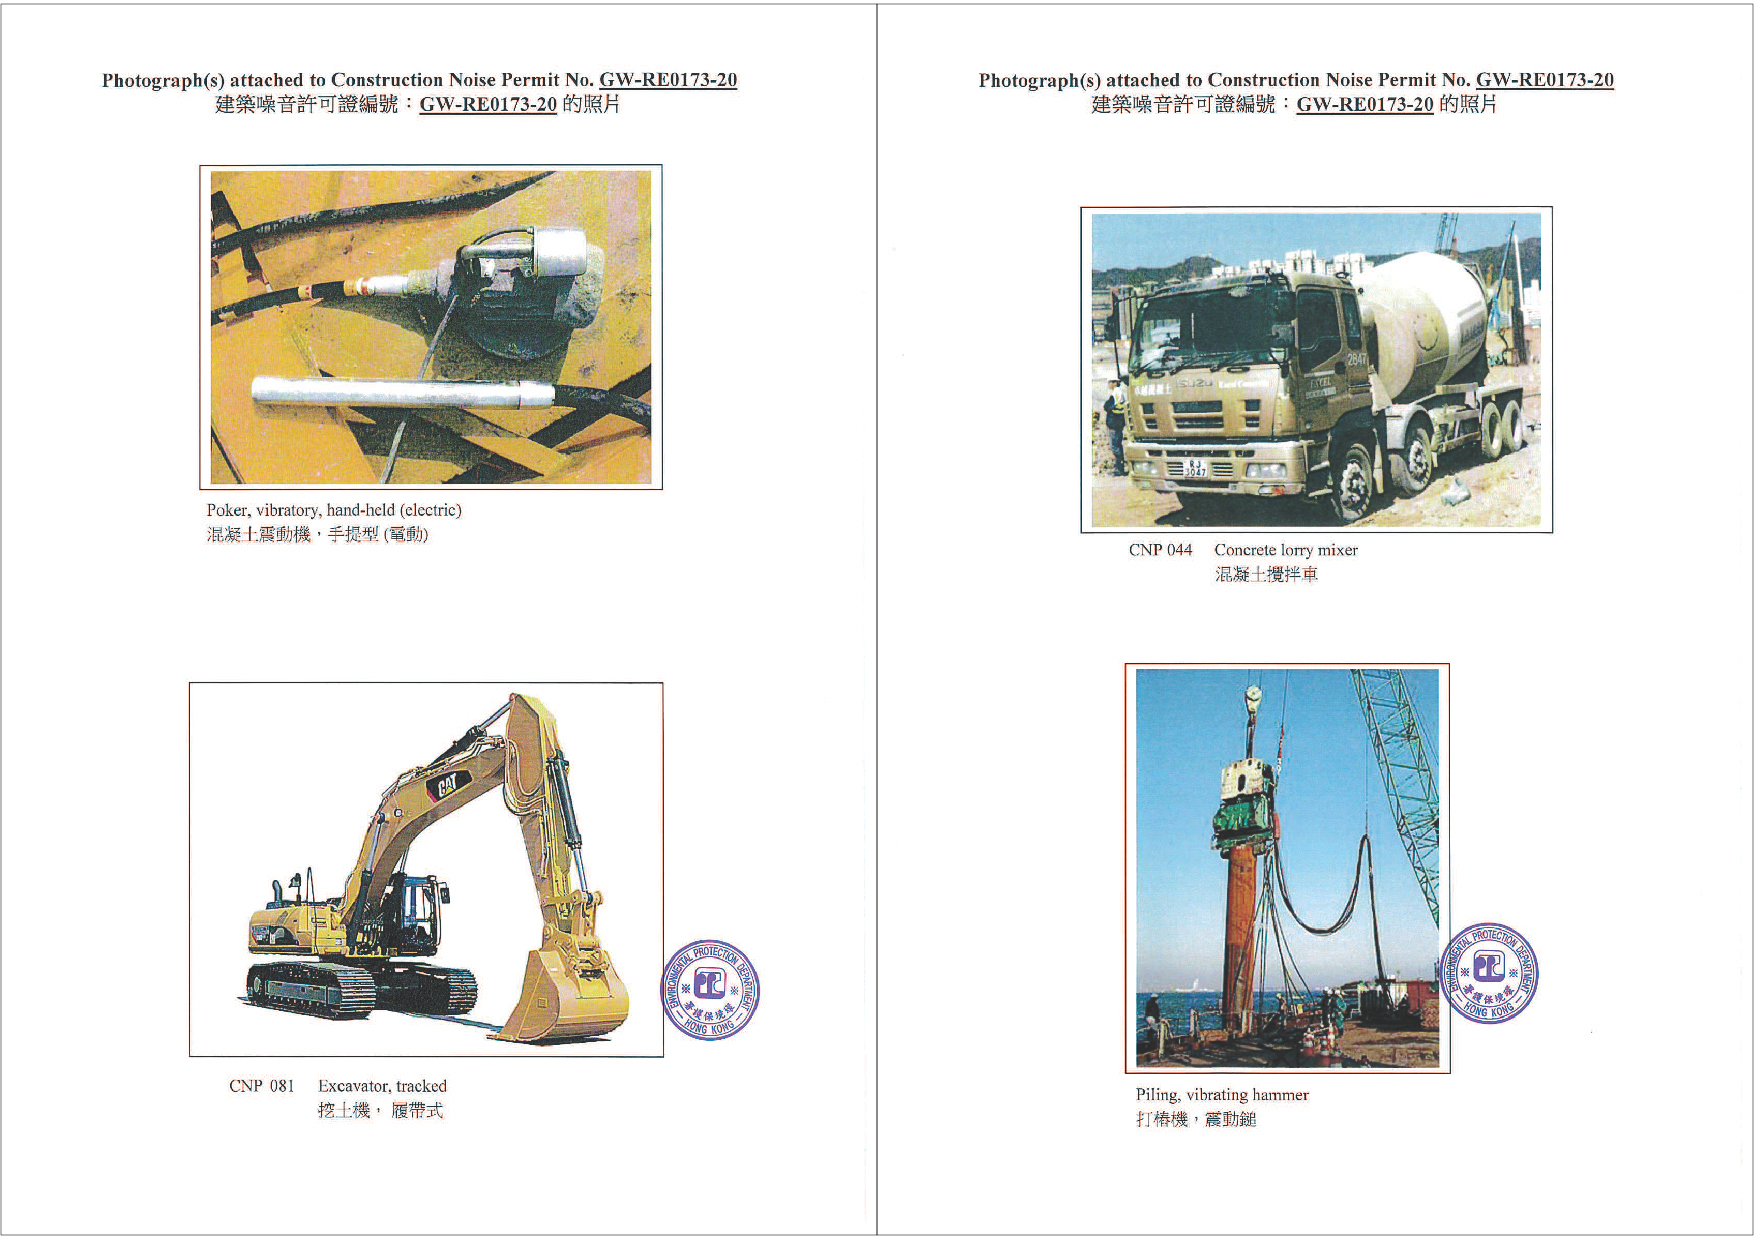
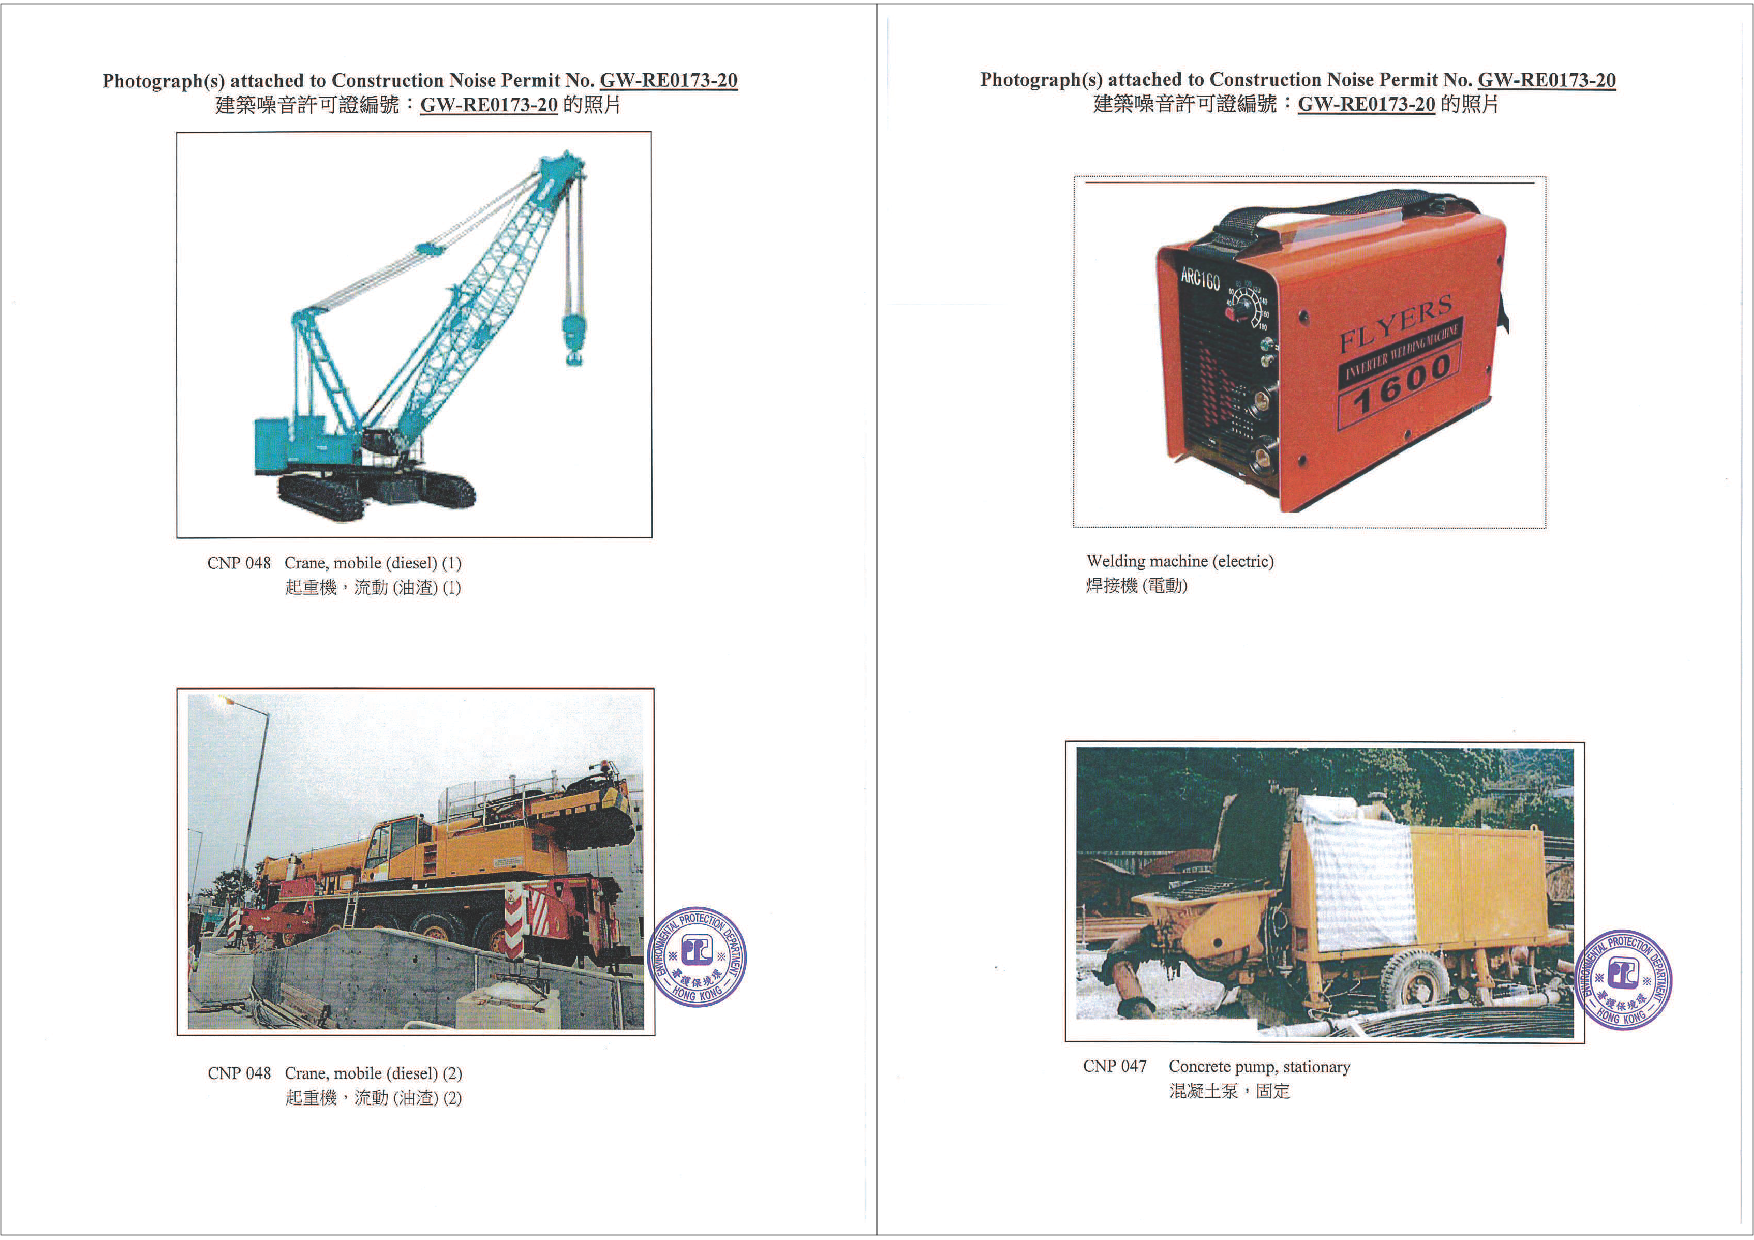
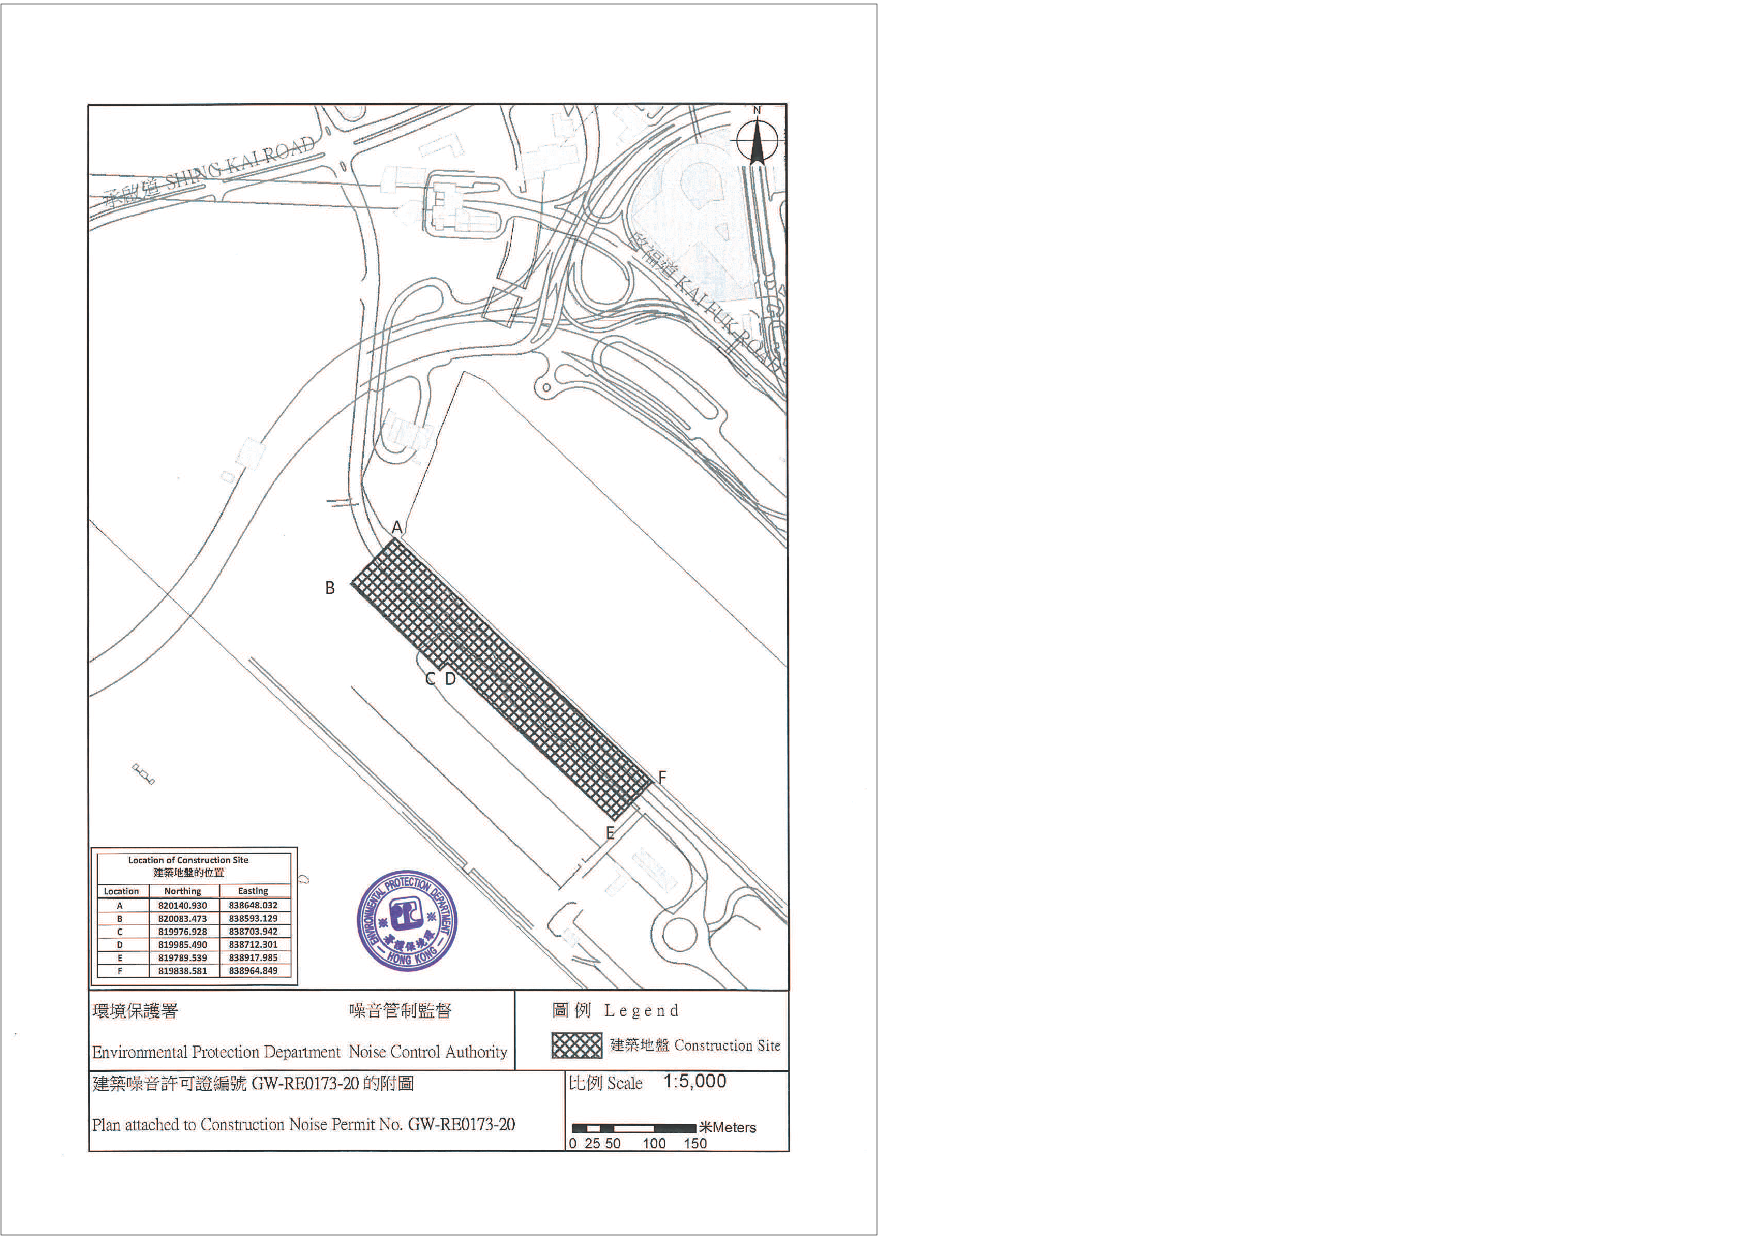
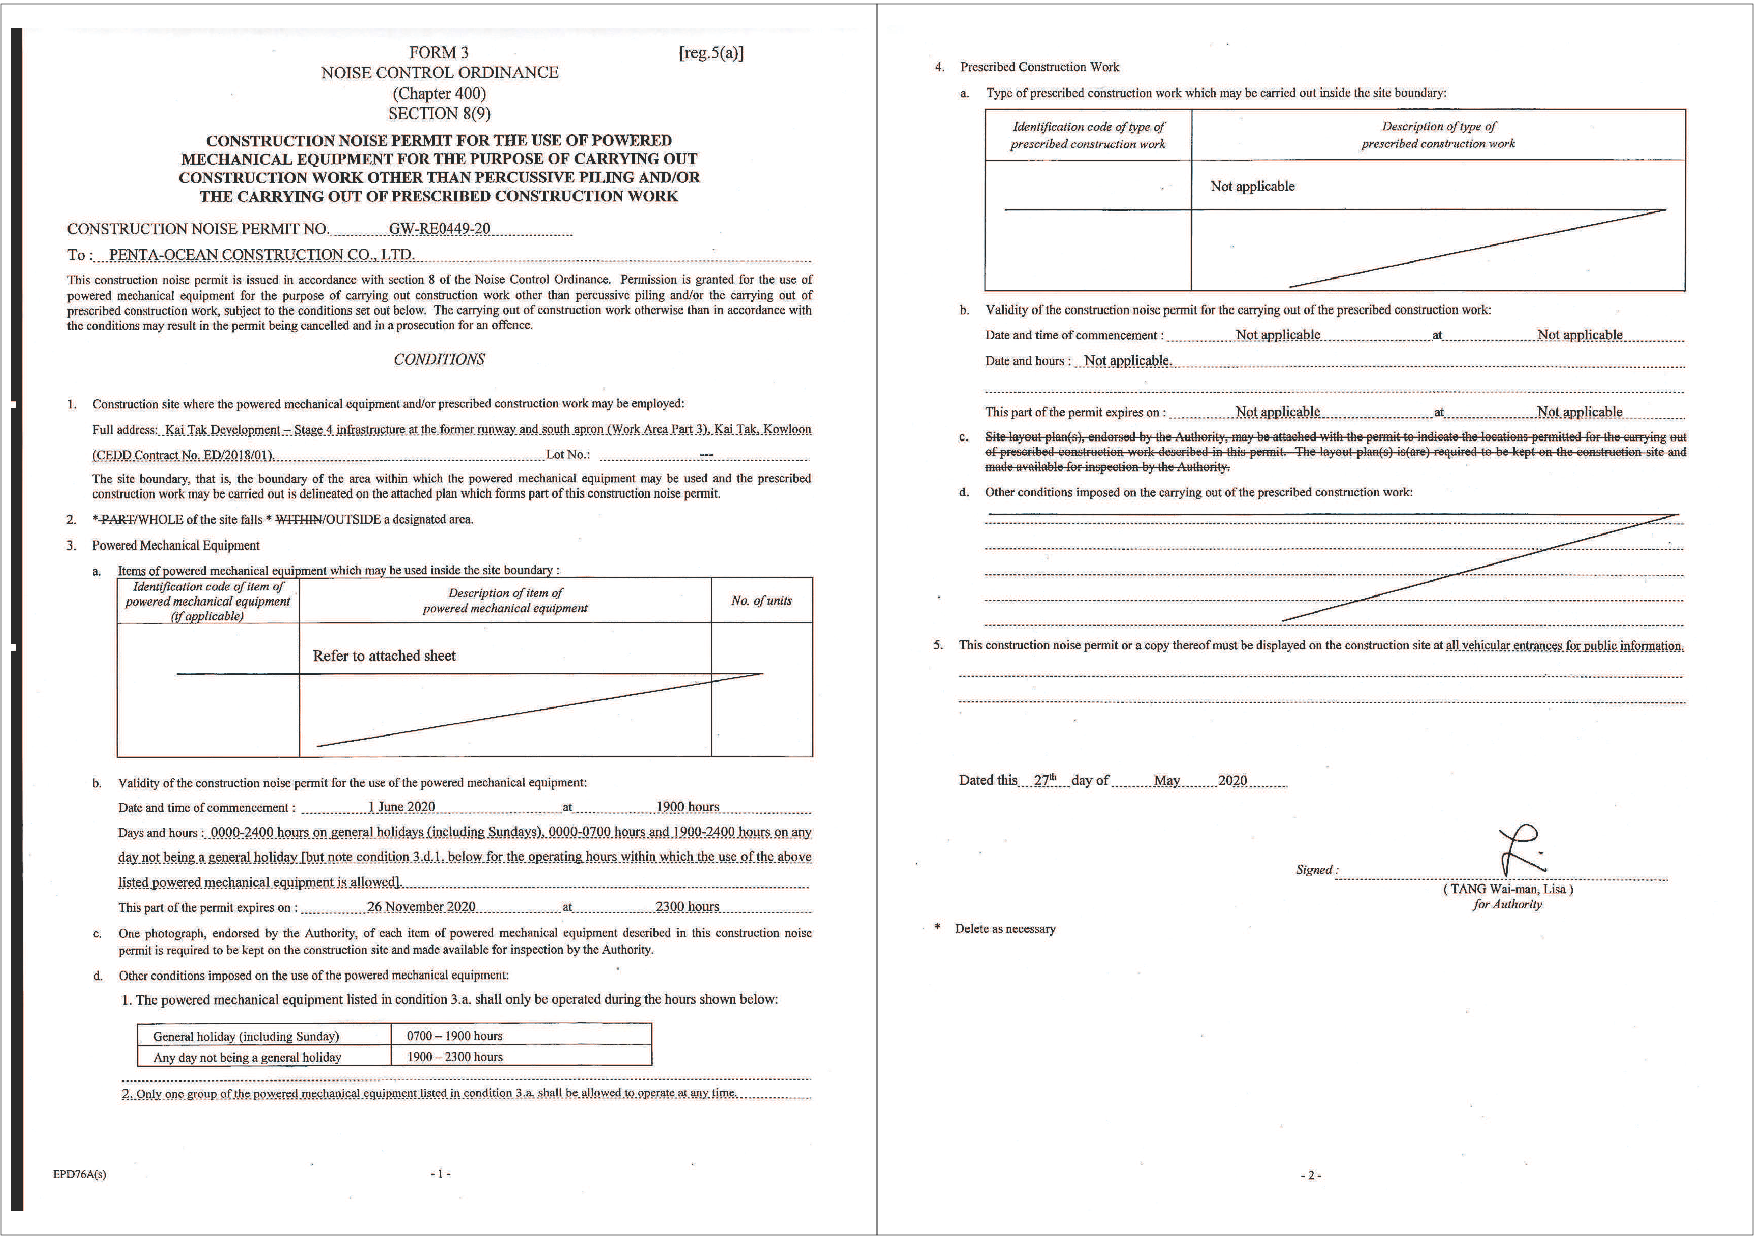
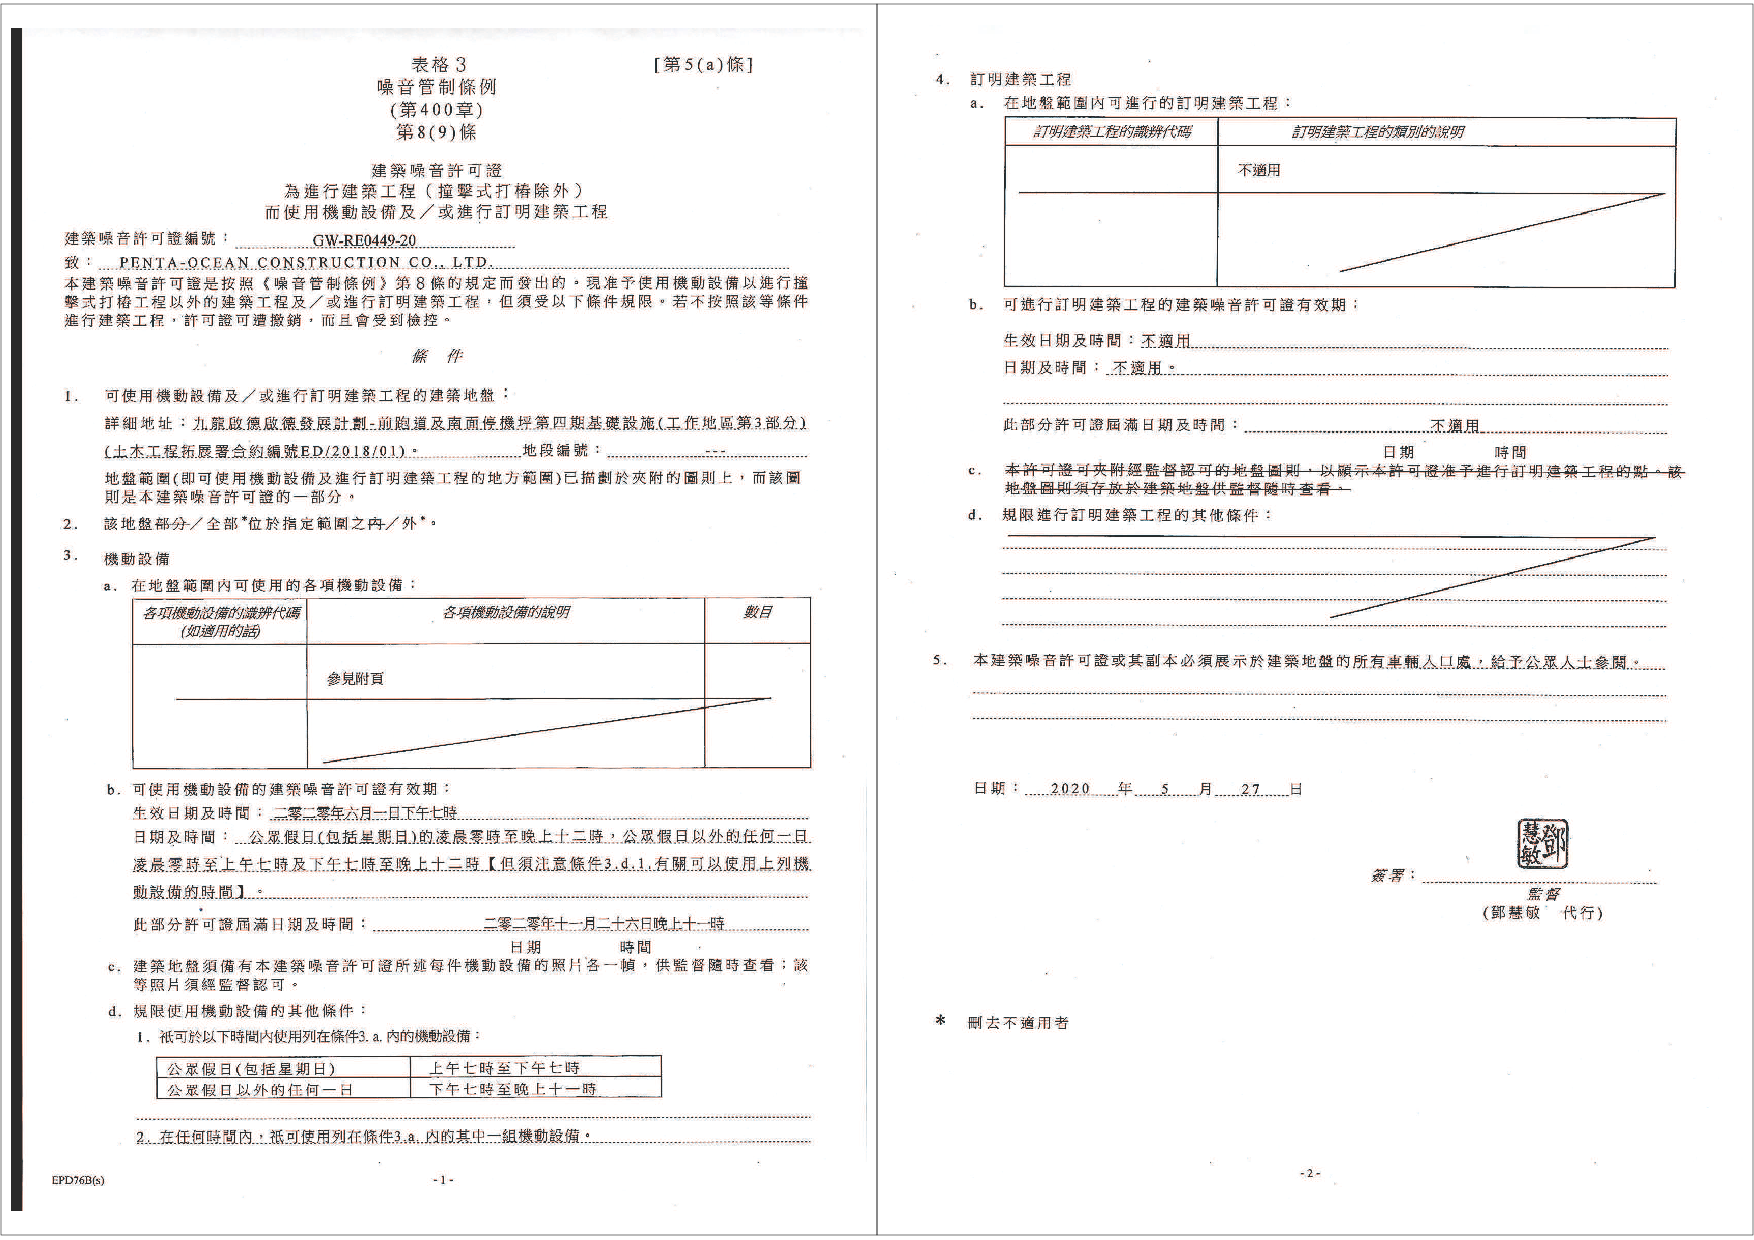
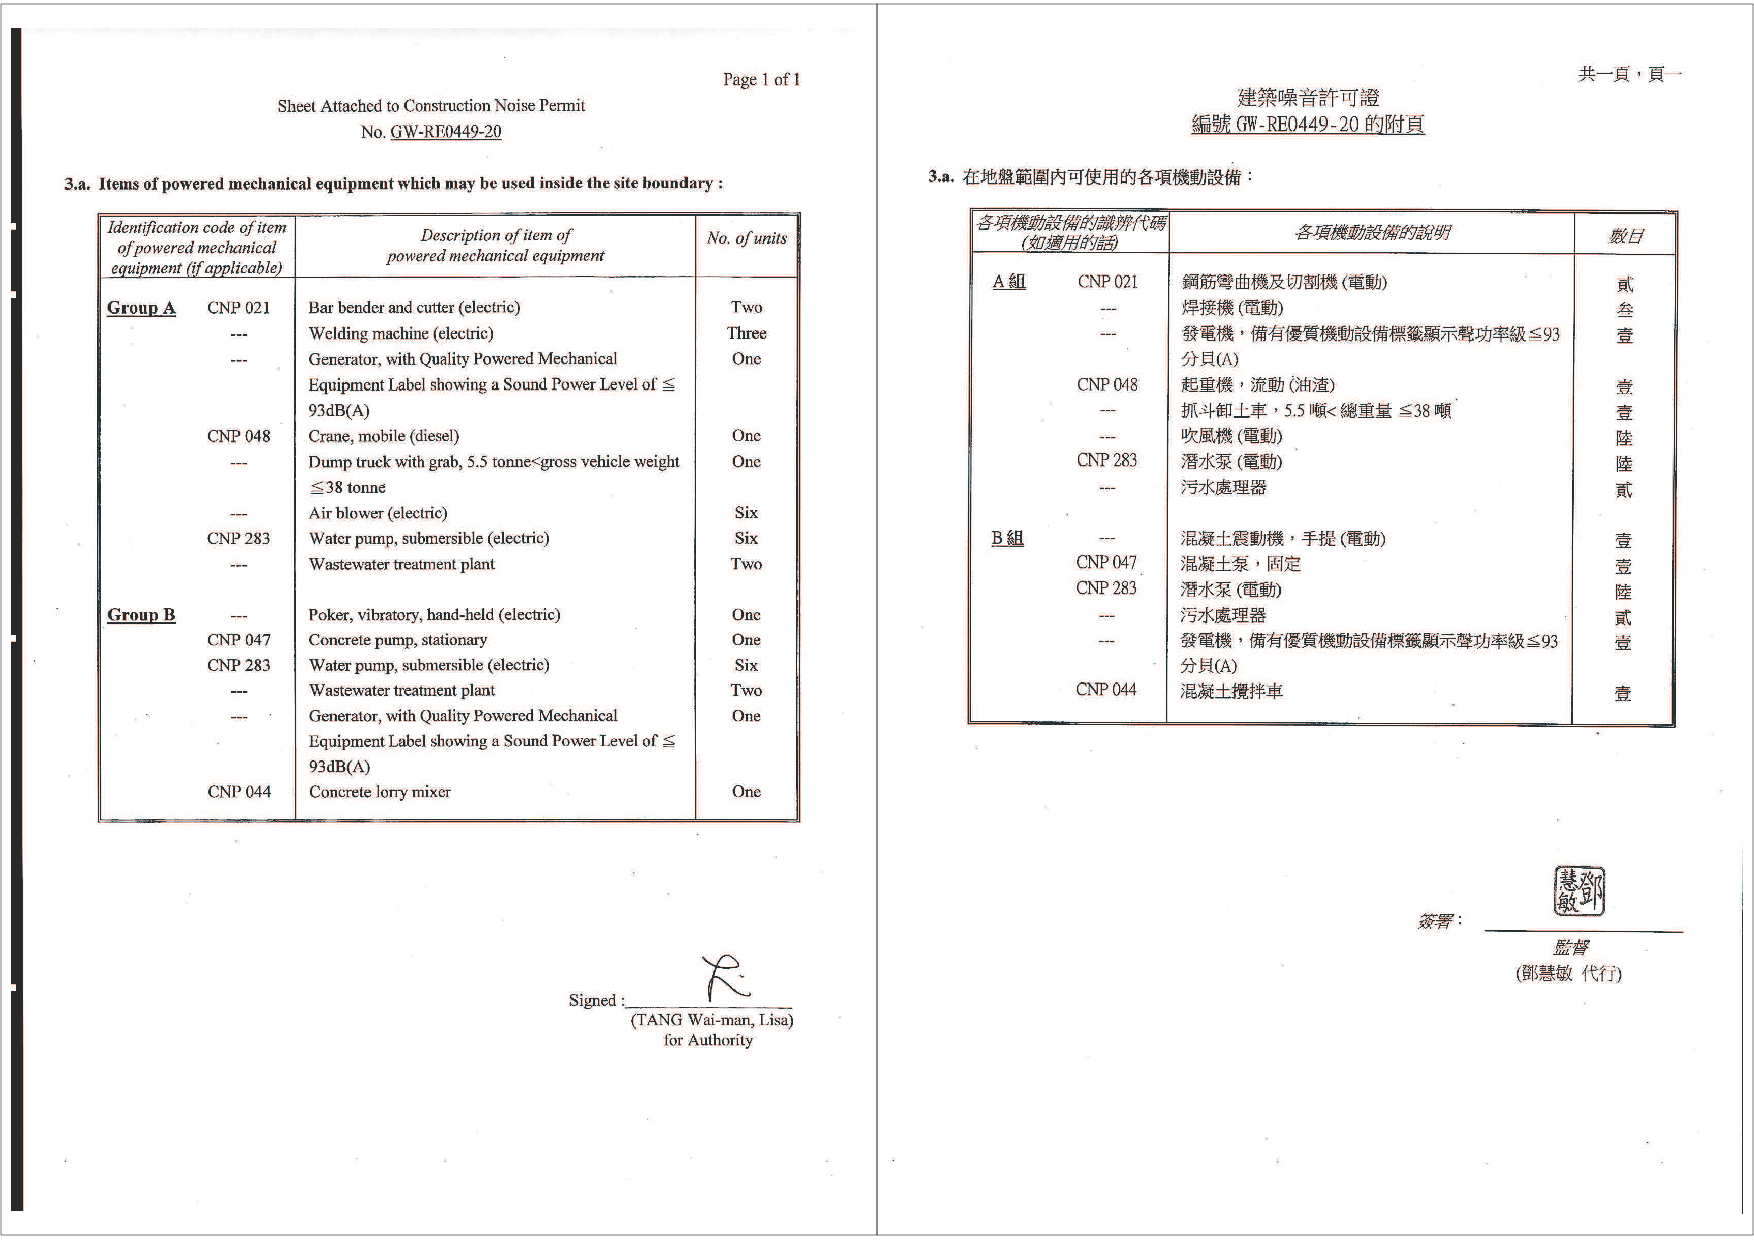
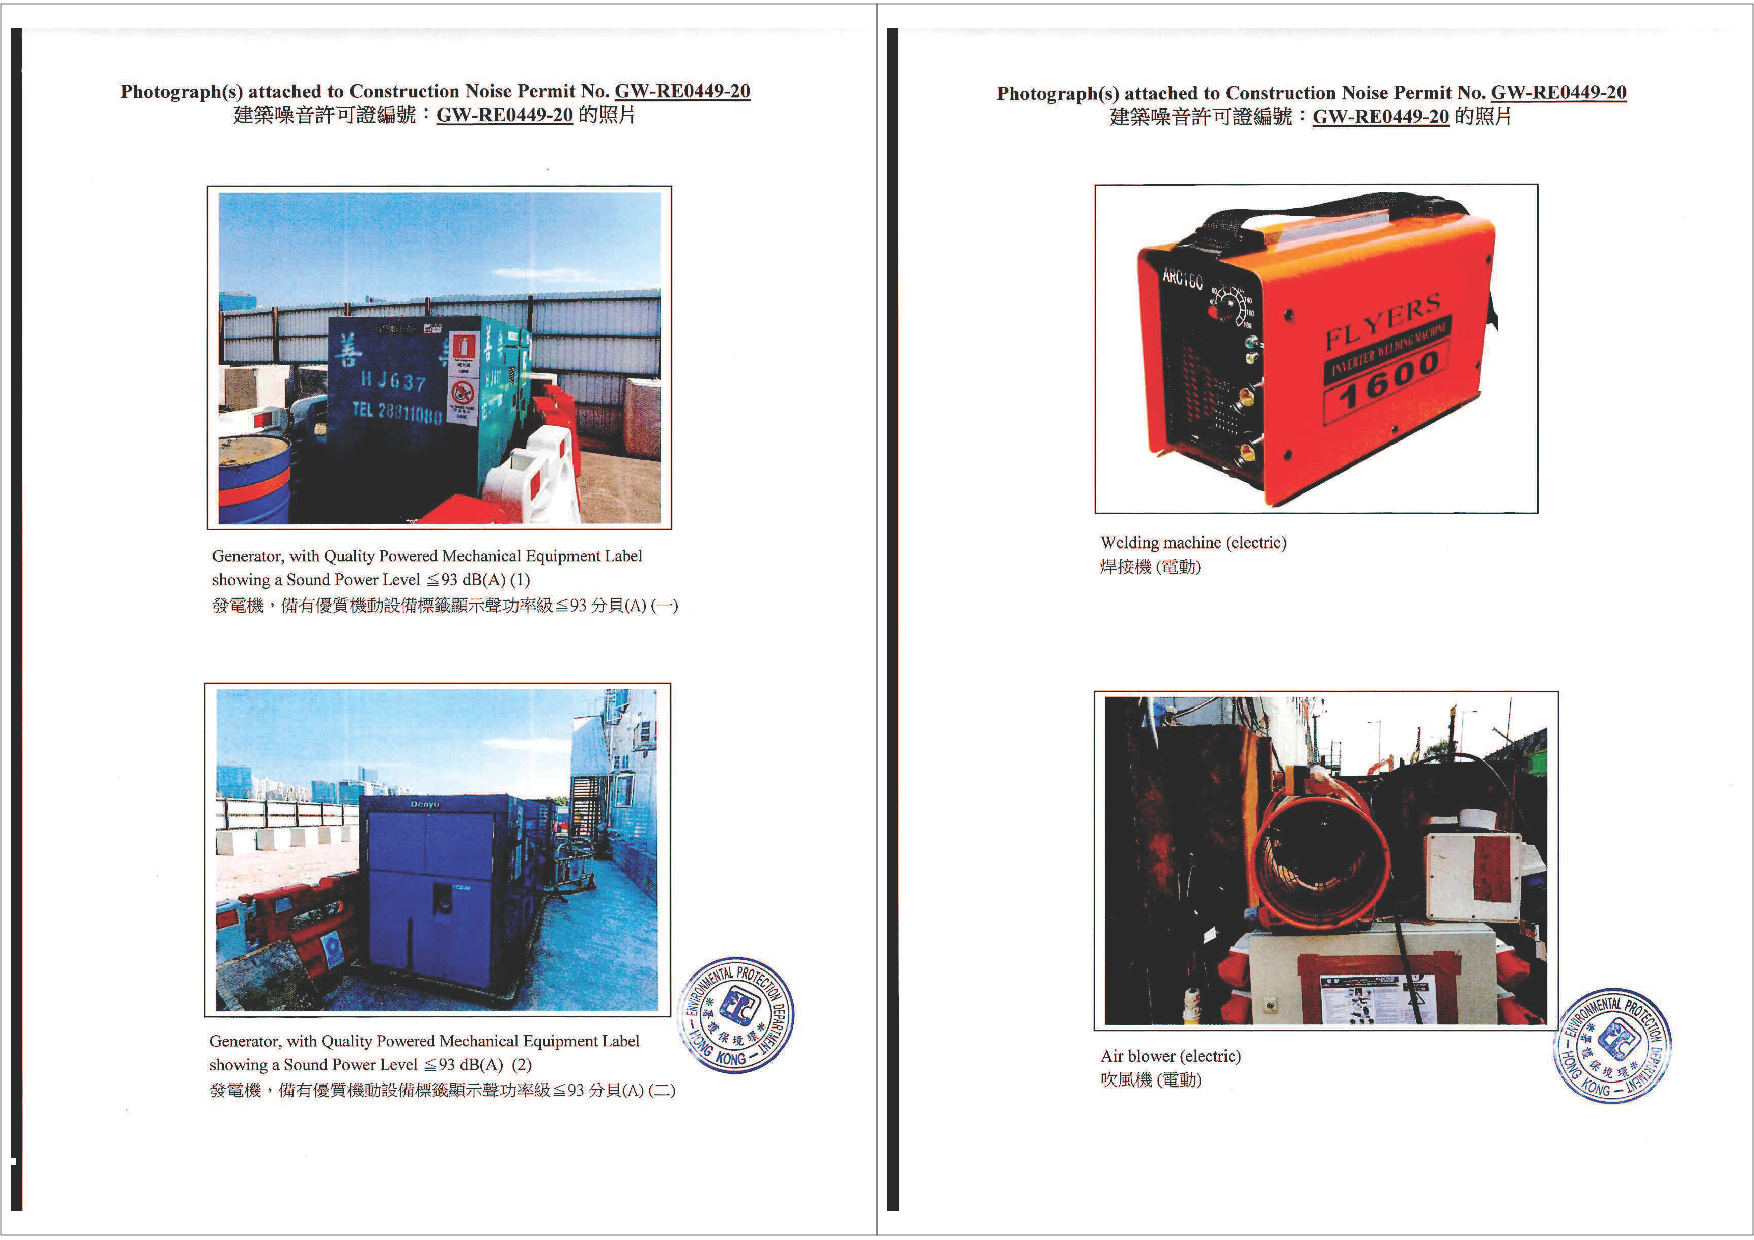
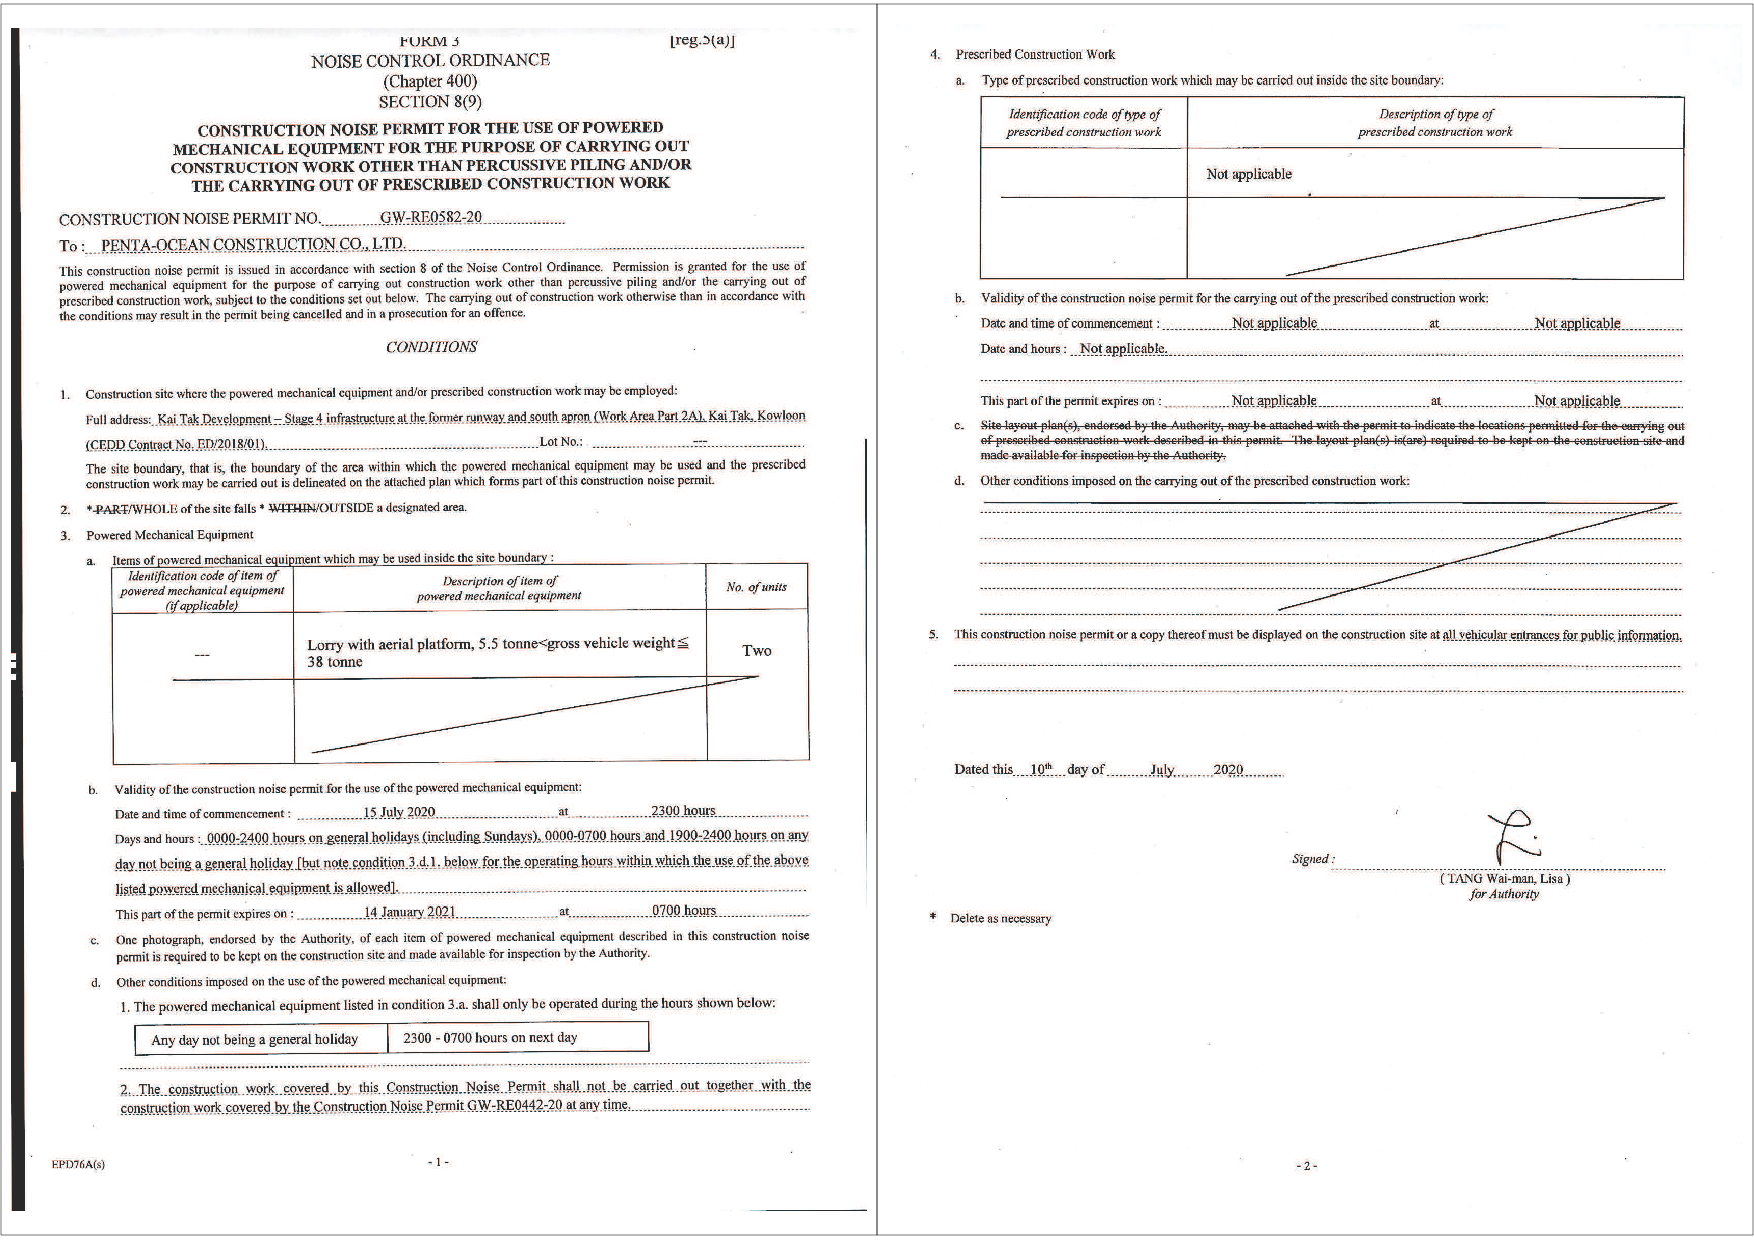
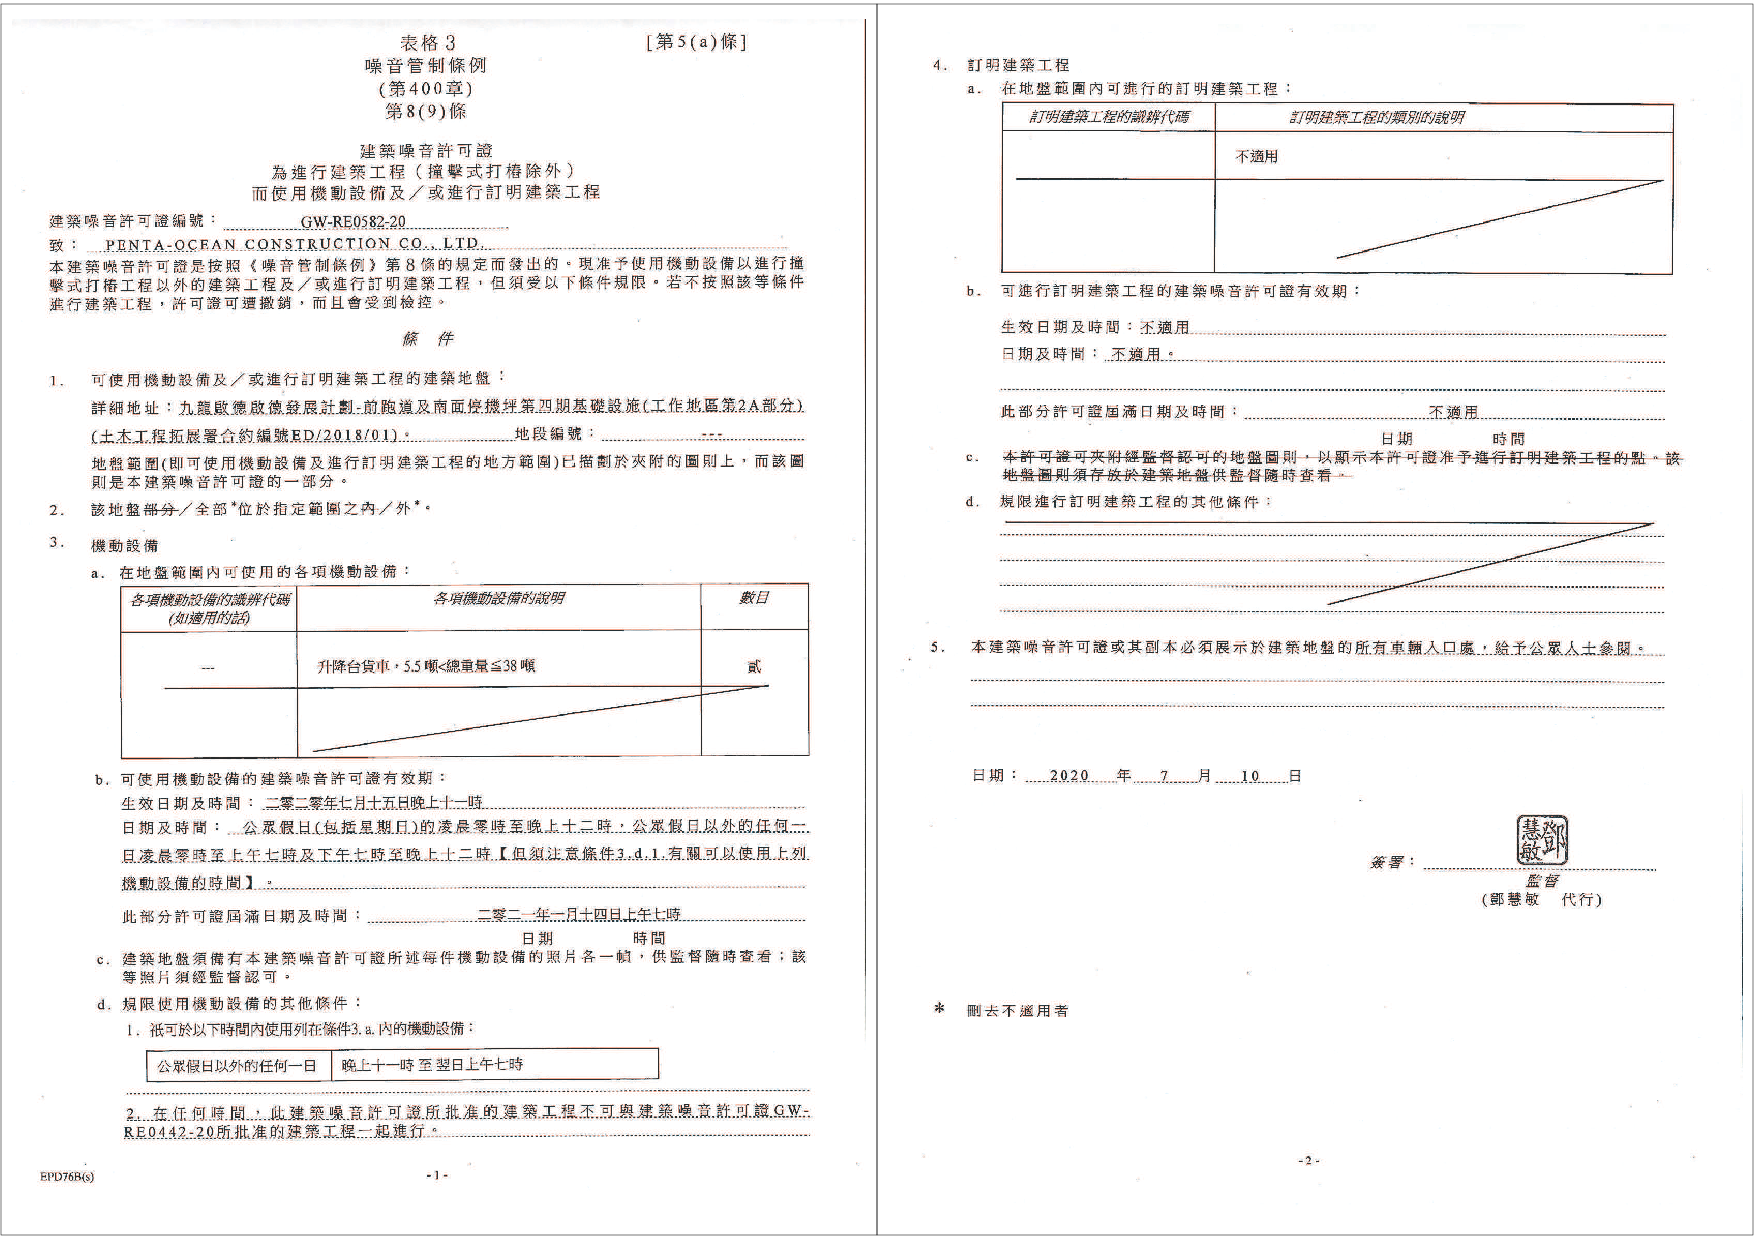
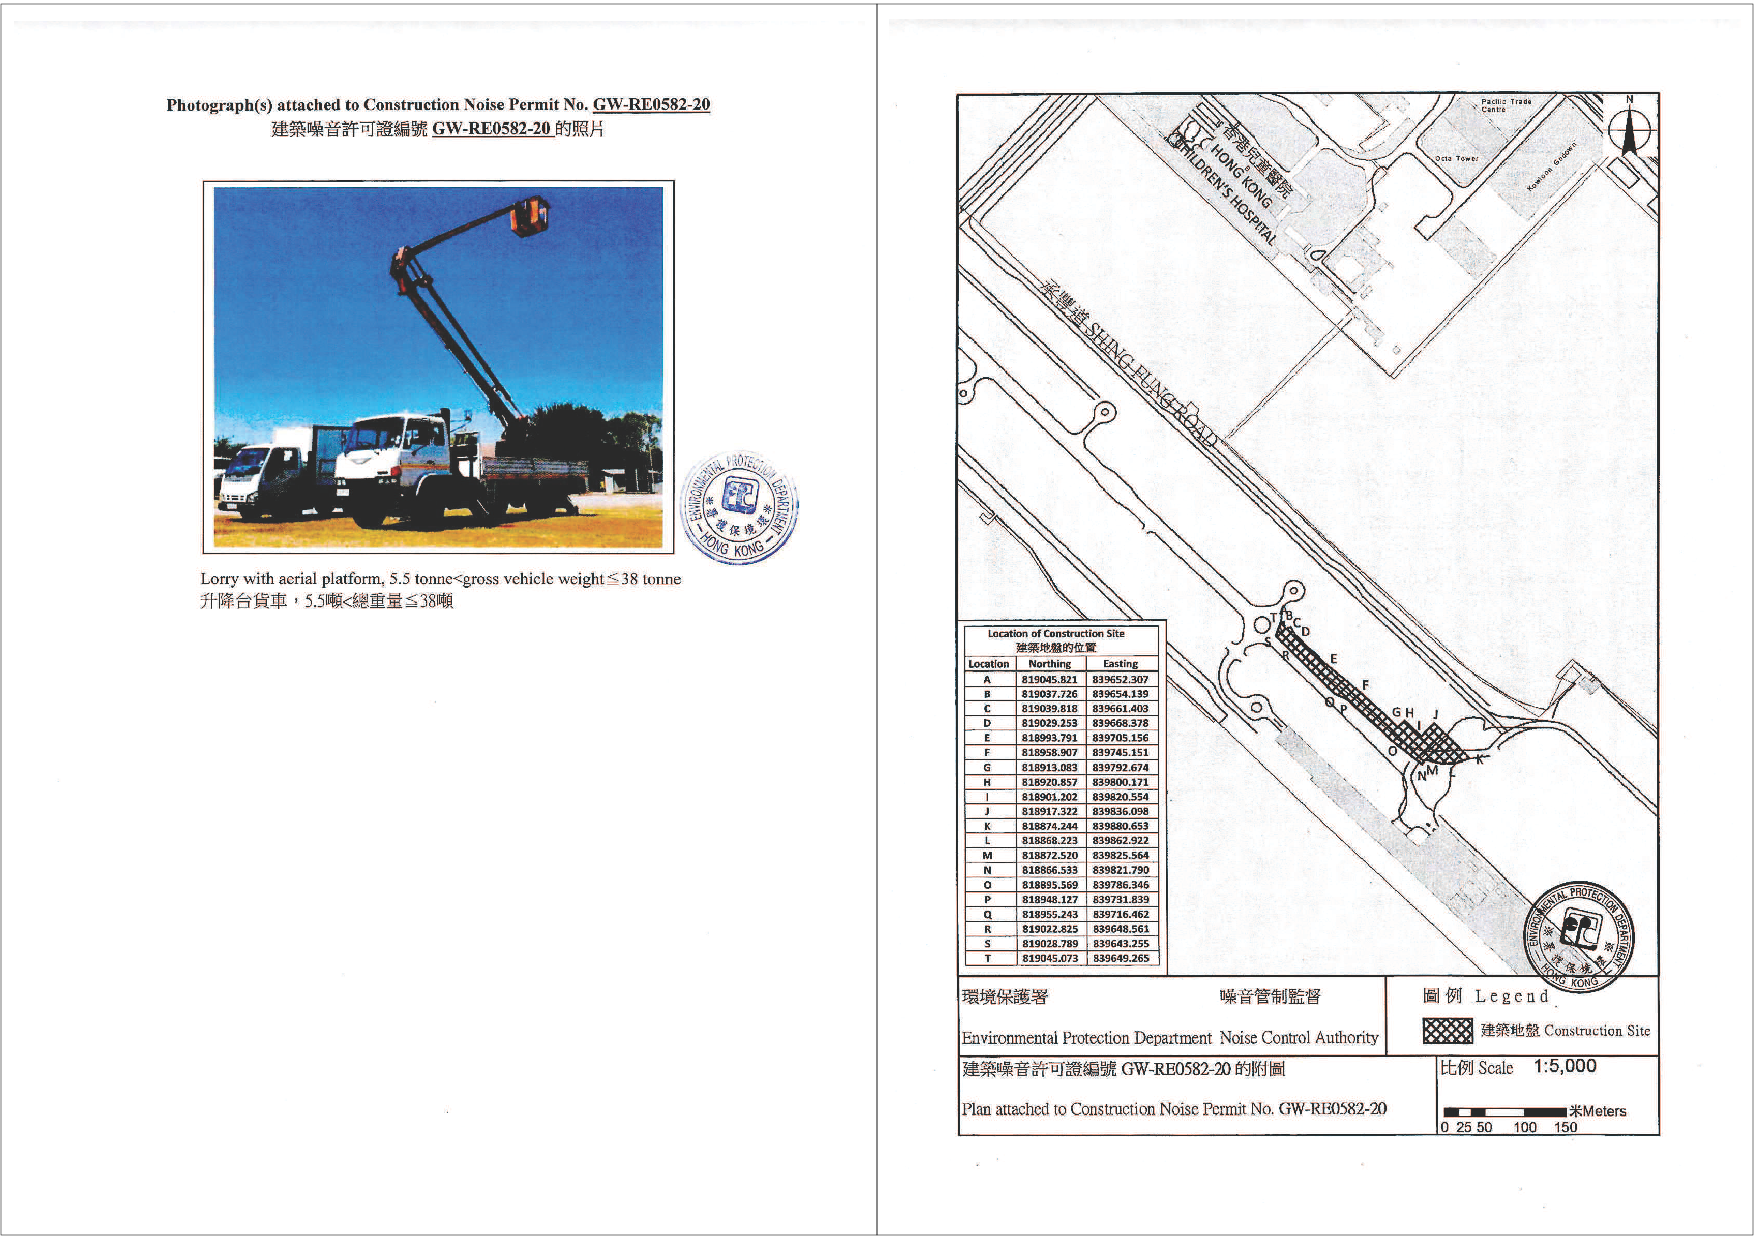
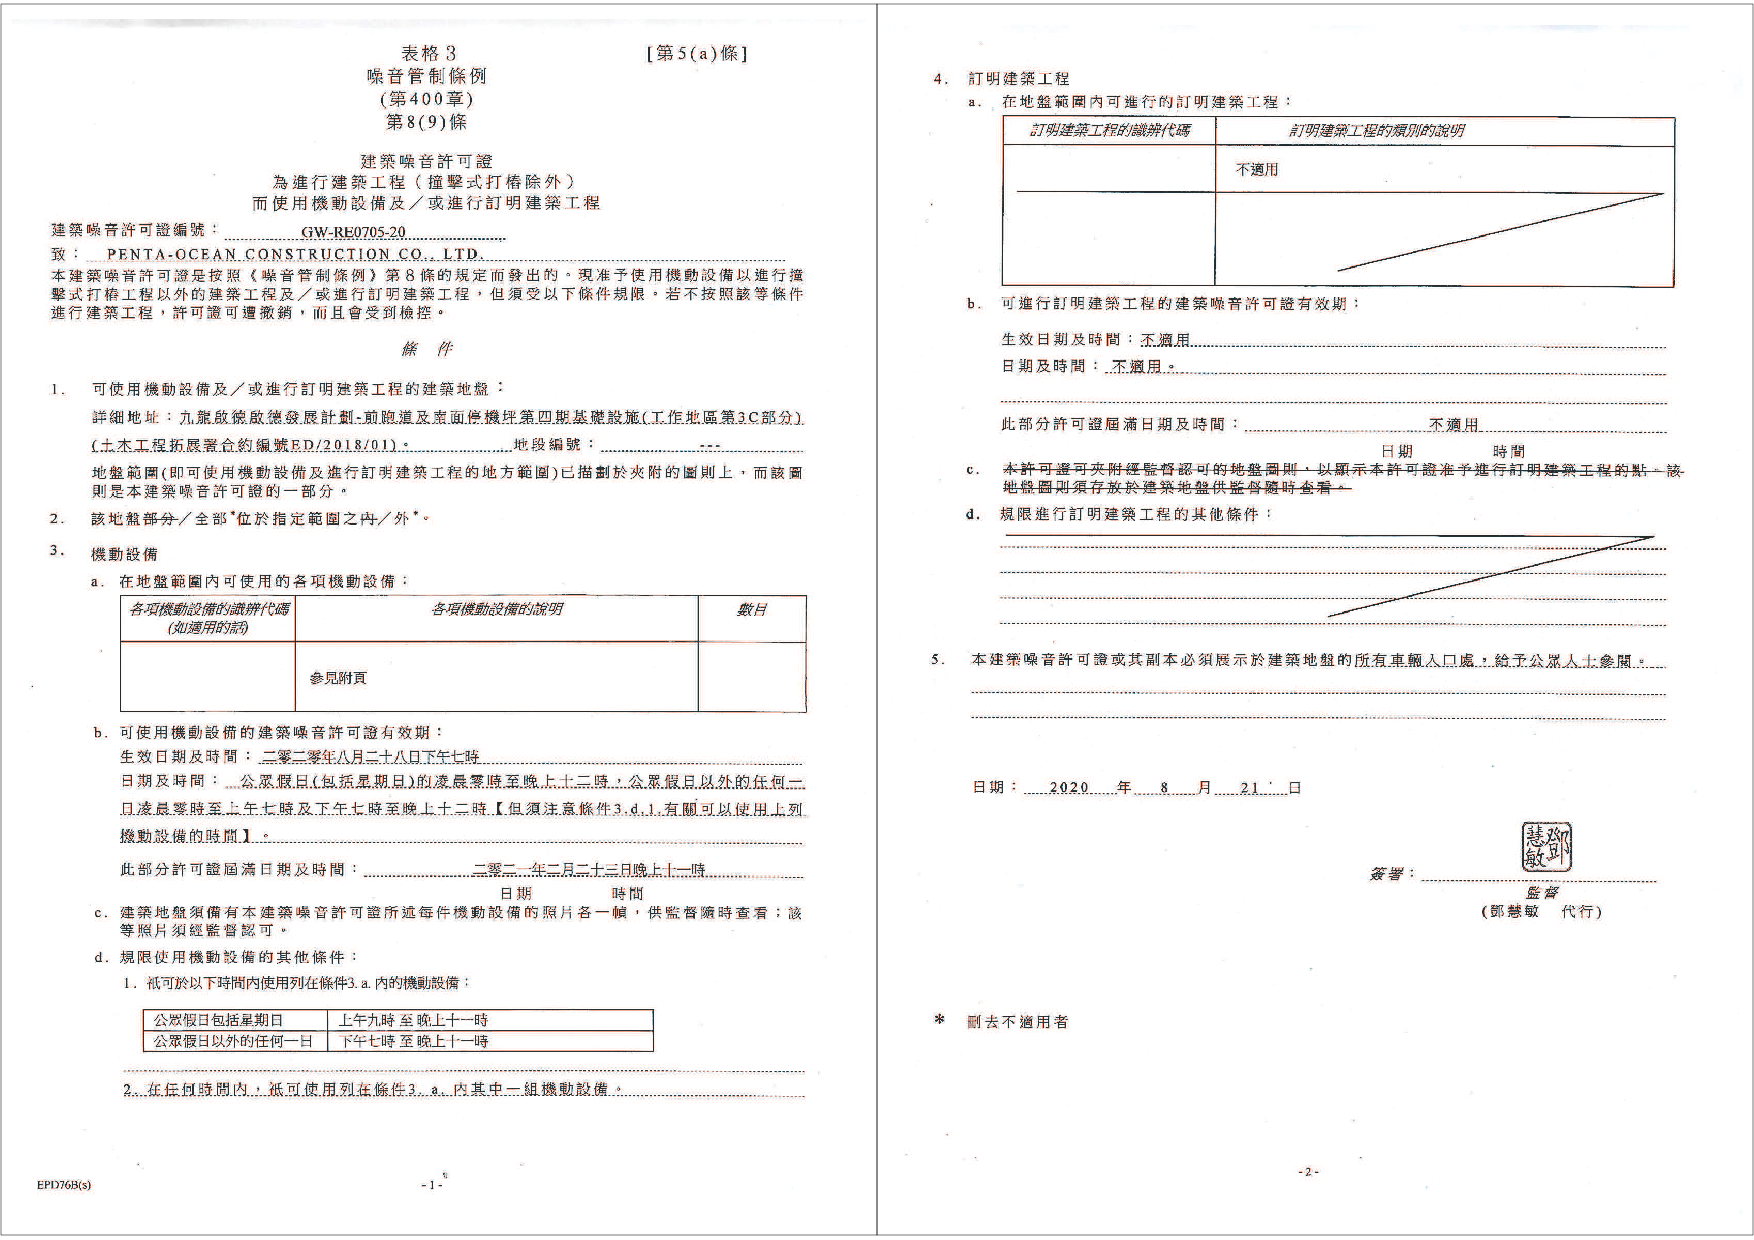
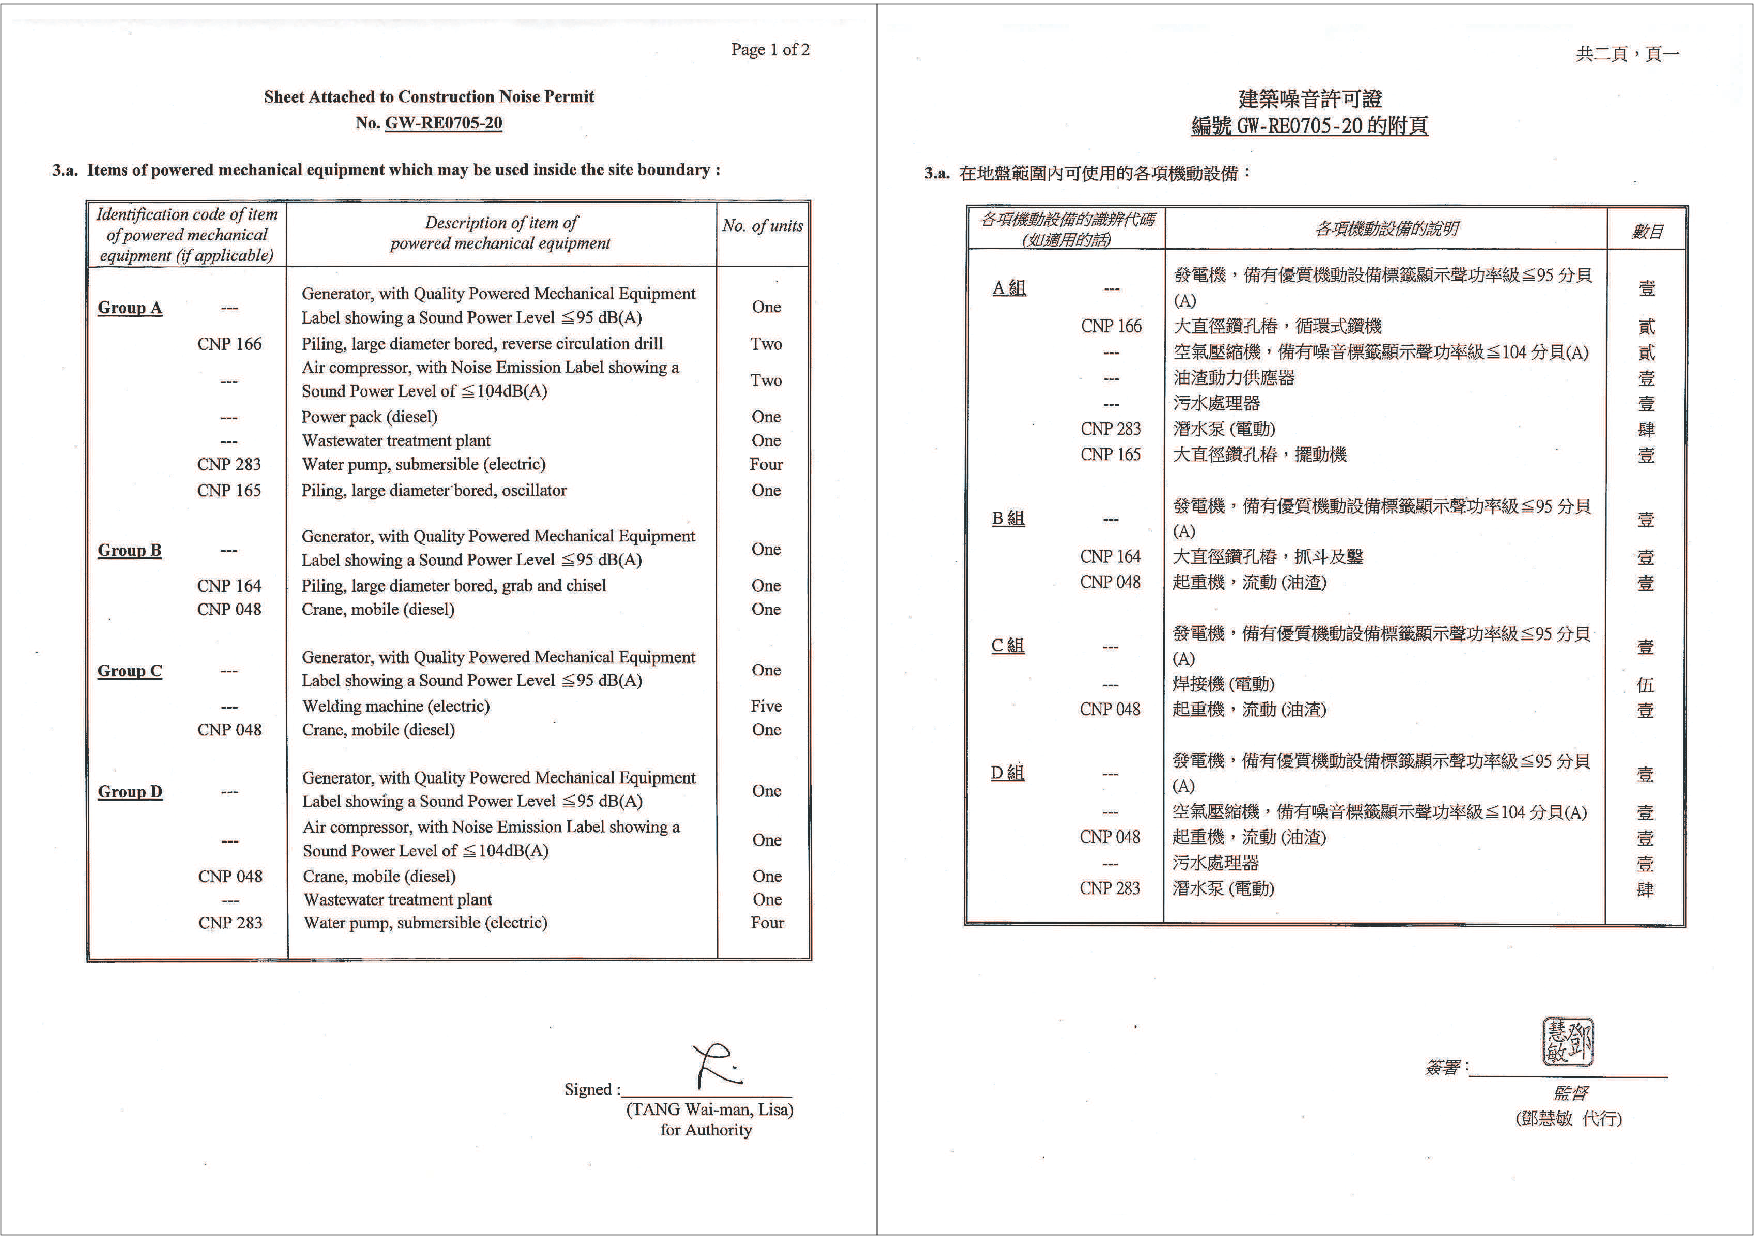
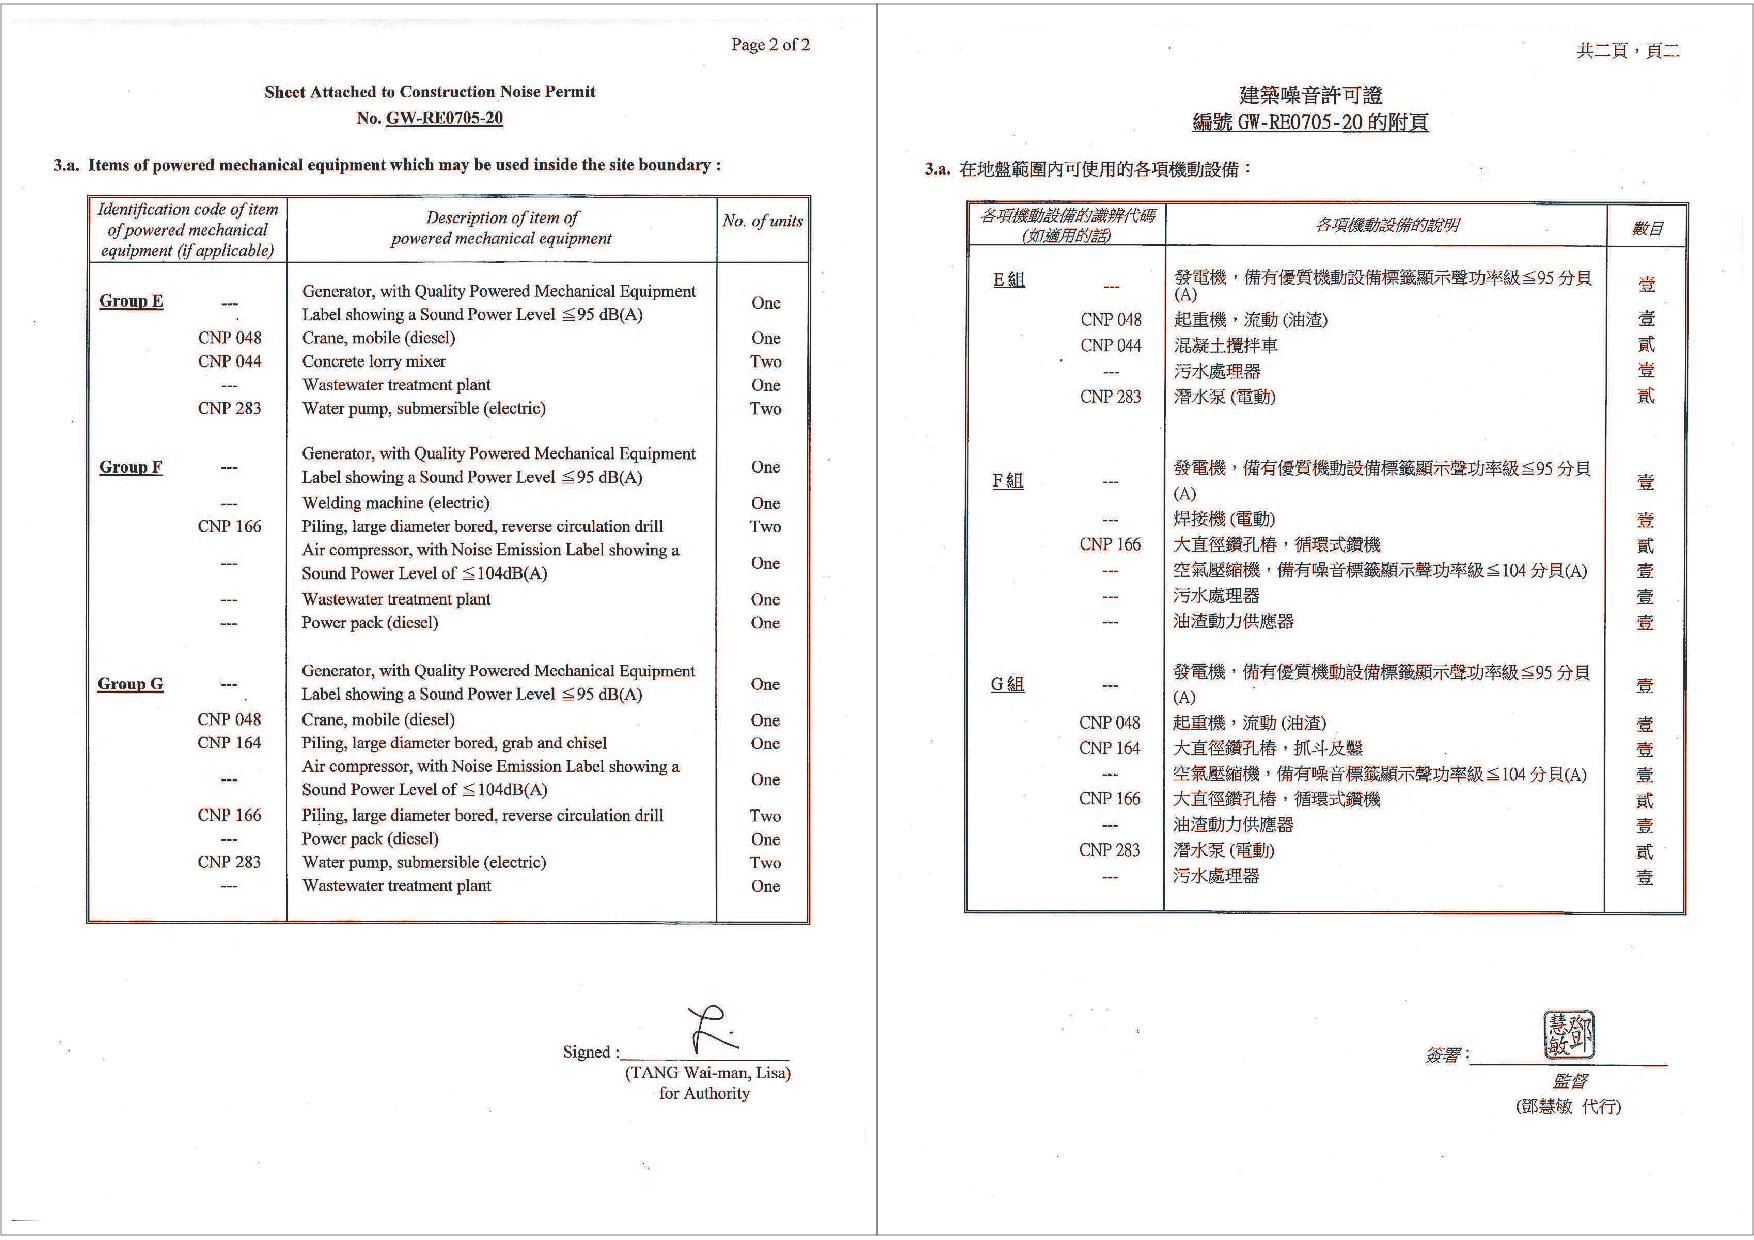
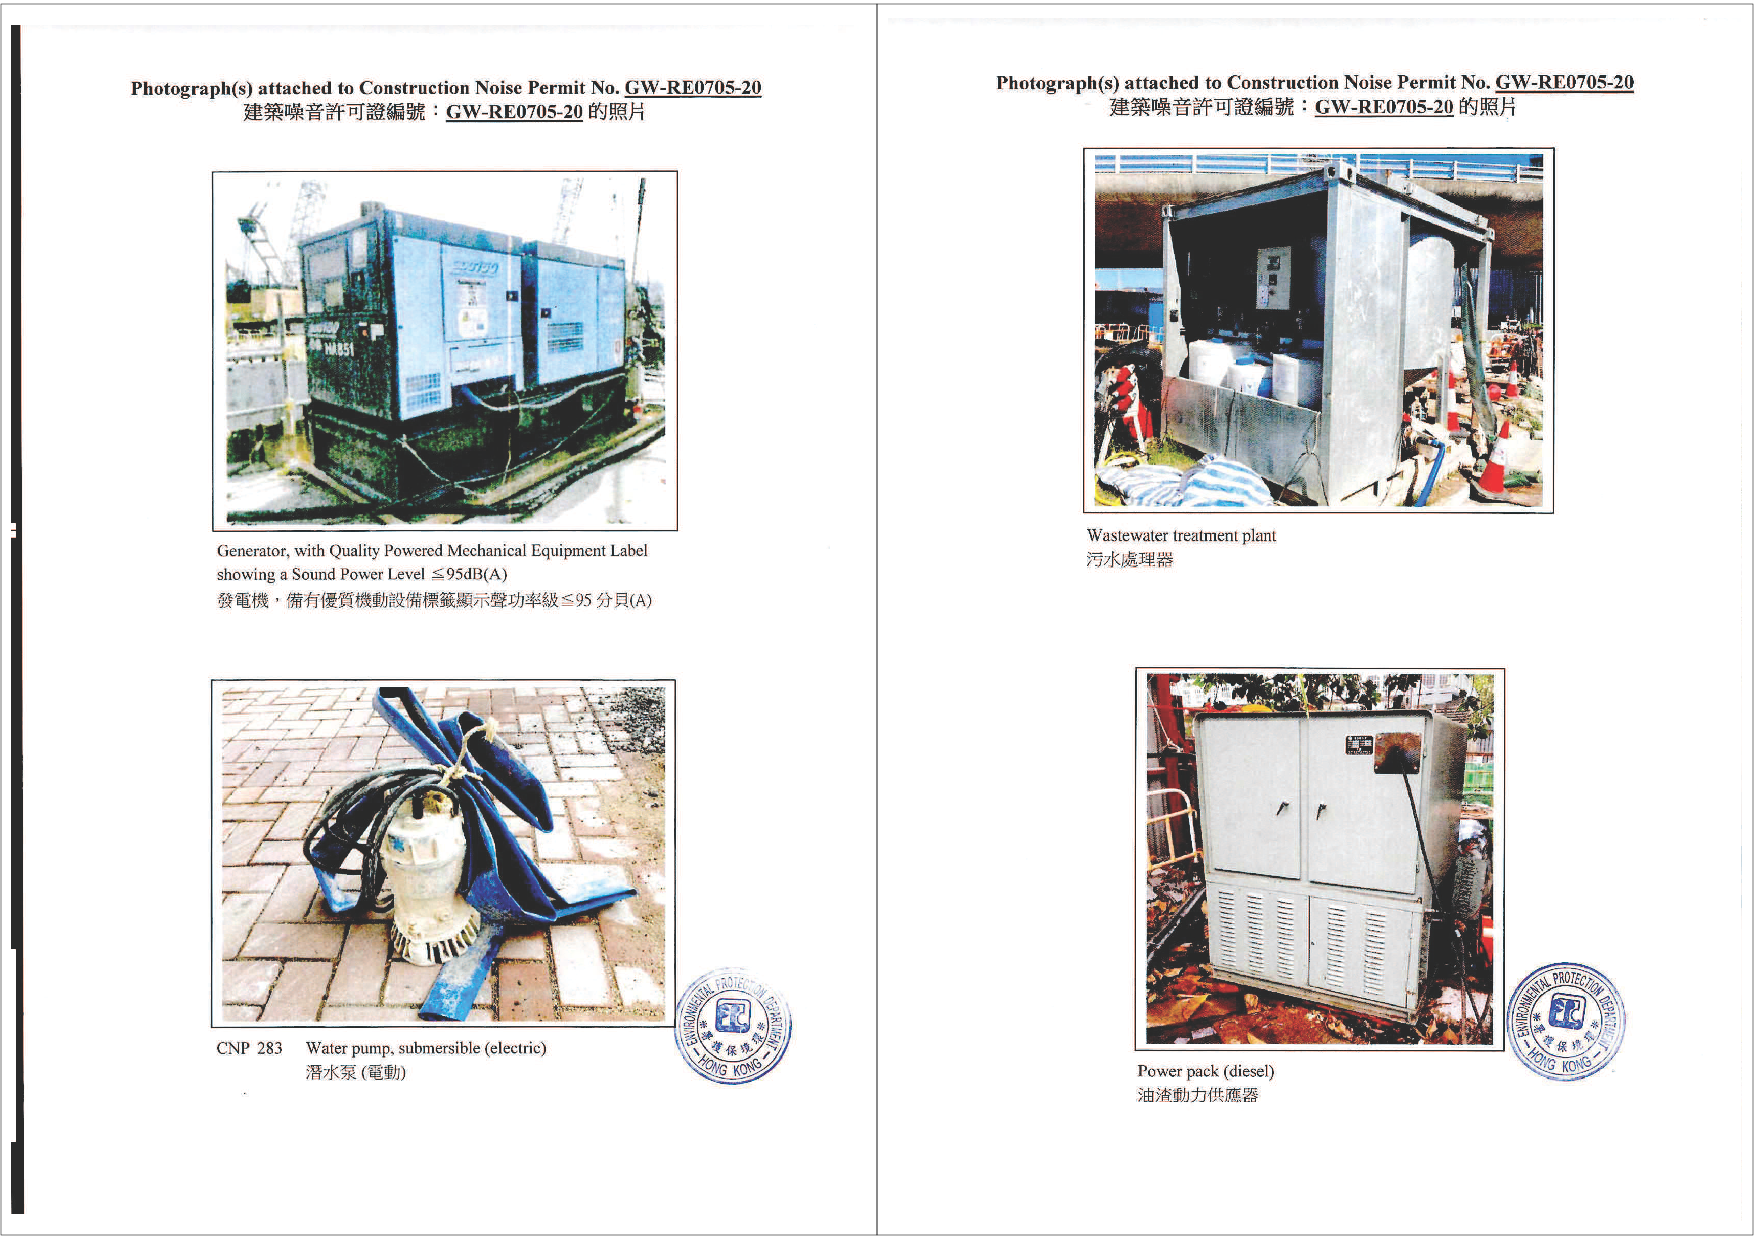
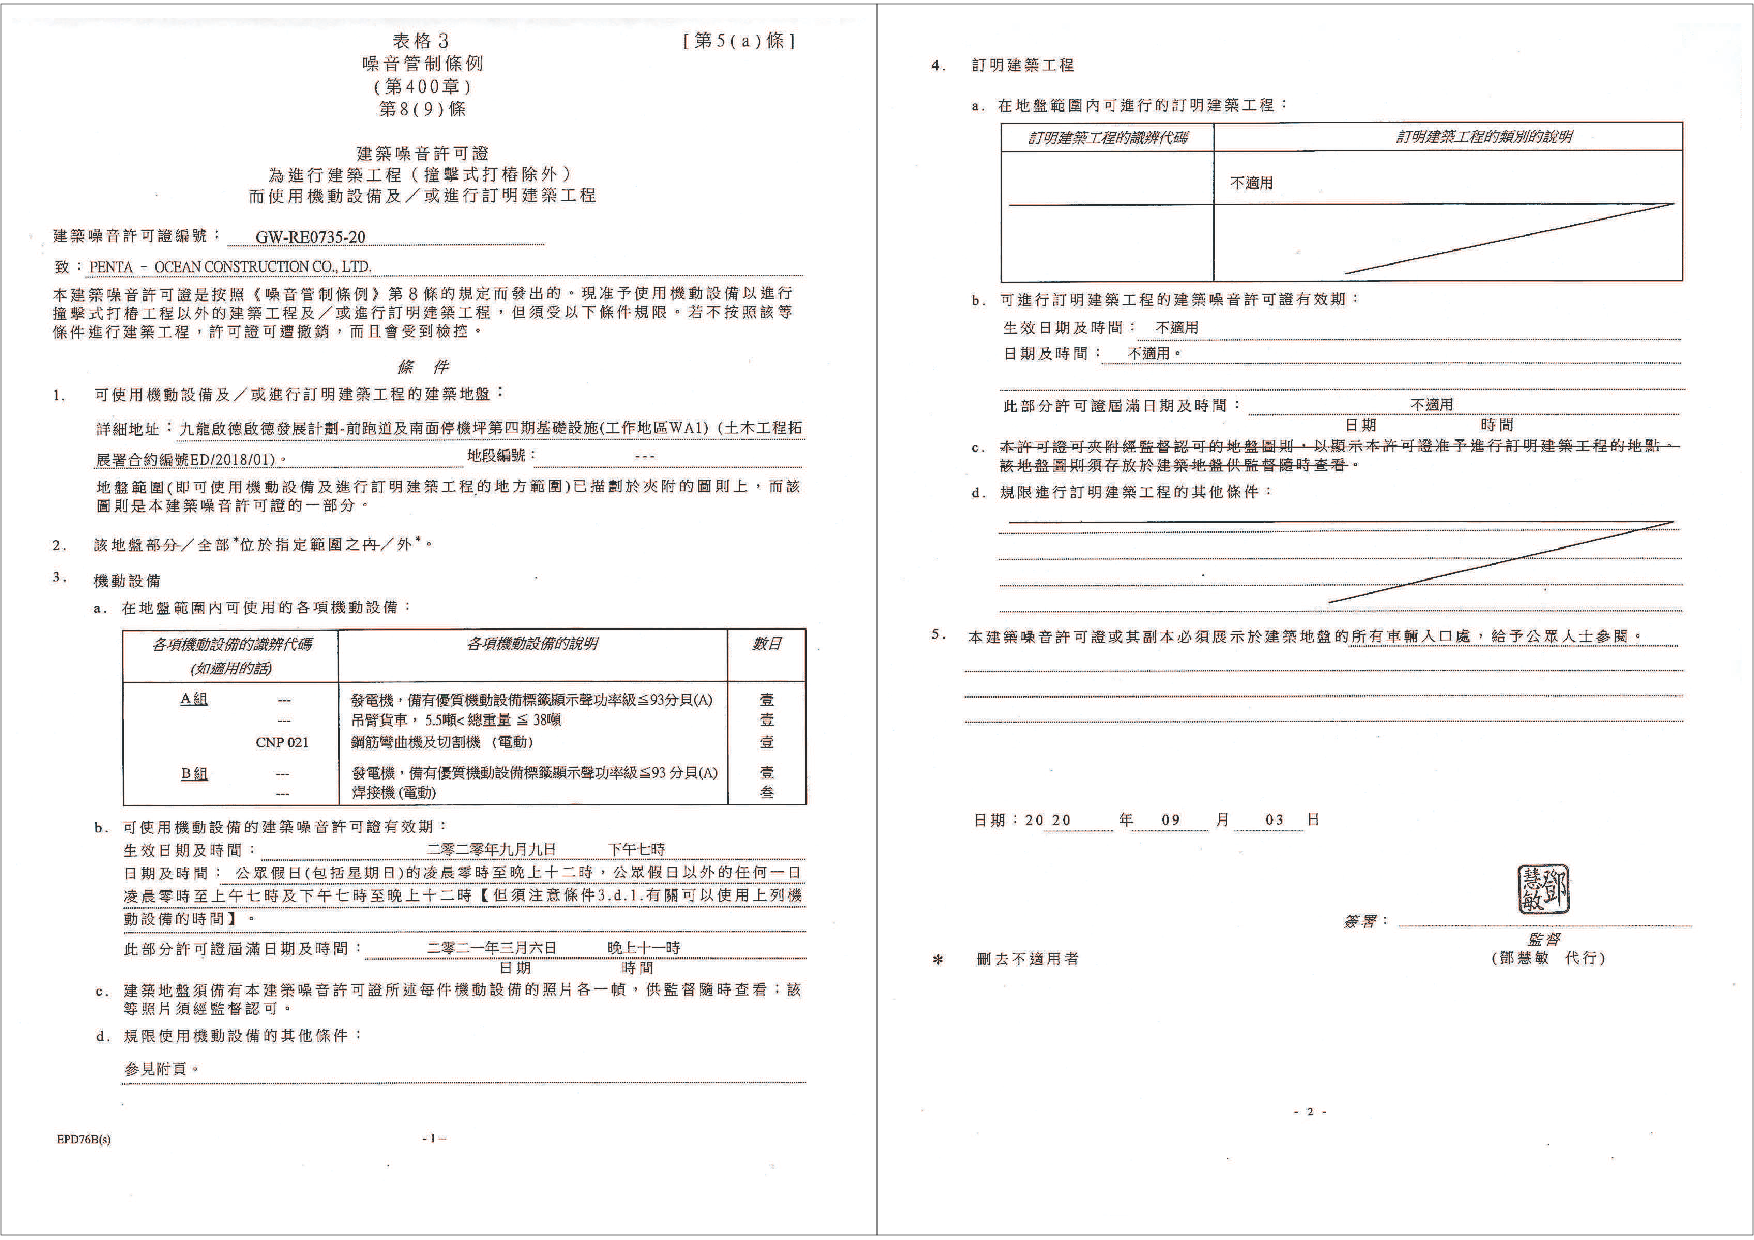
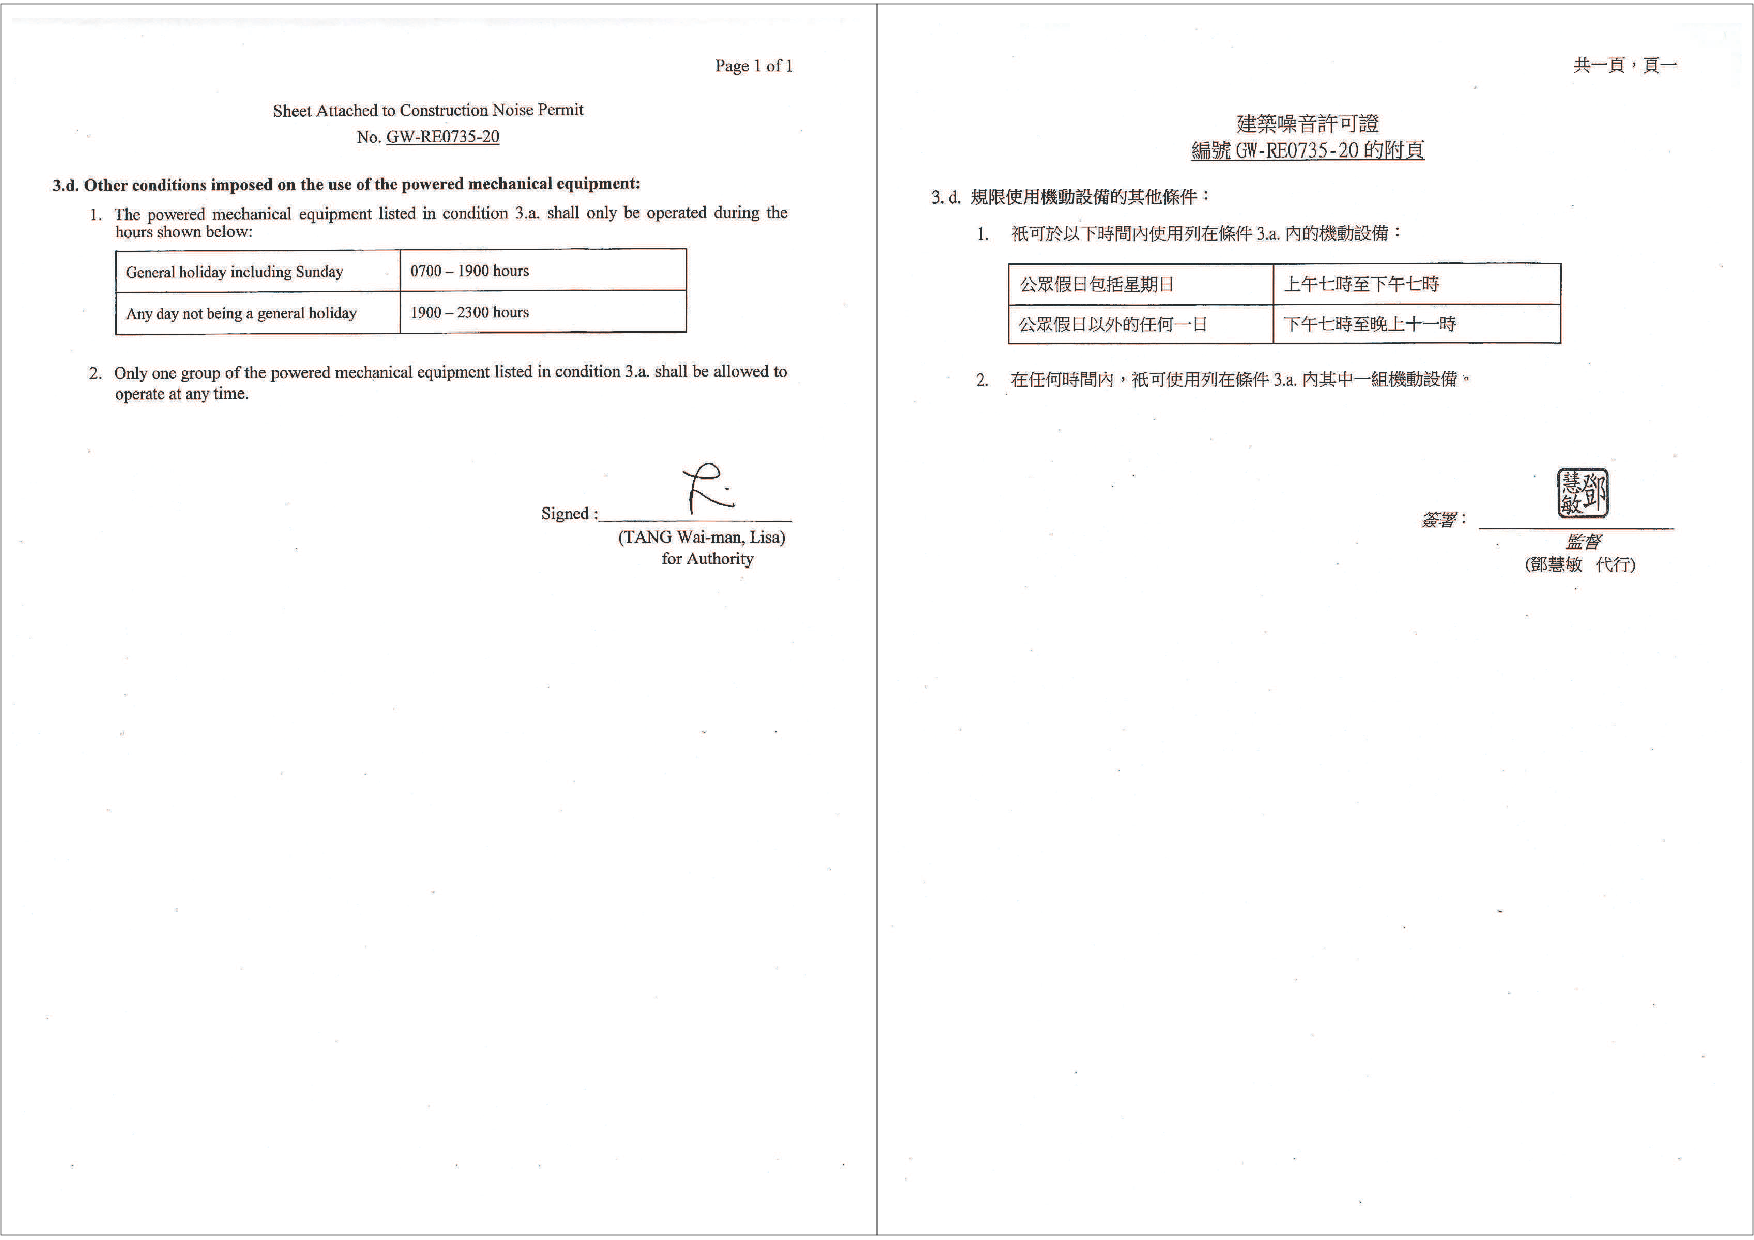
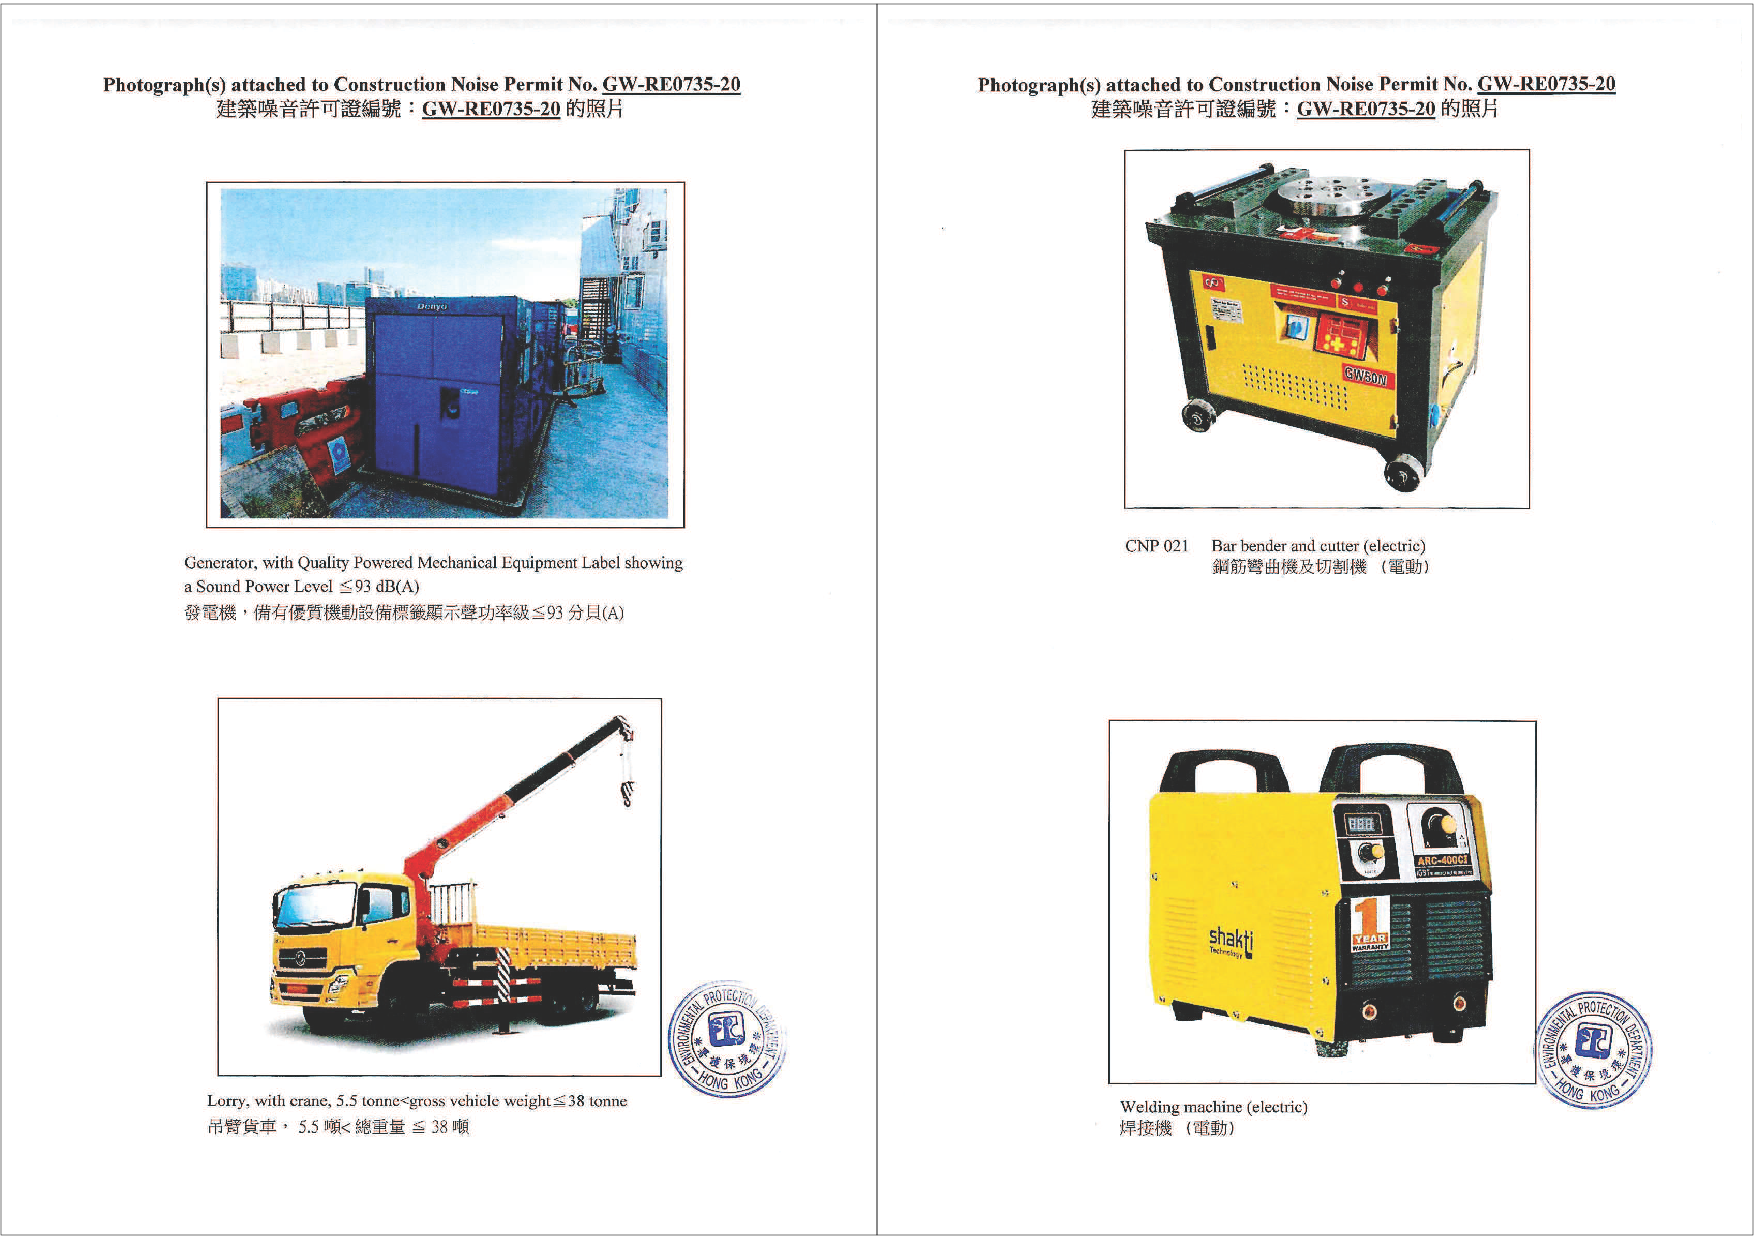
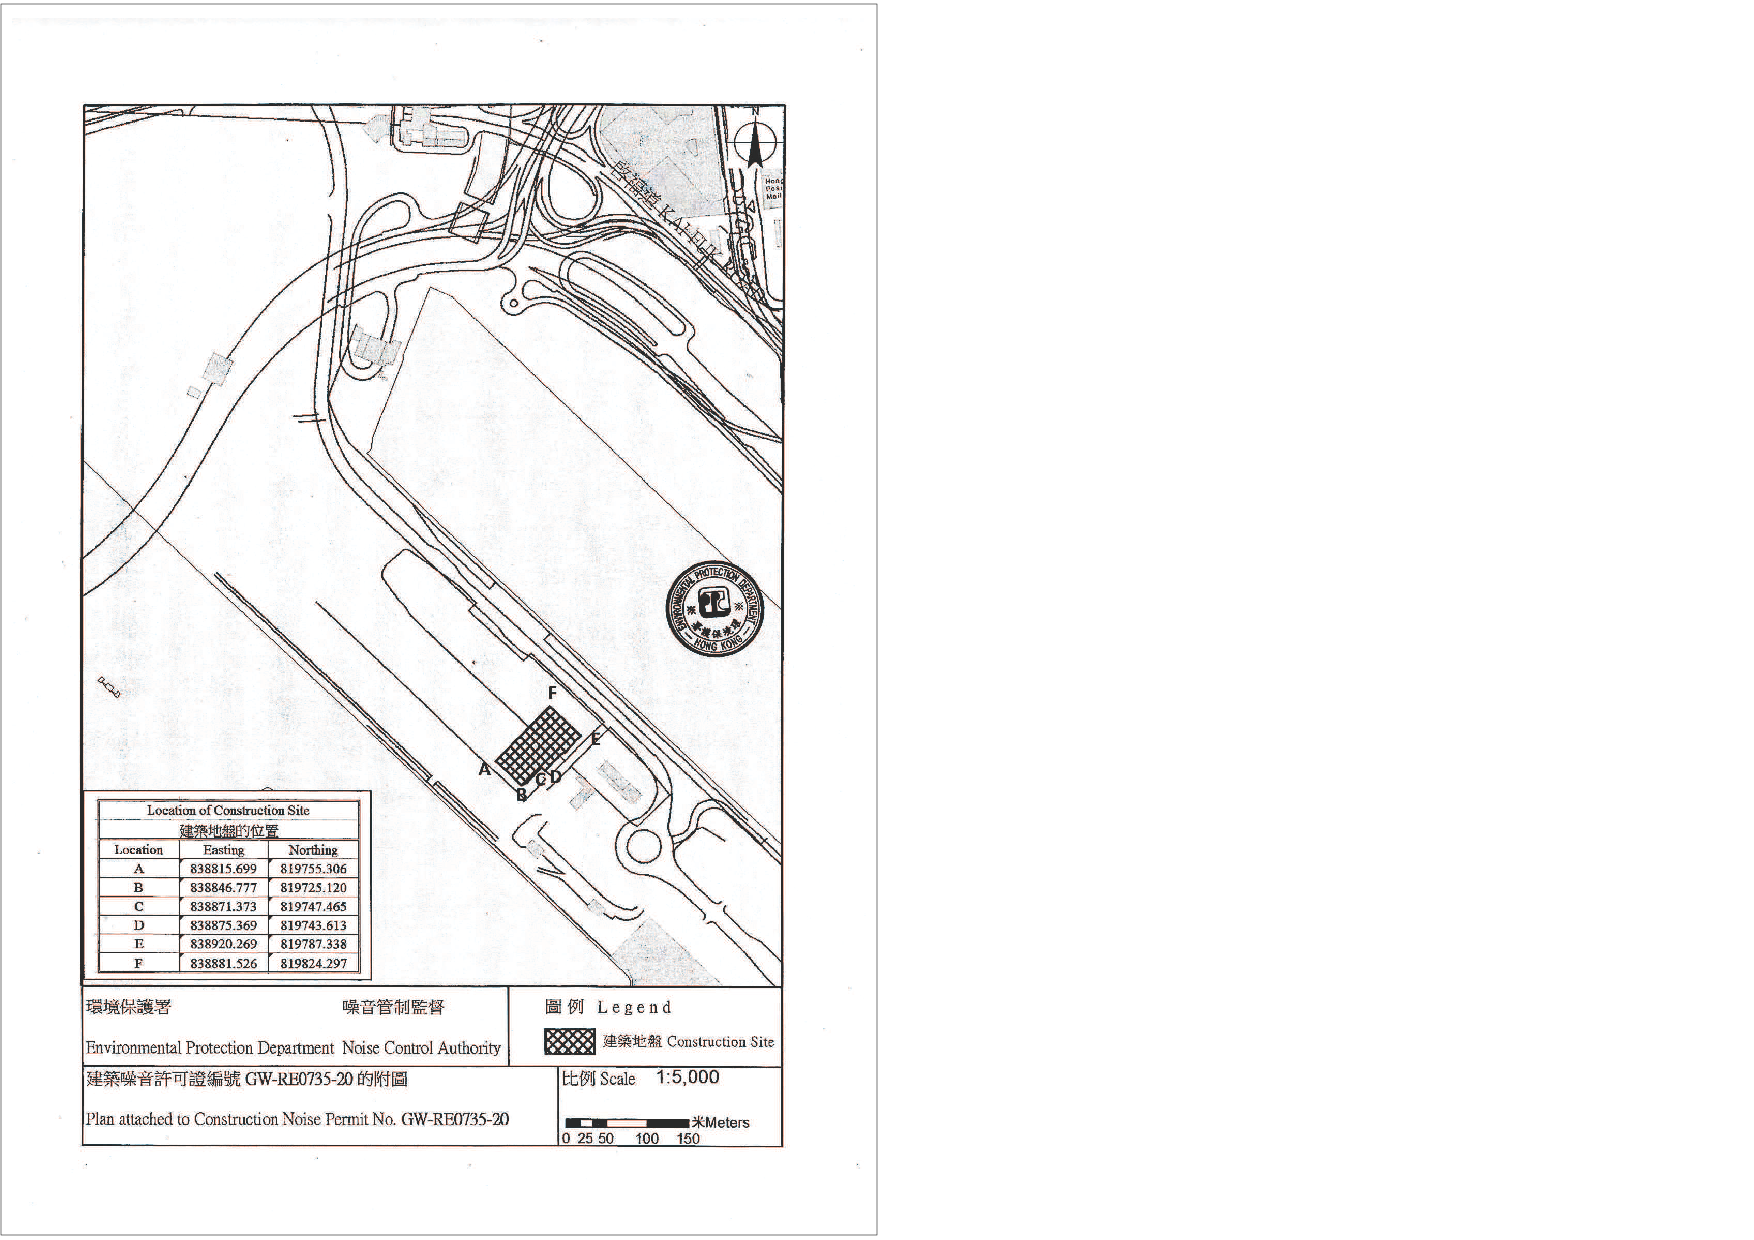
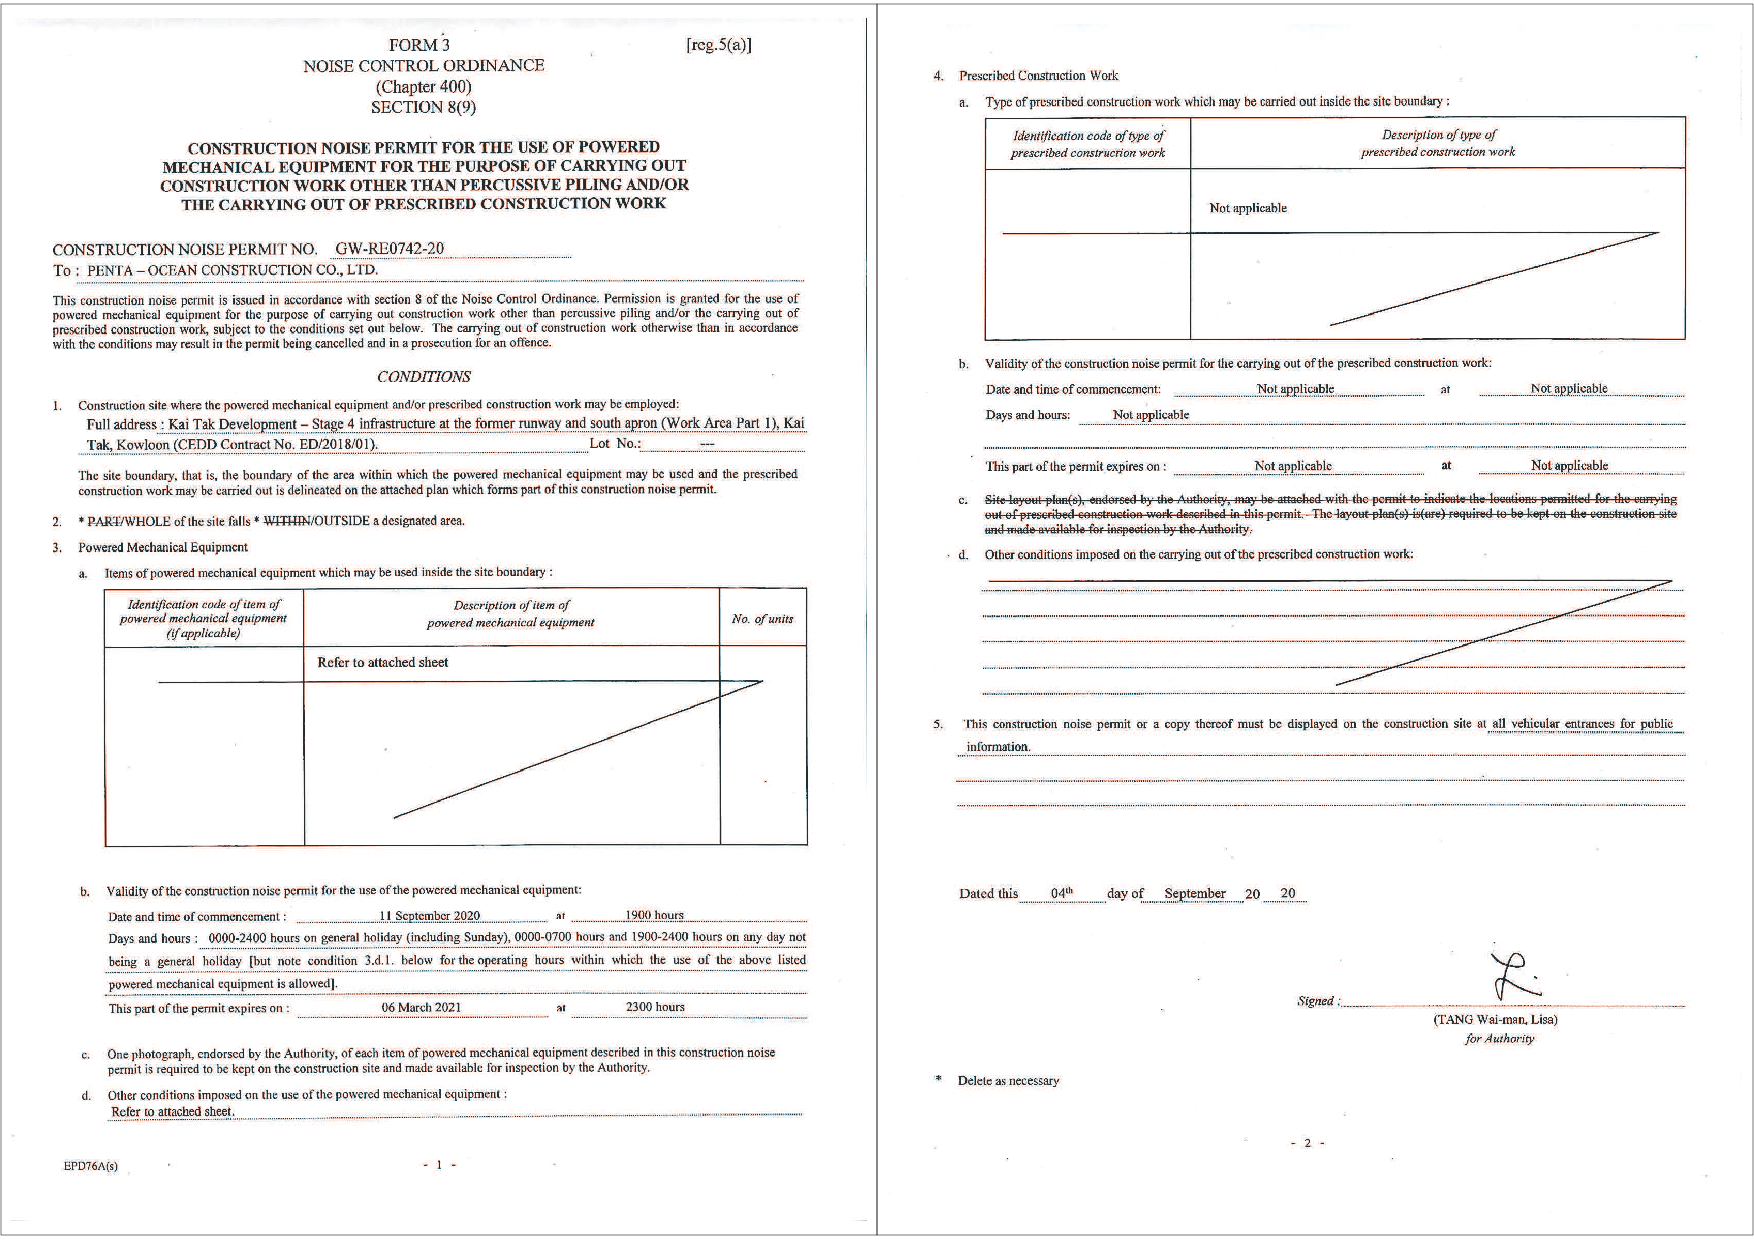
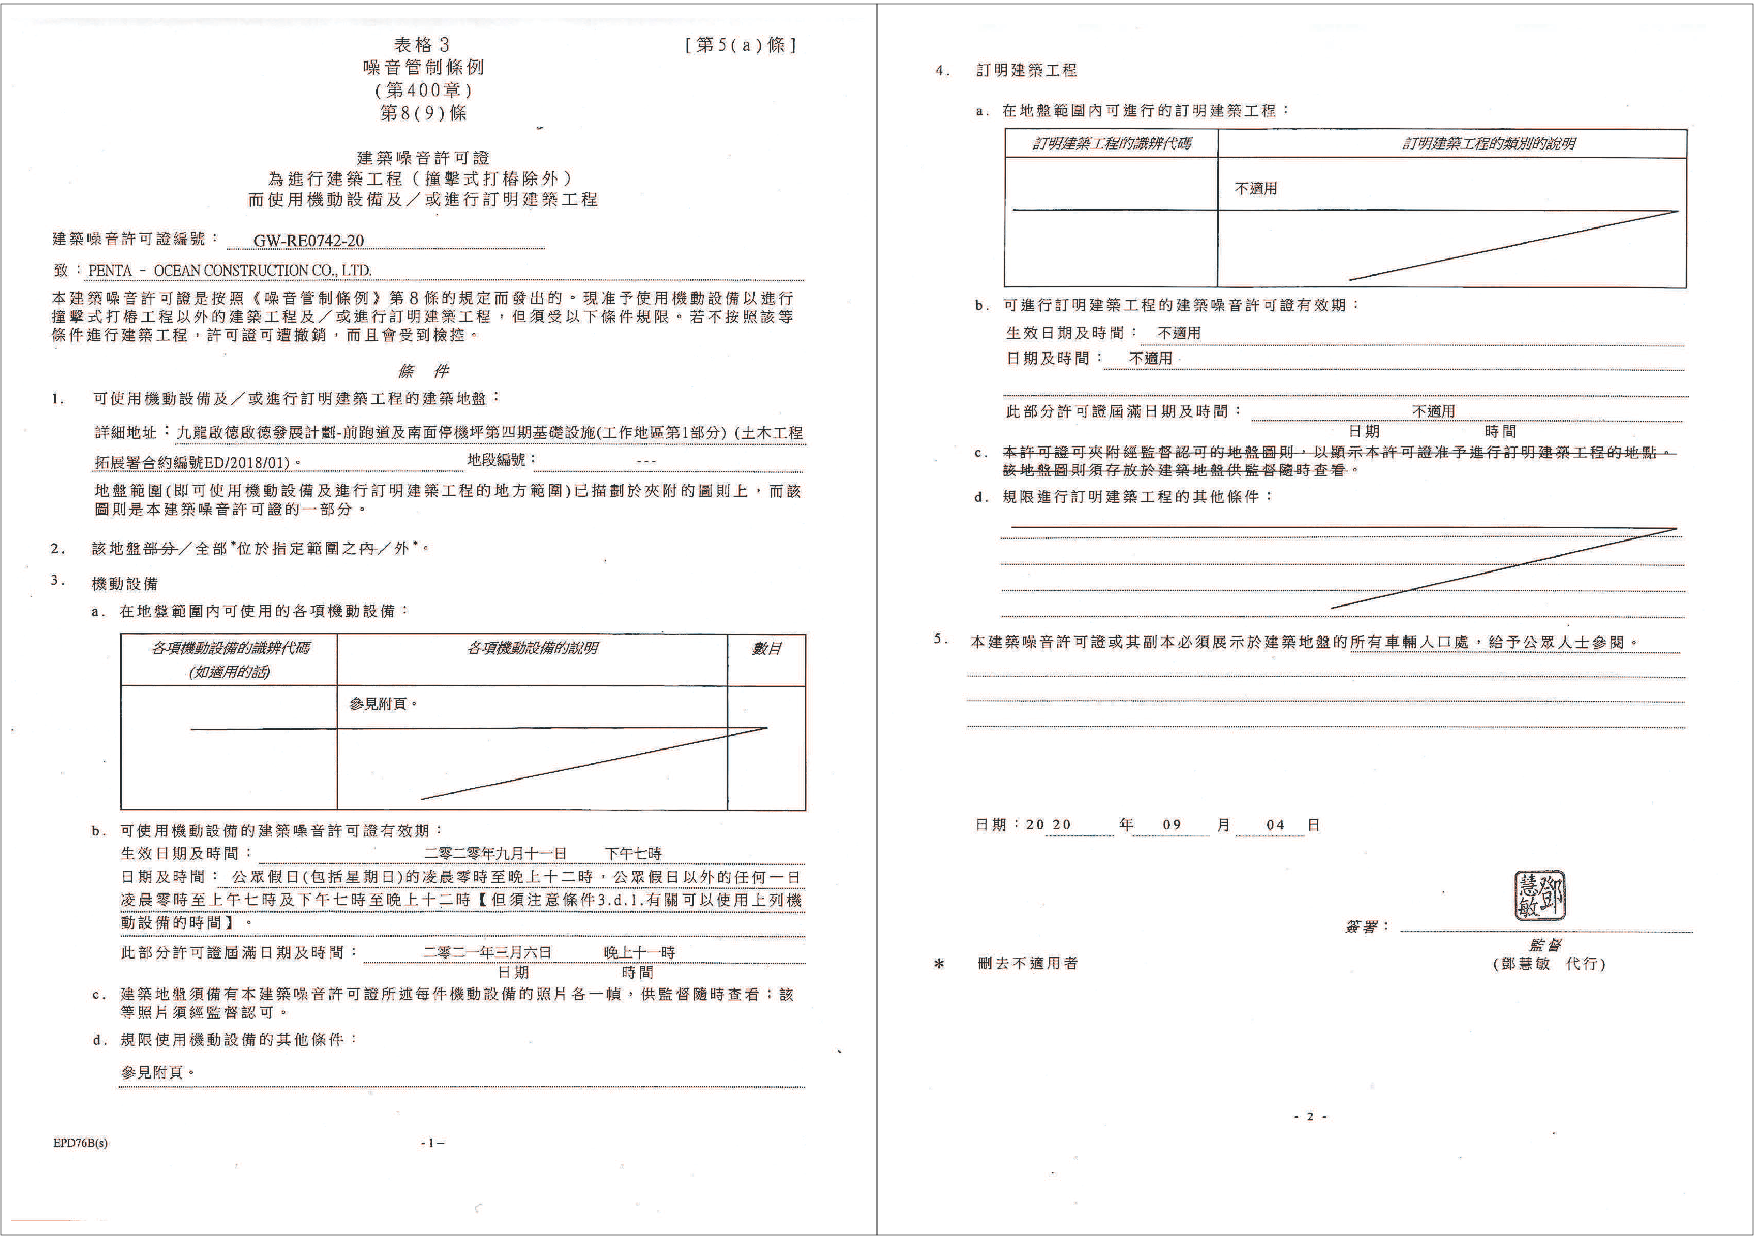
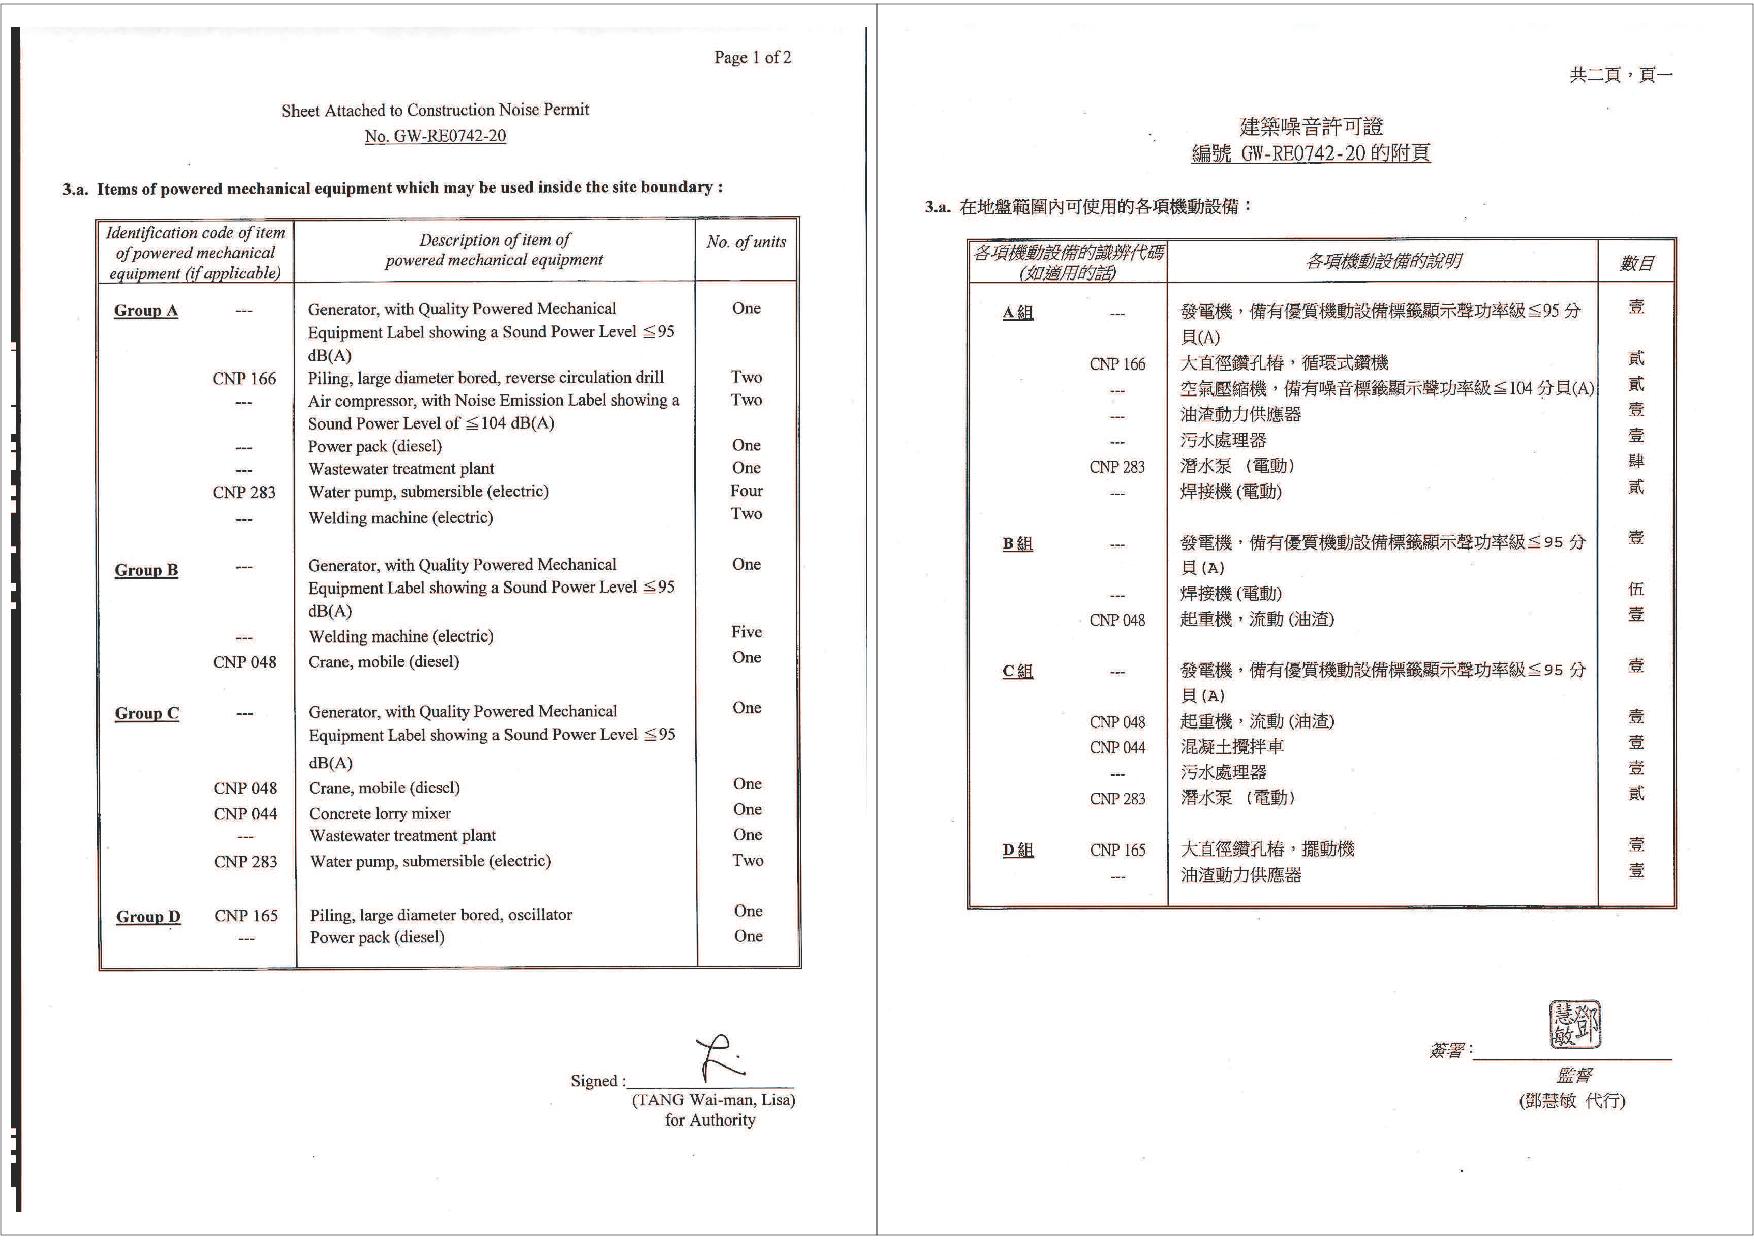
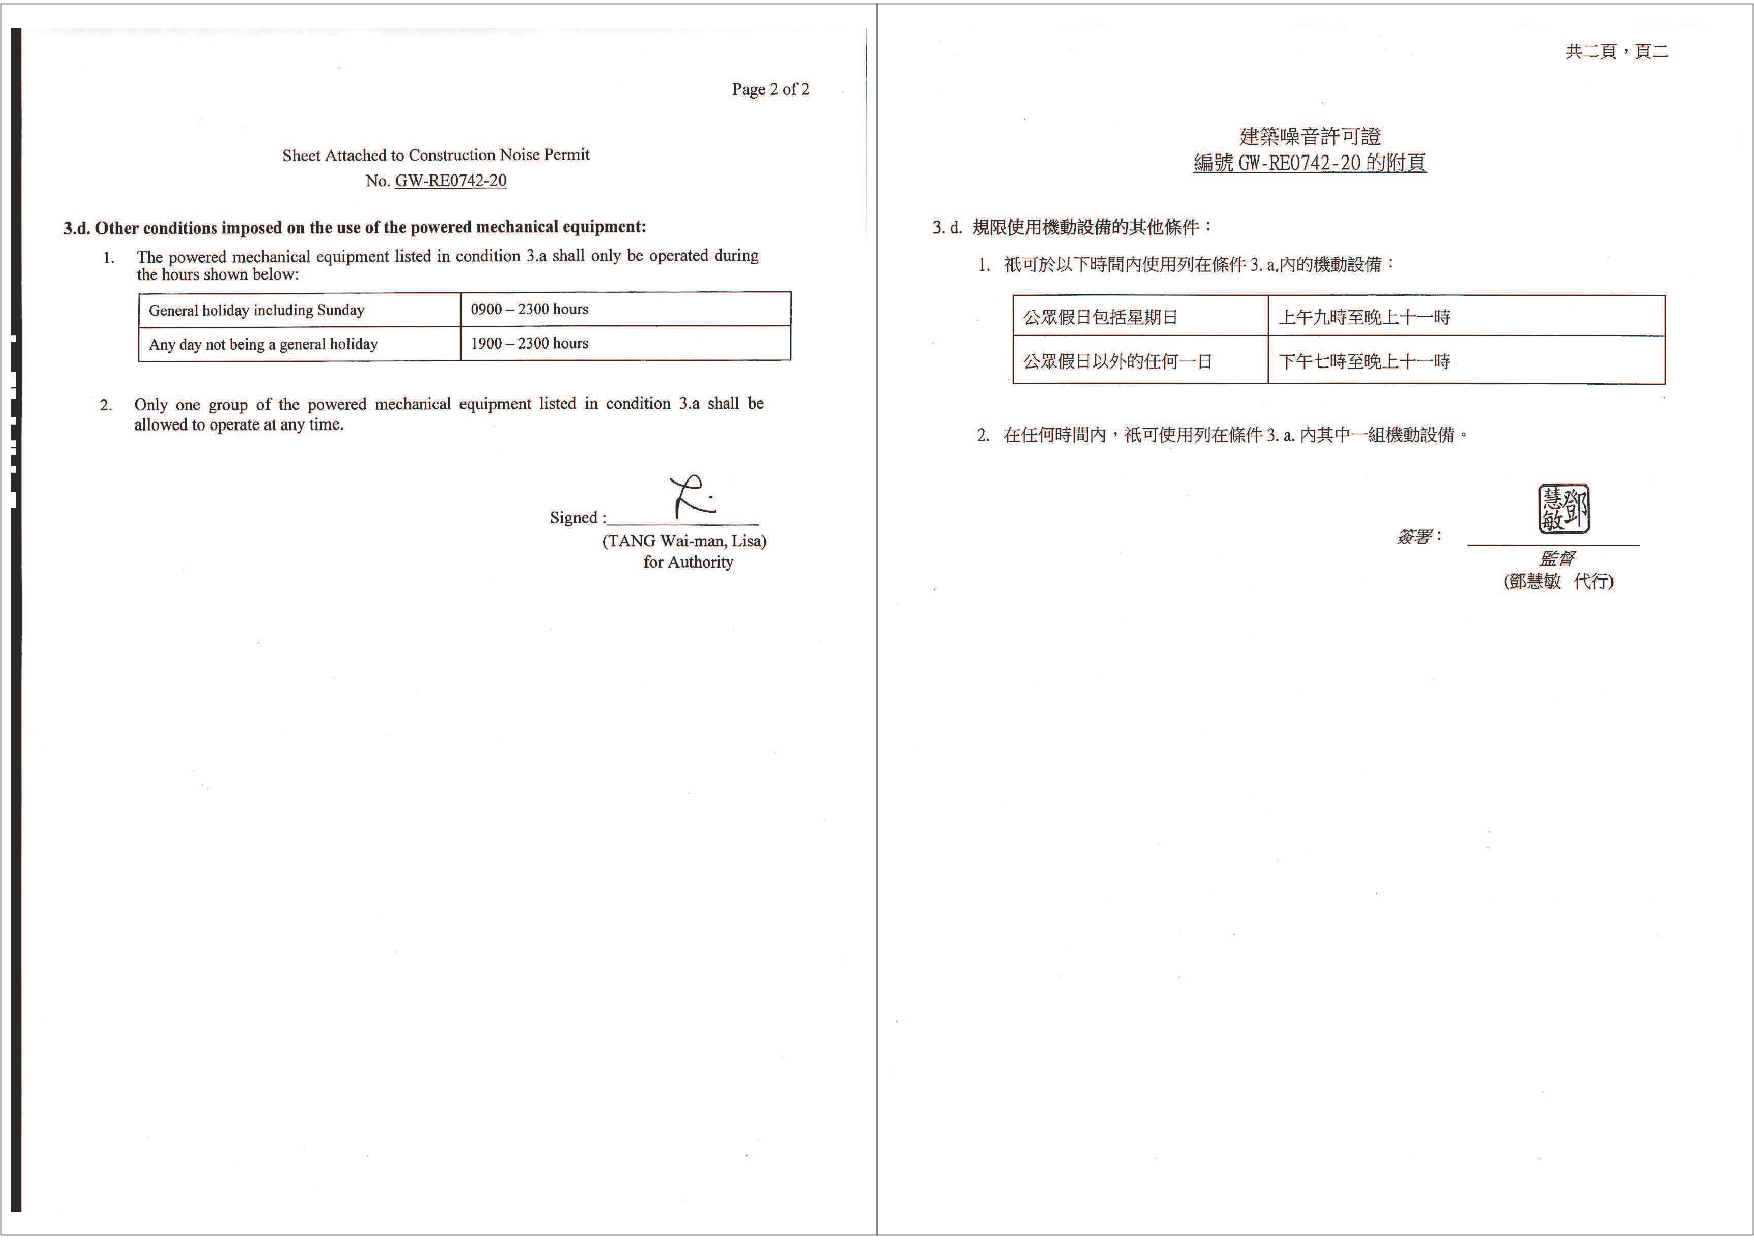
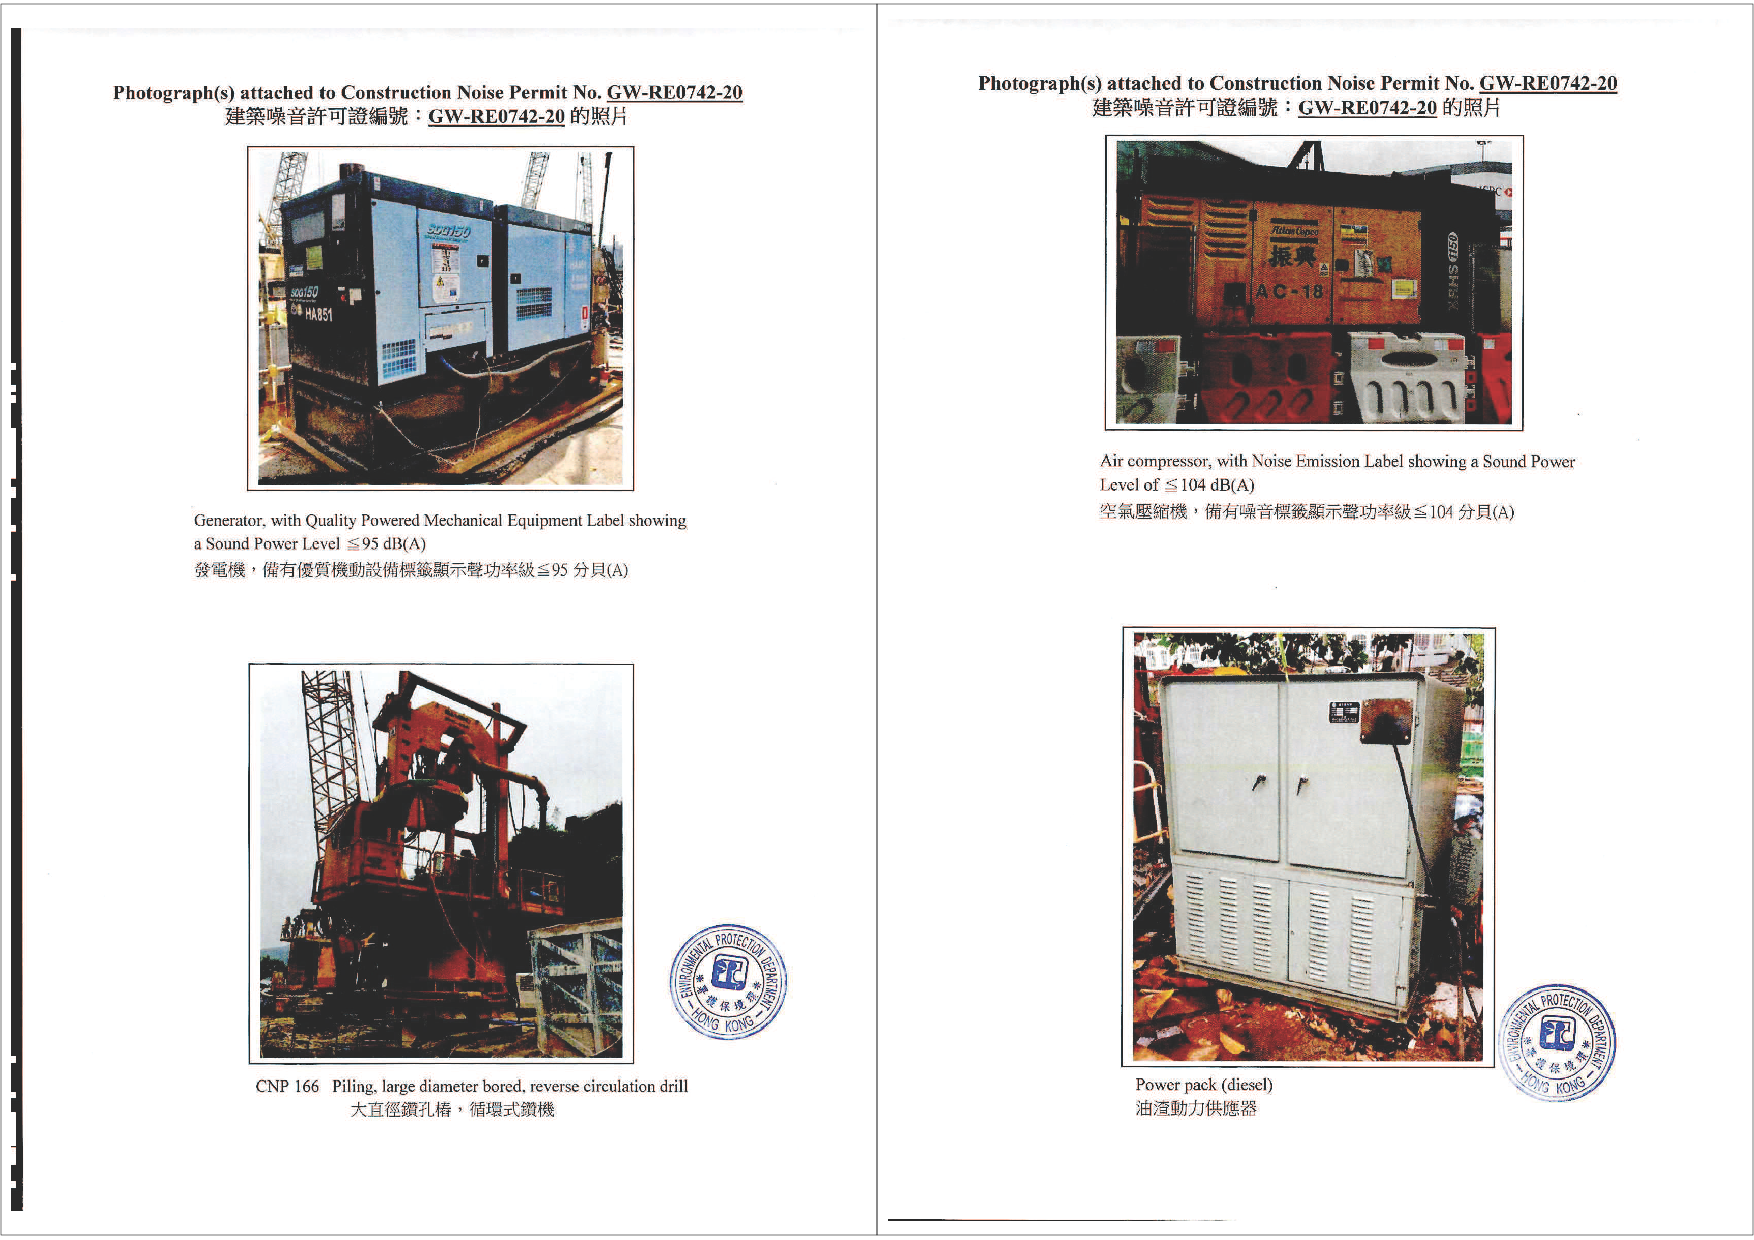
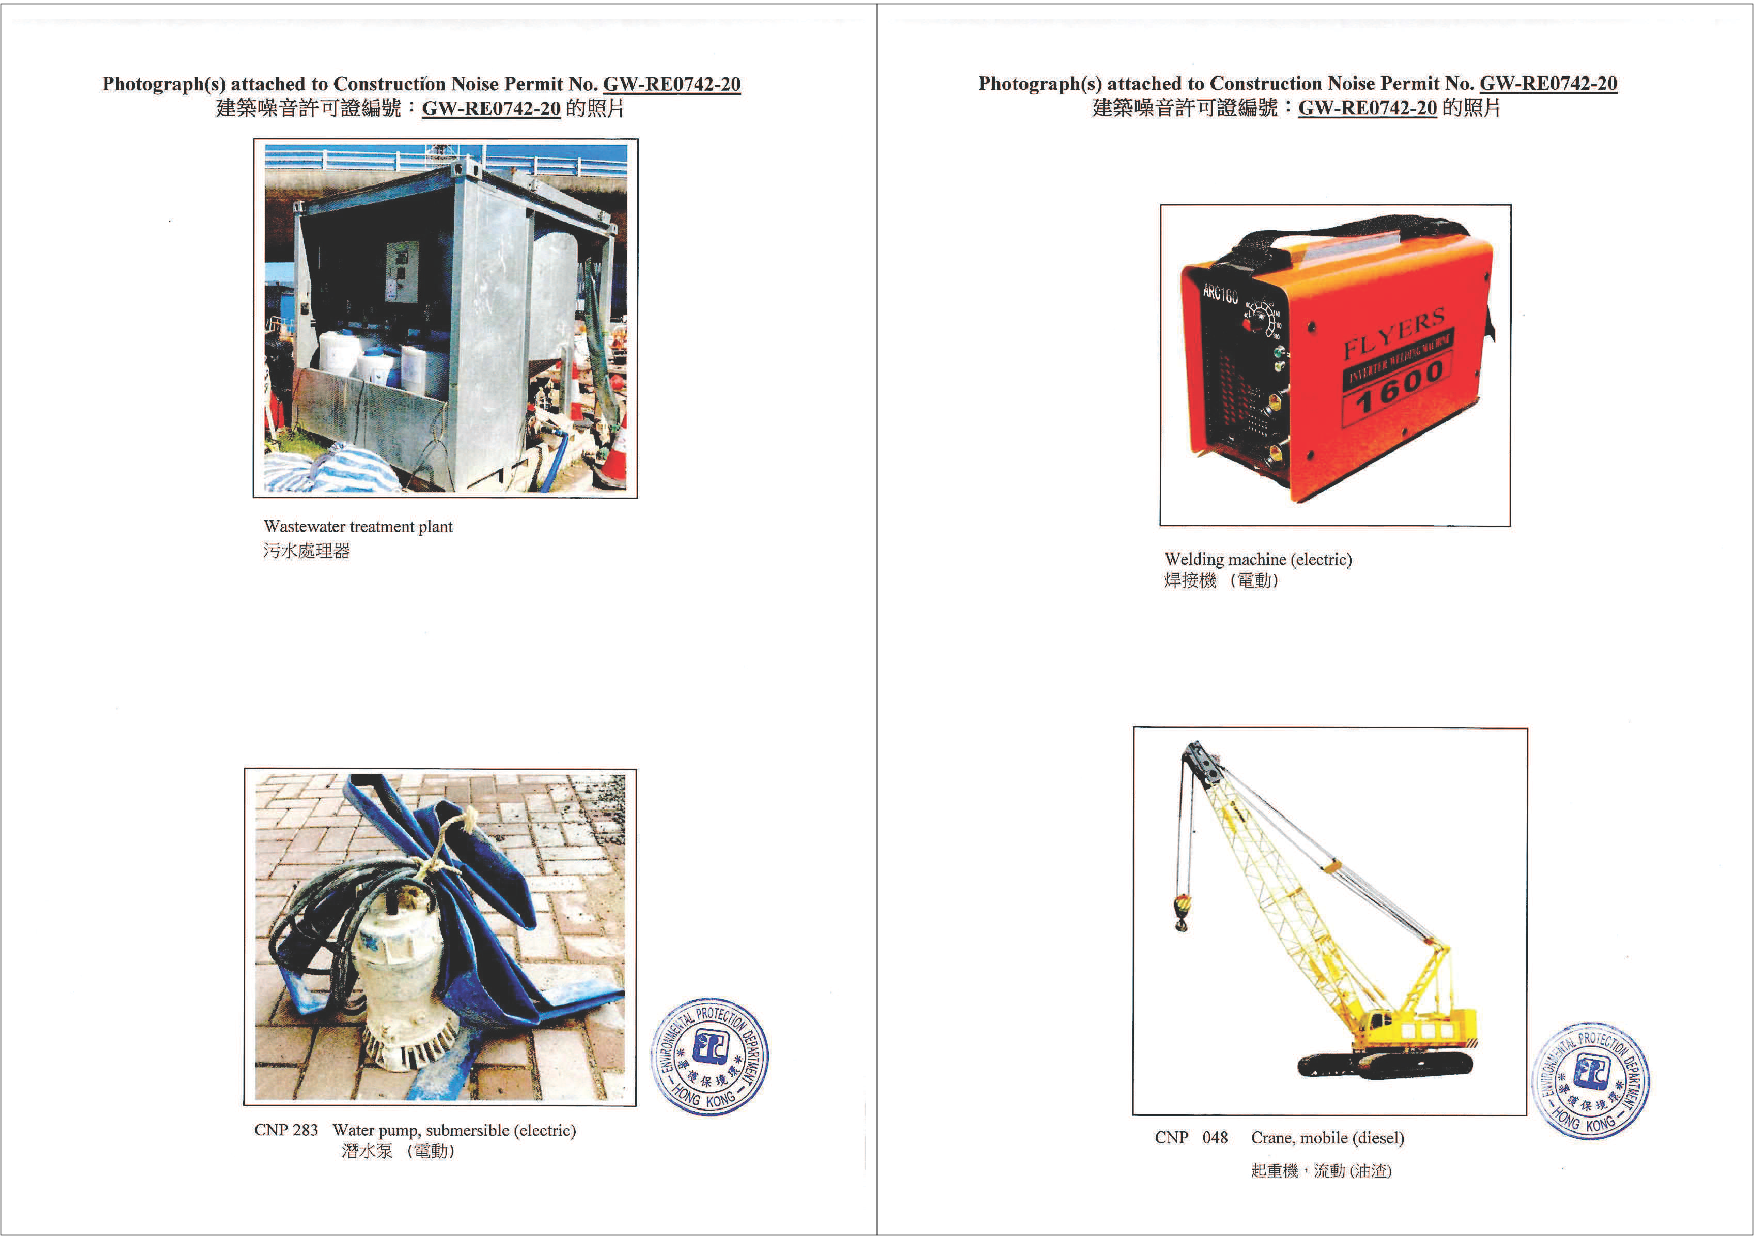
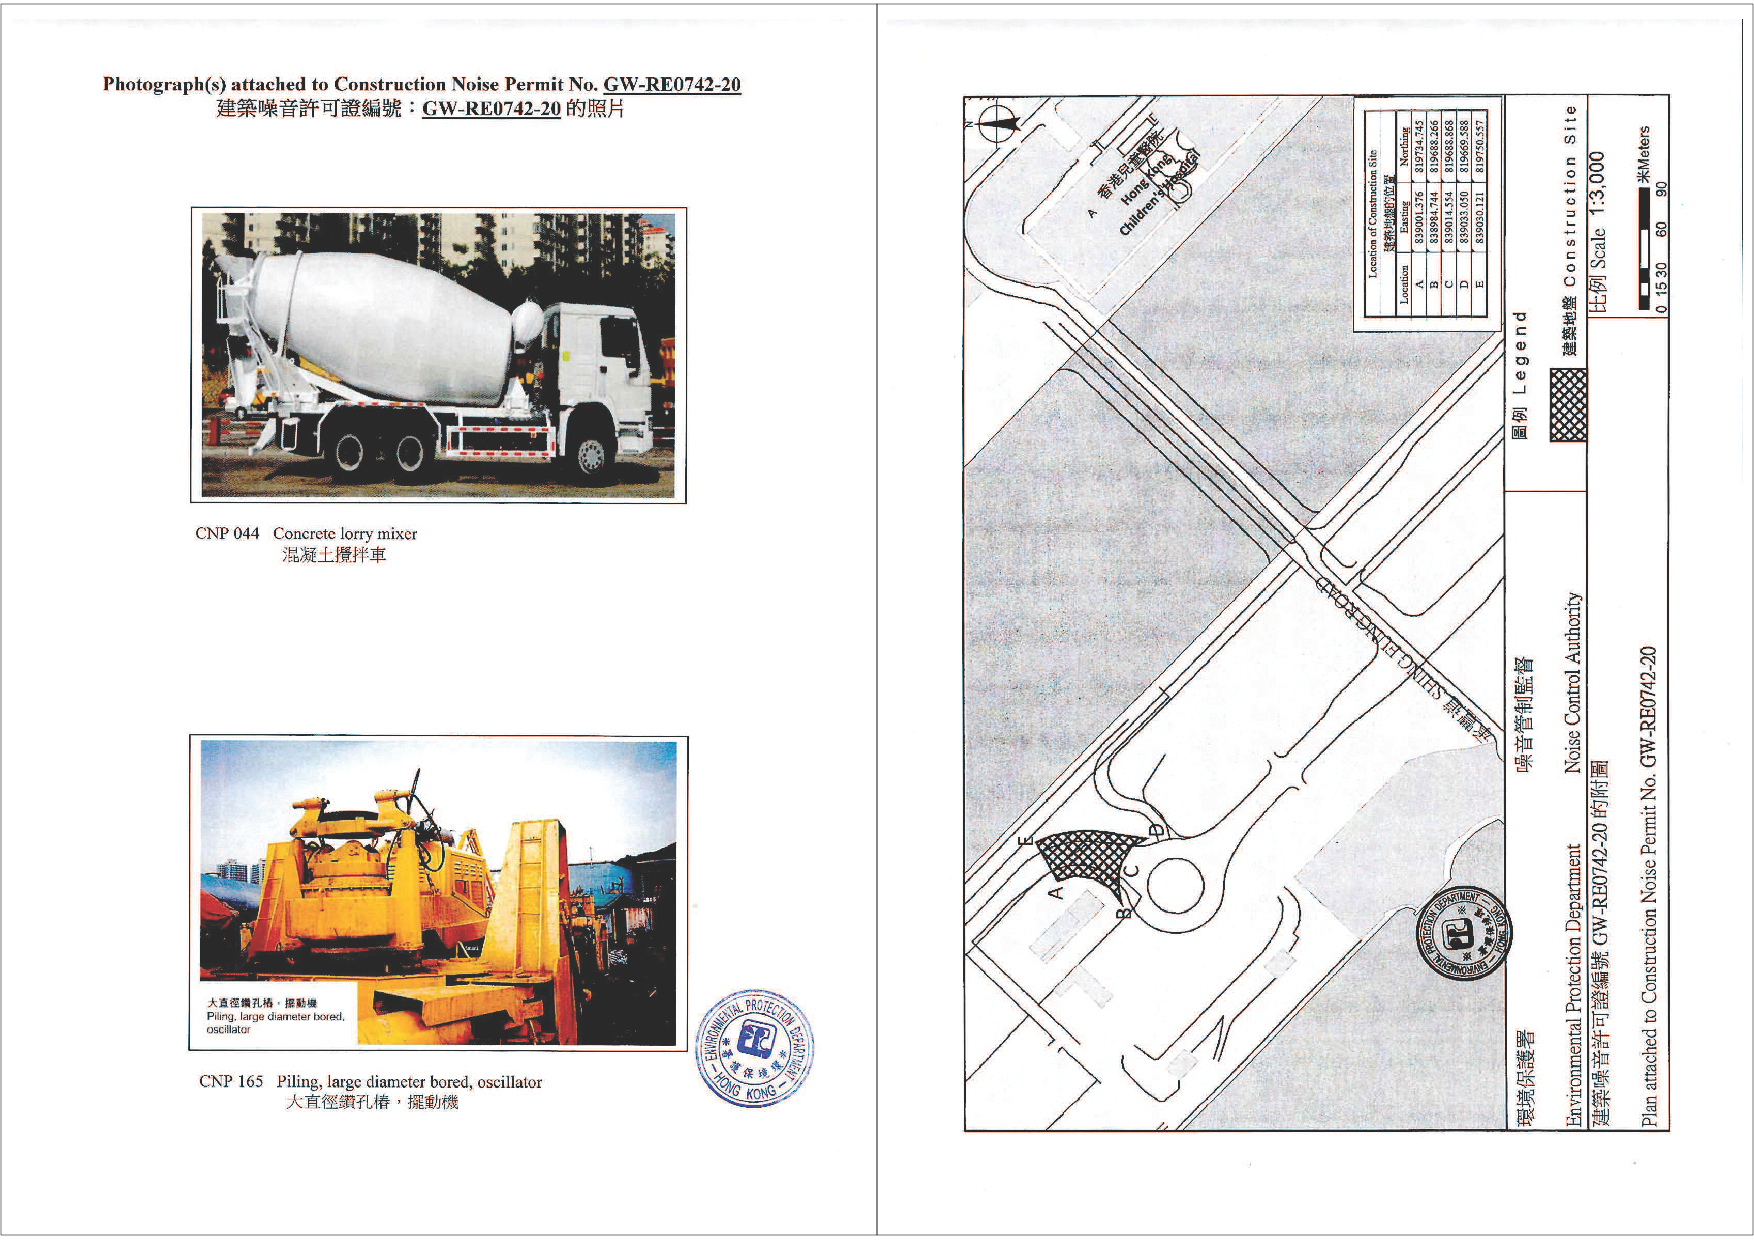
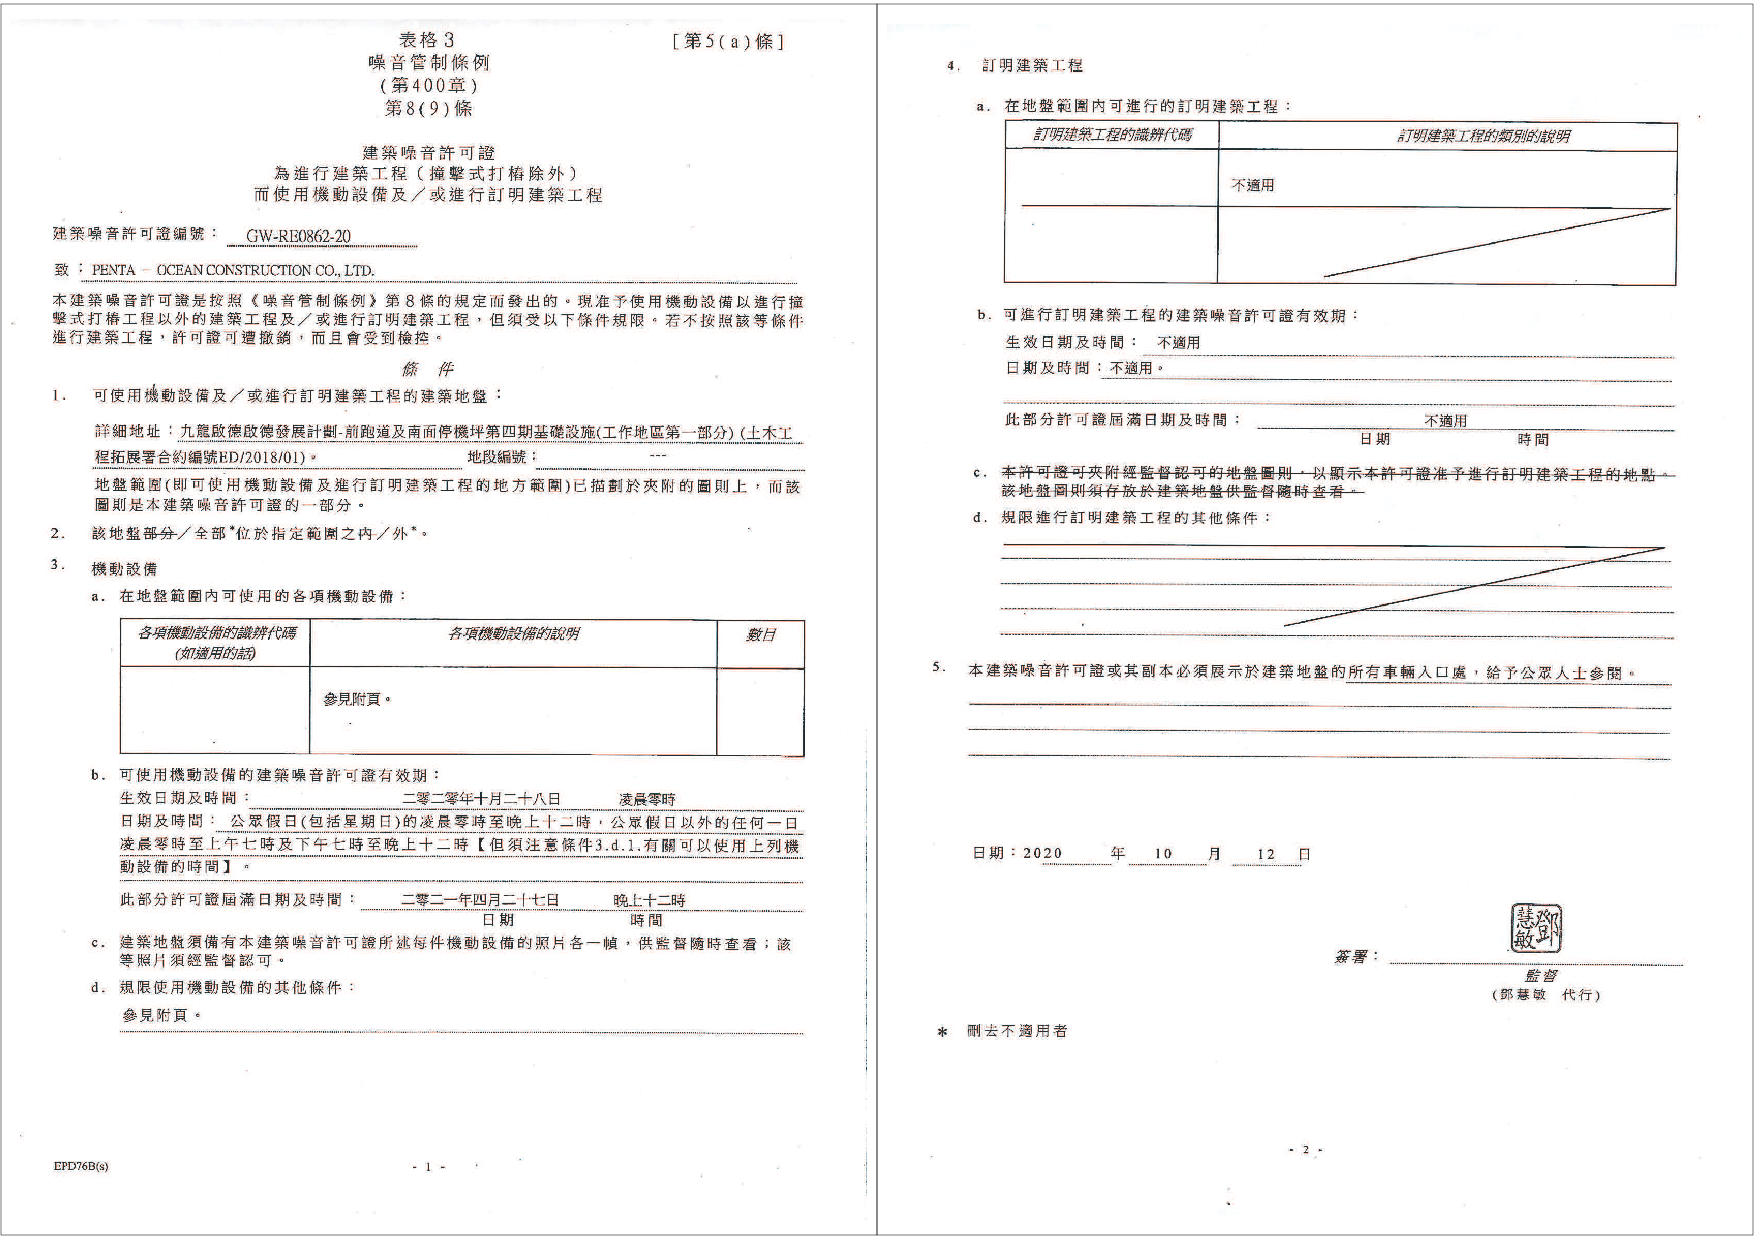
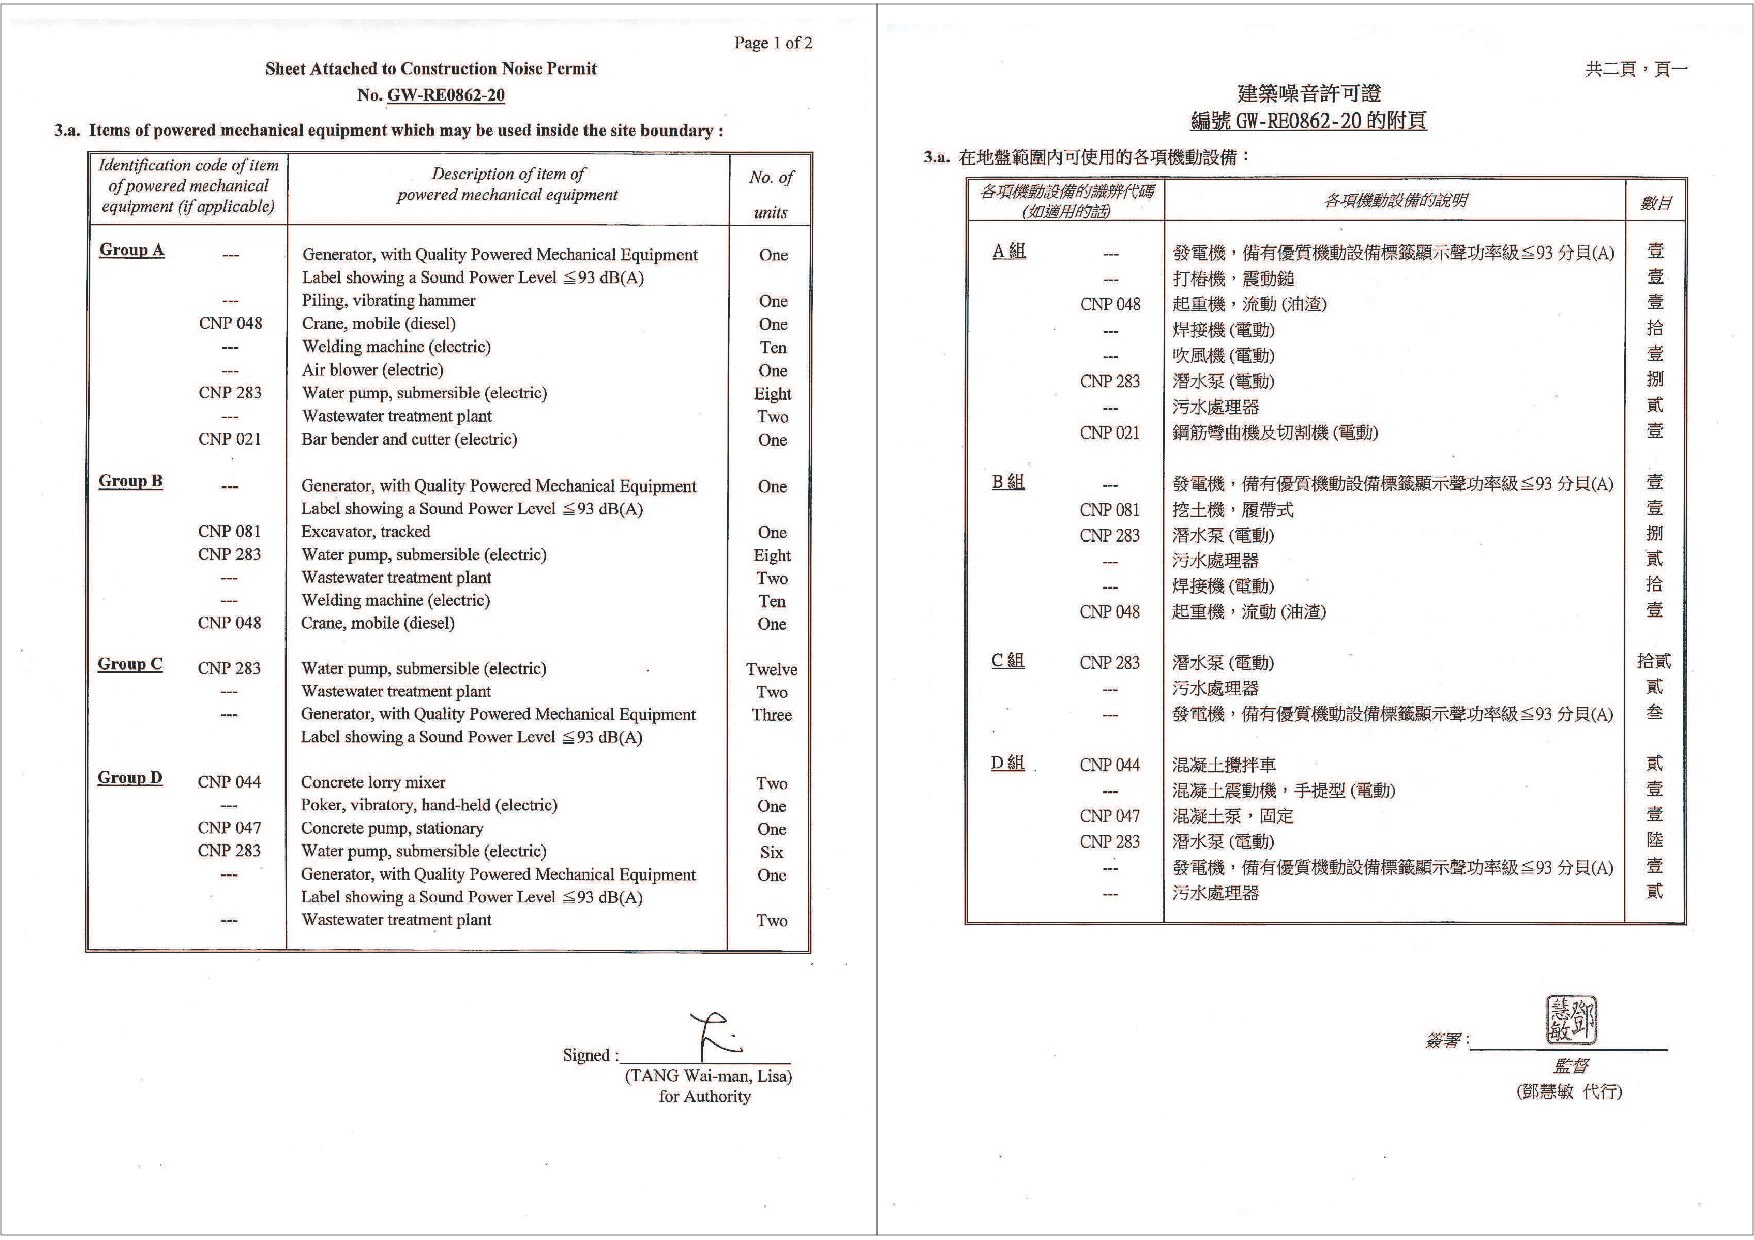
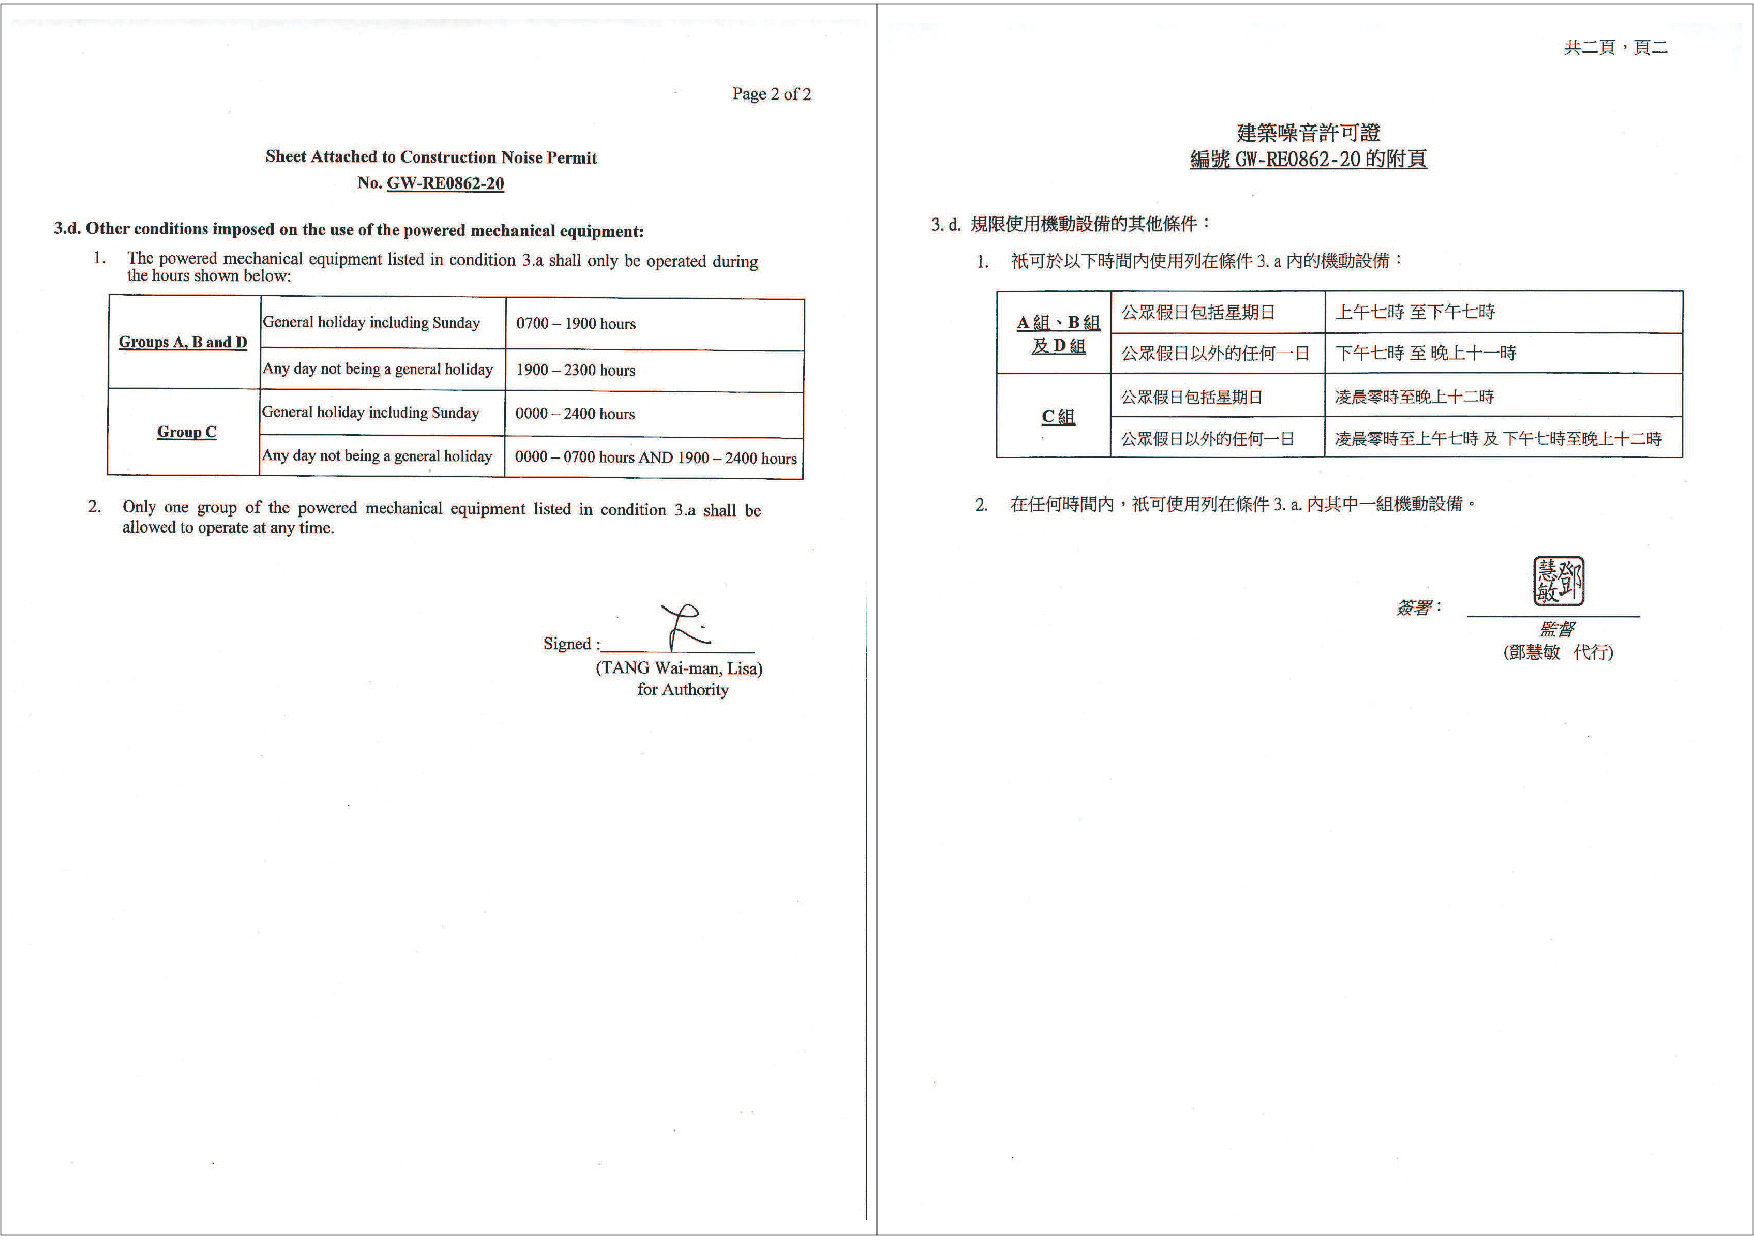
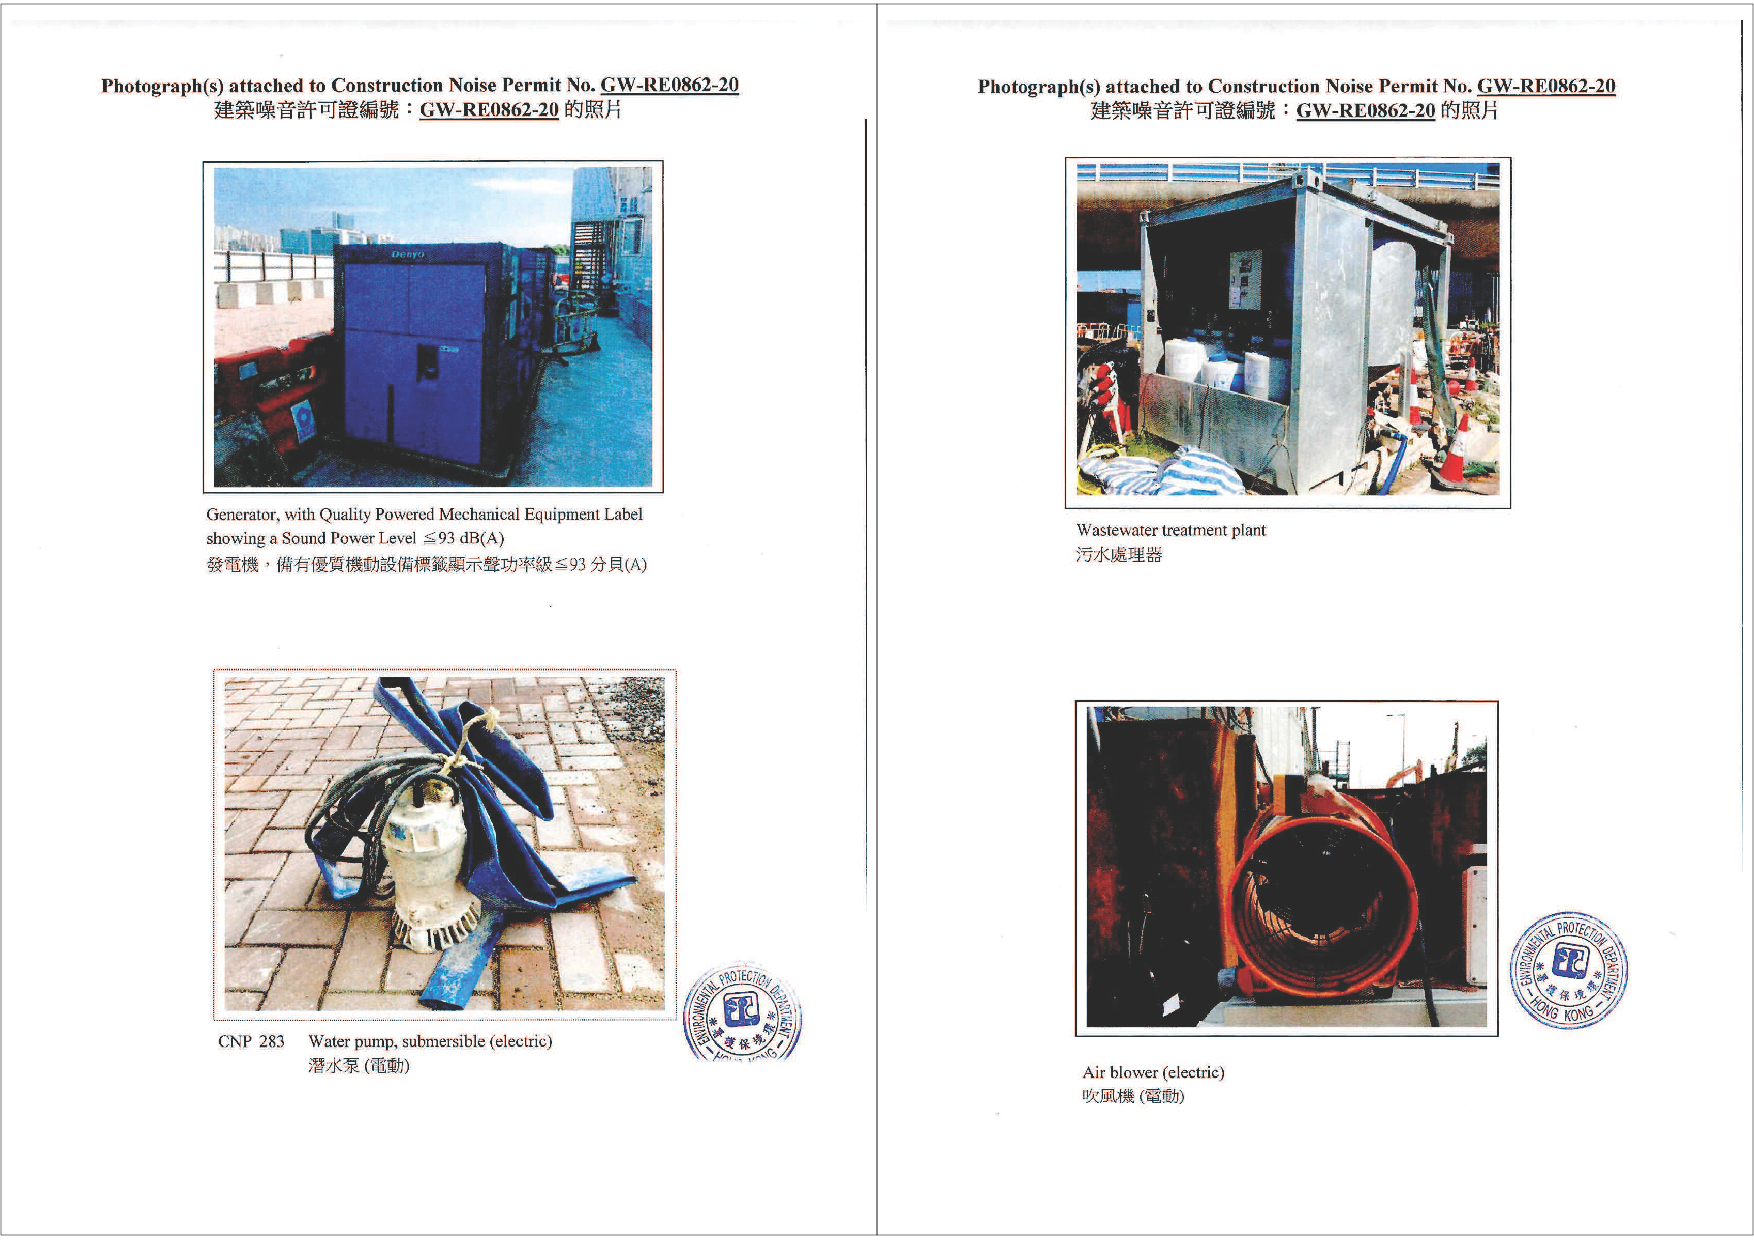
Construction Noise Permit |
GW-RE0173-20 |
28 Apr 2020 |
27 Oct 2020 |
|
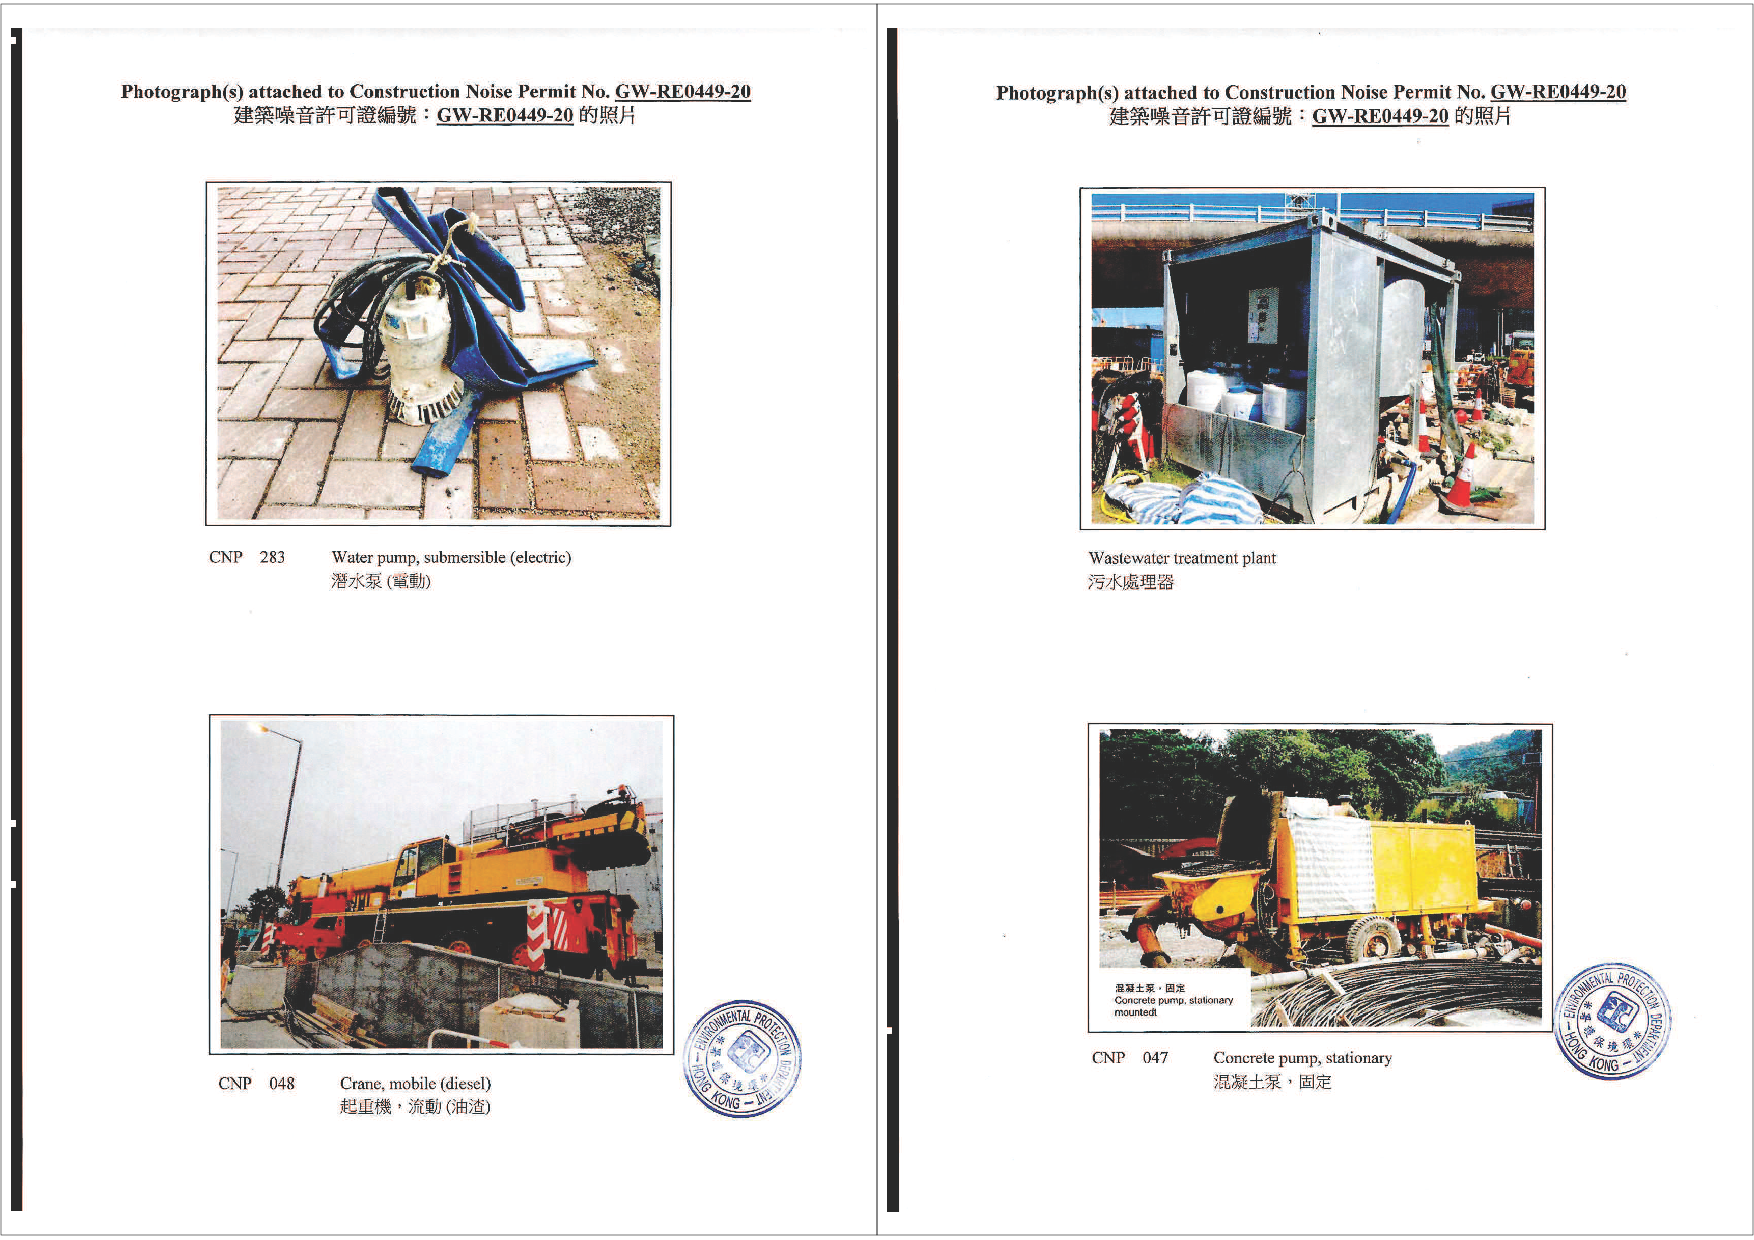
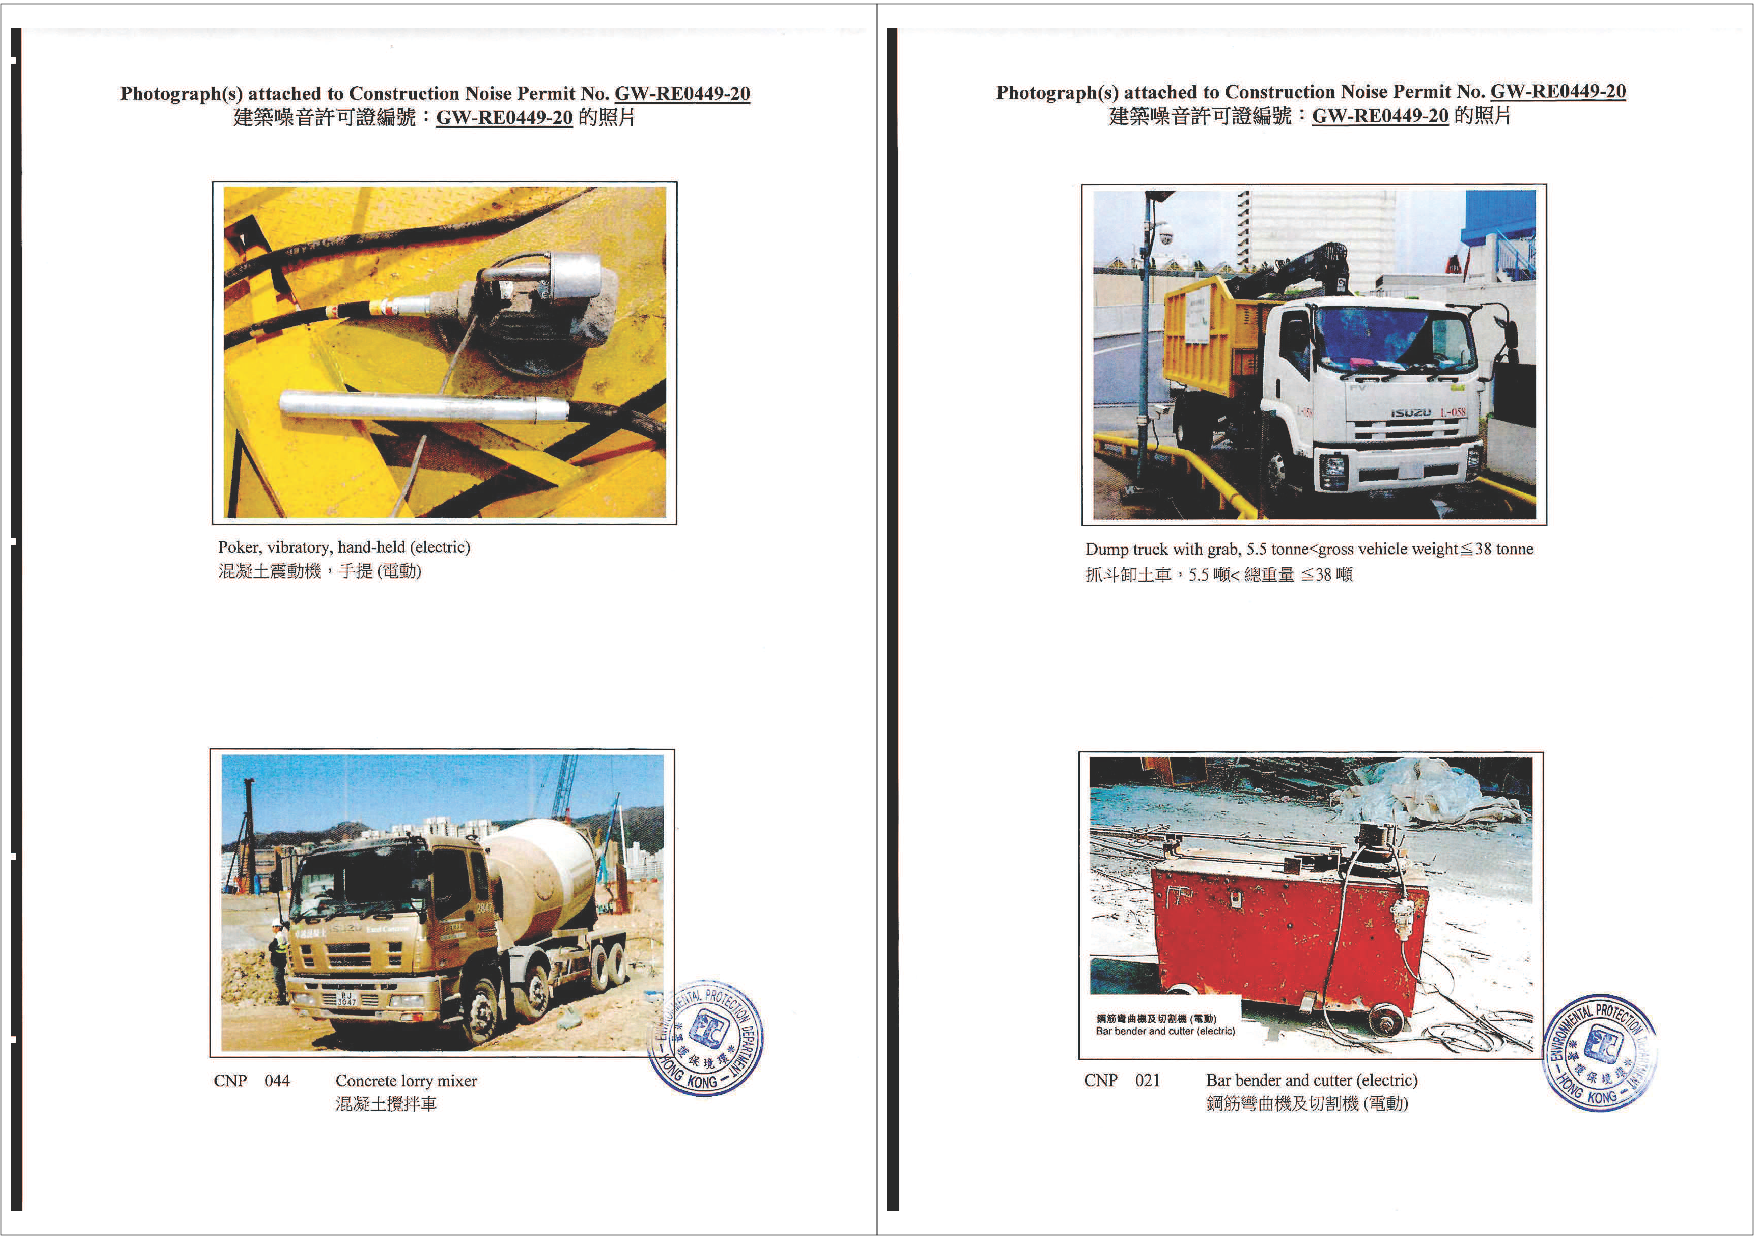
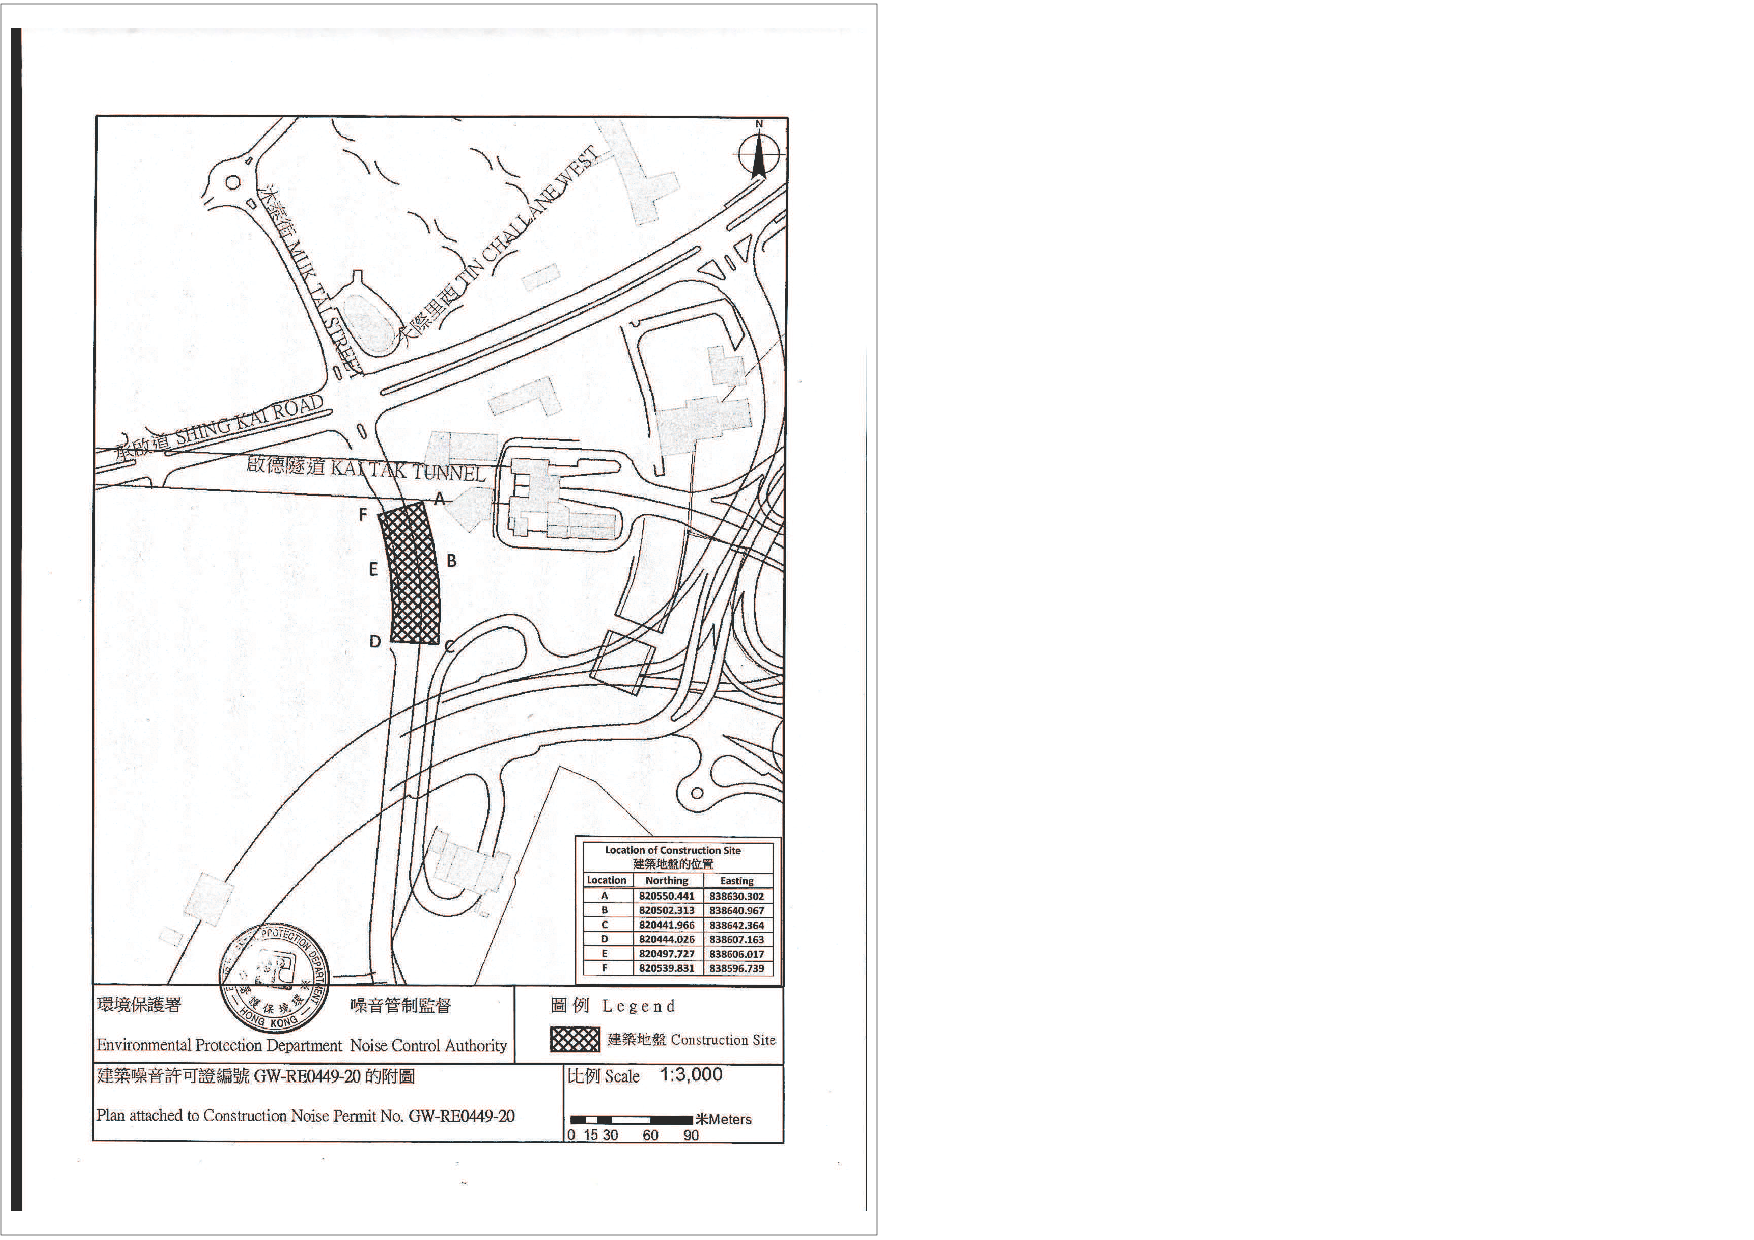
GW-RE0449-20 |
1 Jun 2020 |
26 Nov 2020 |
|
|
GW-RE0582-20 |
15 Jul 2020 |
19 Oct 2020 |
|
|
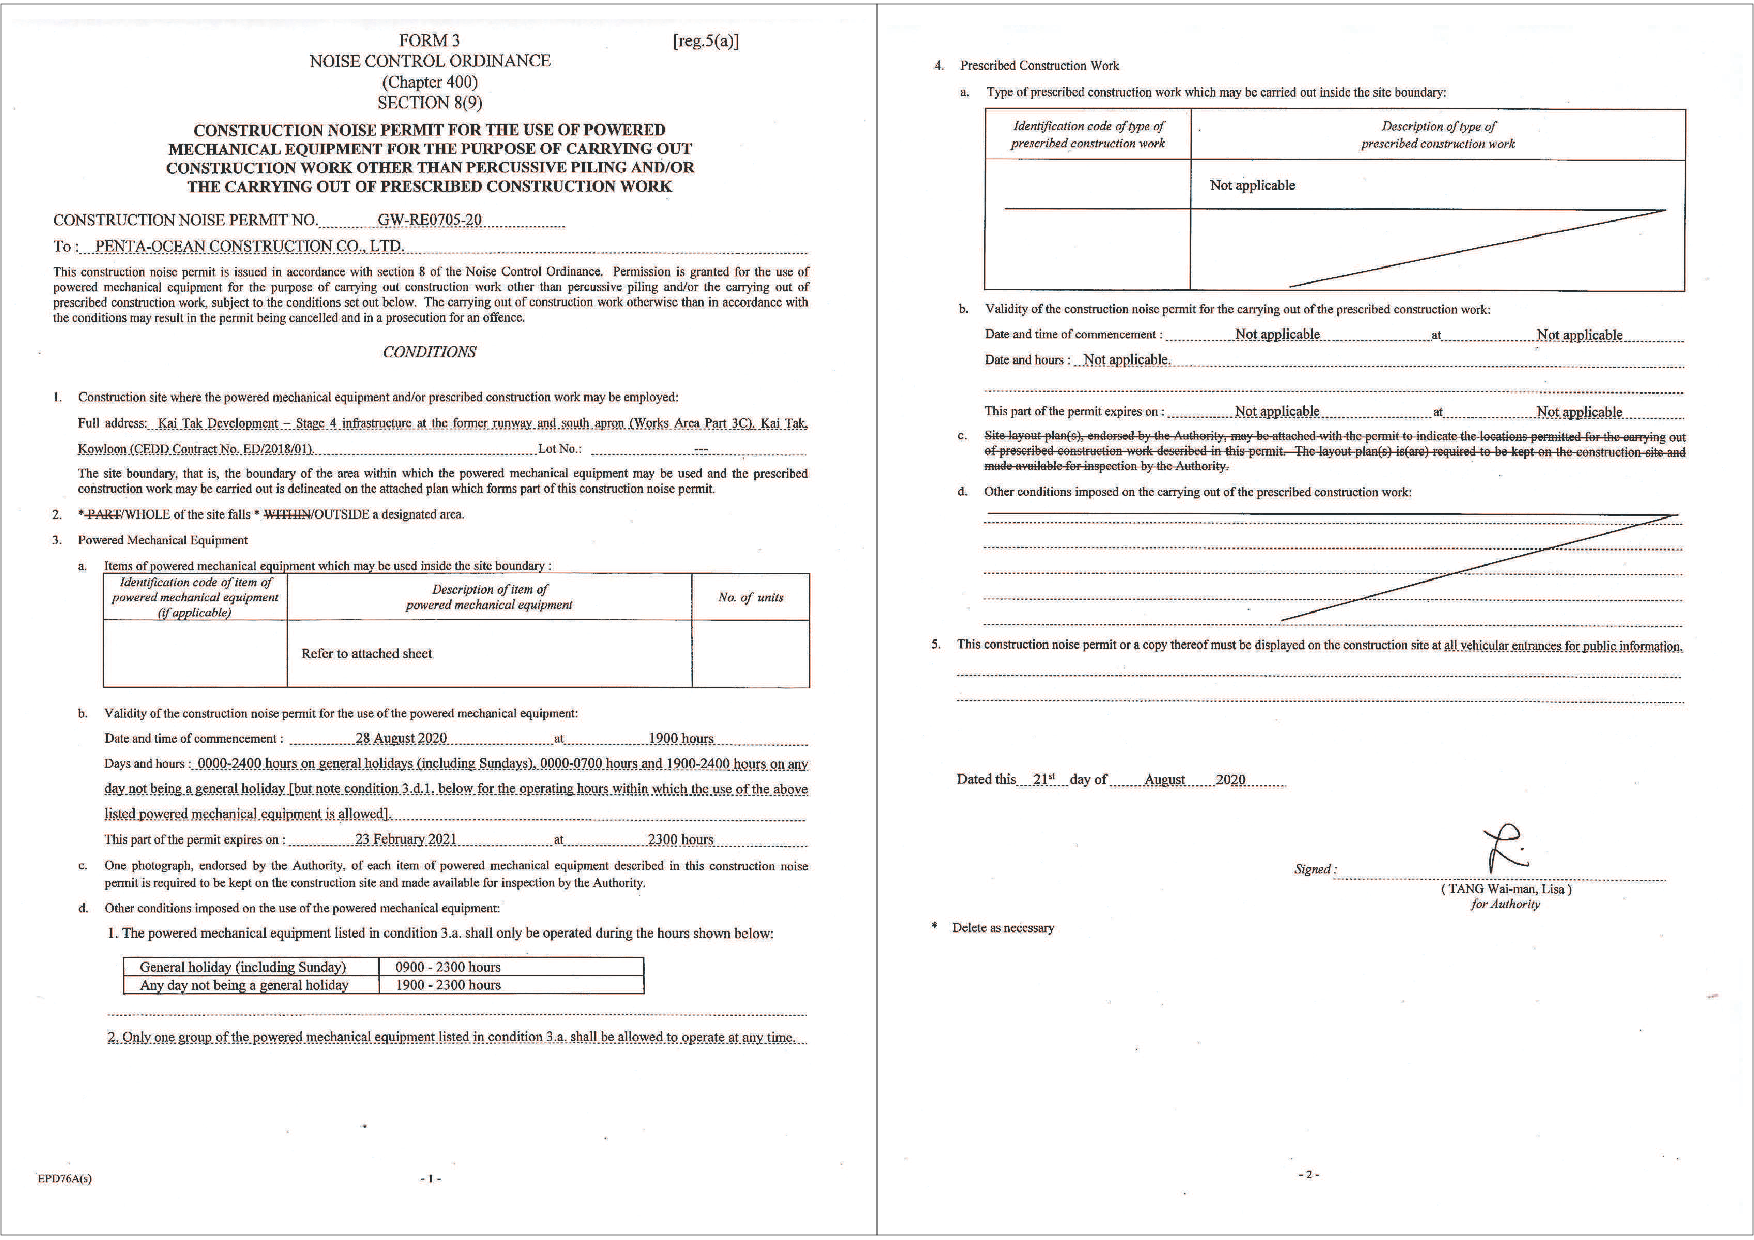
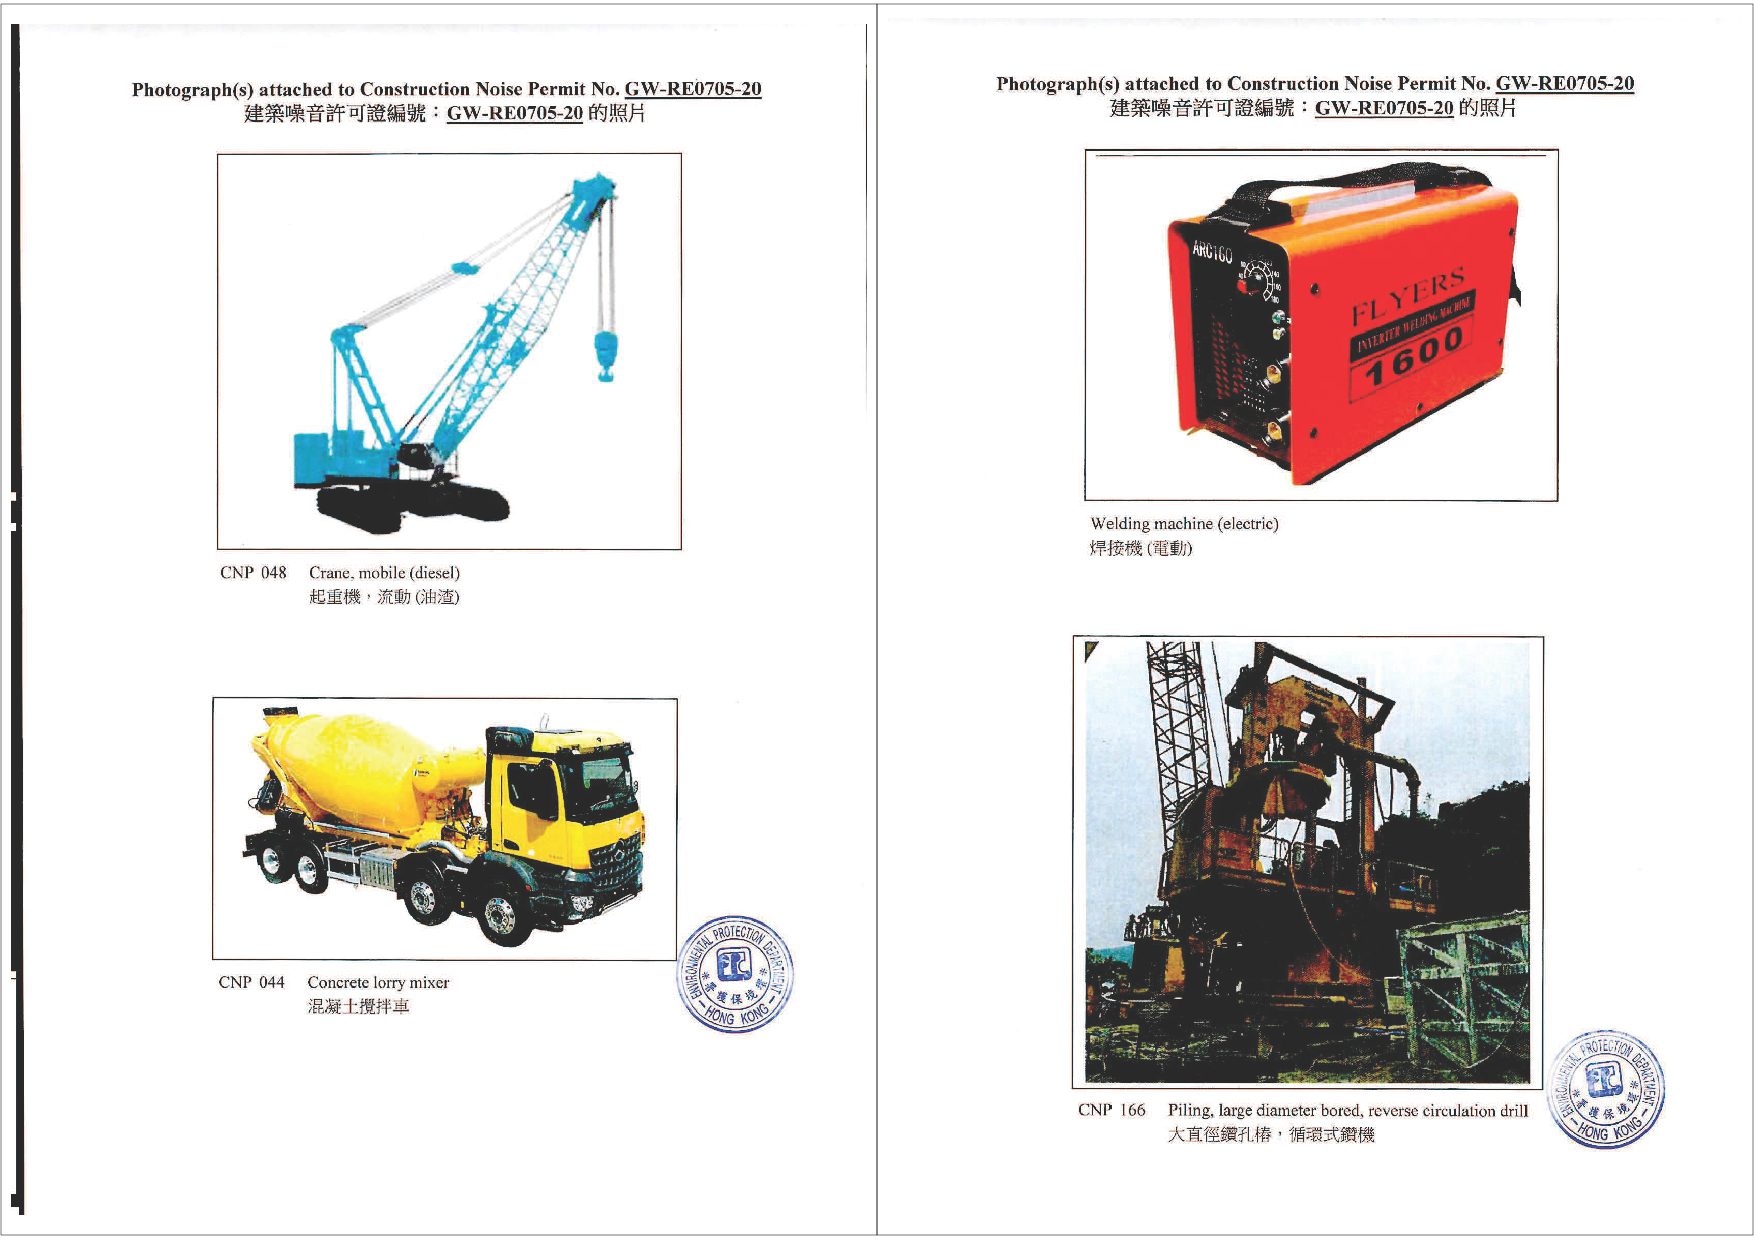
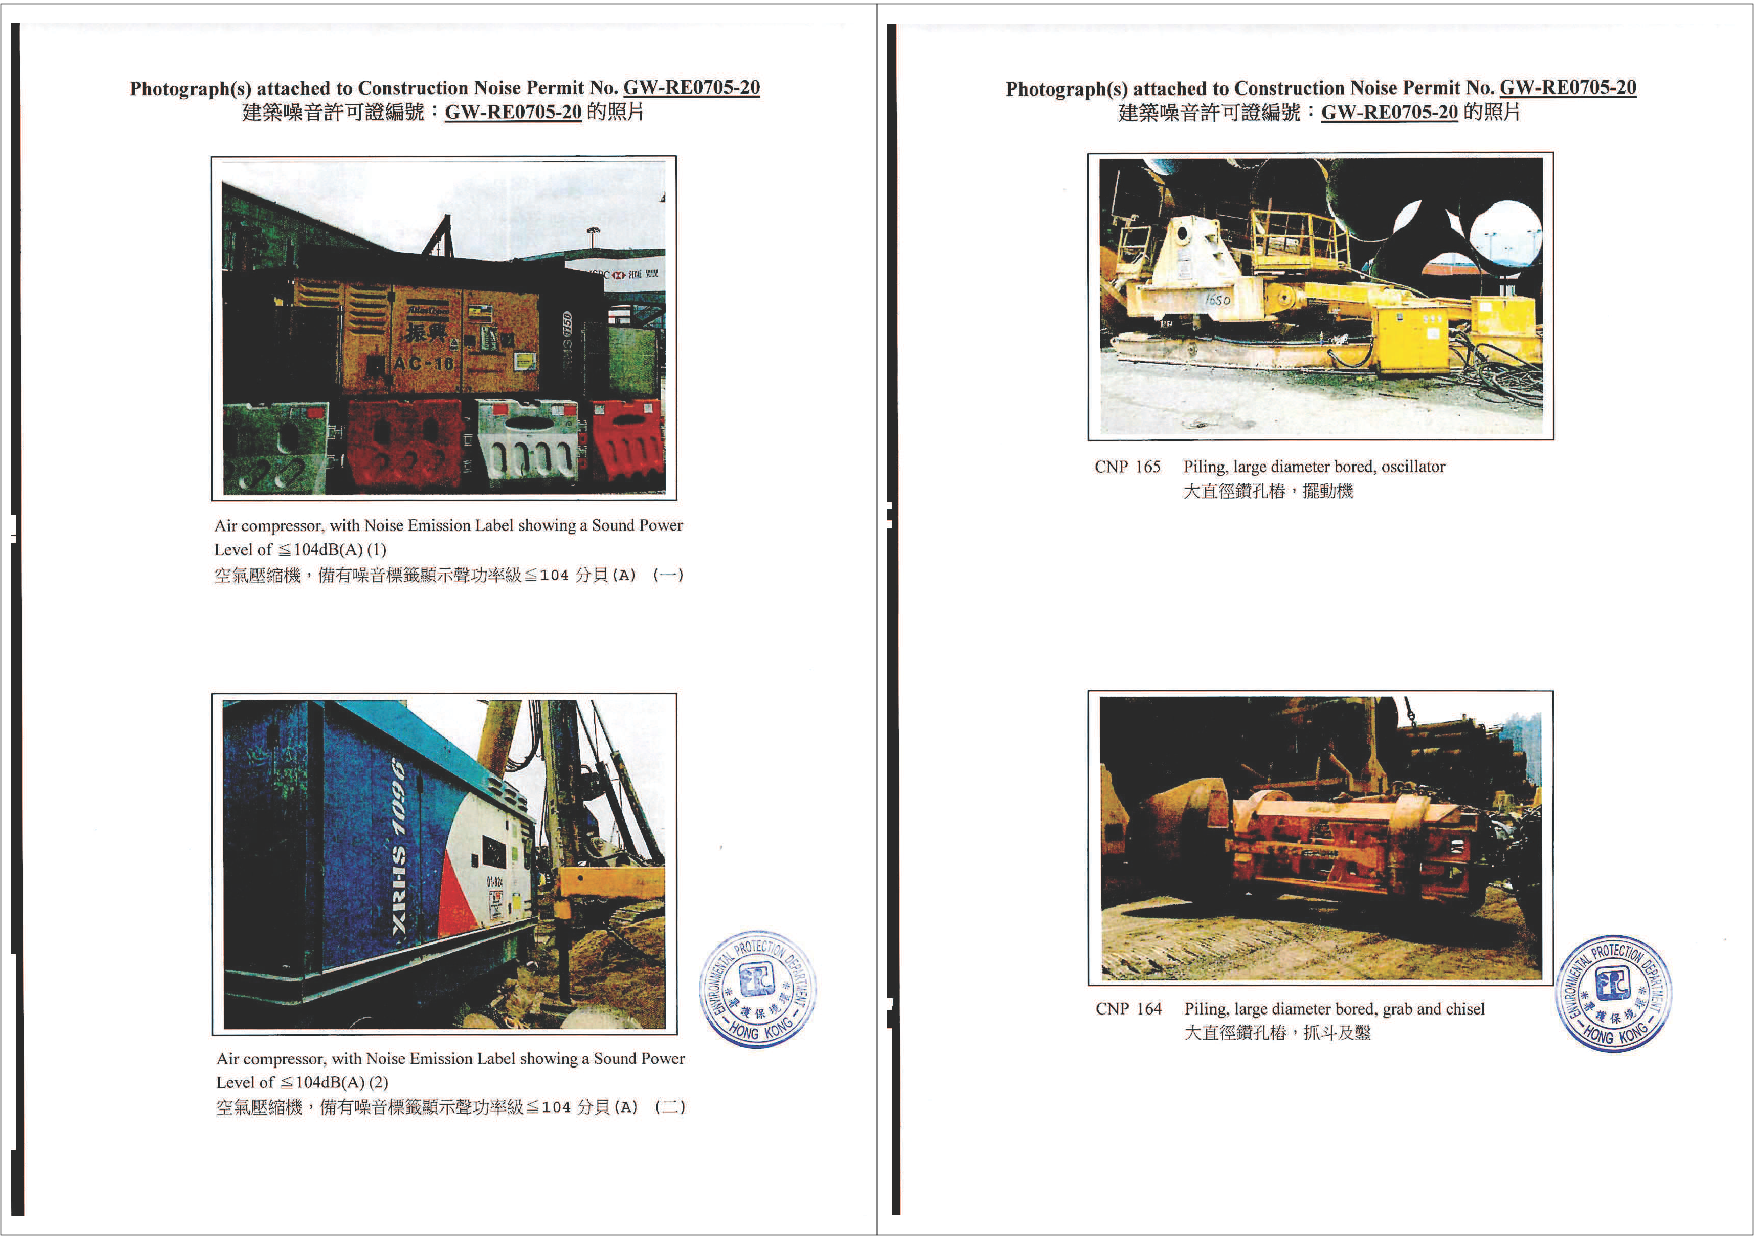
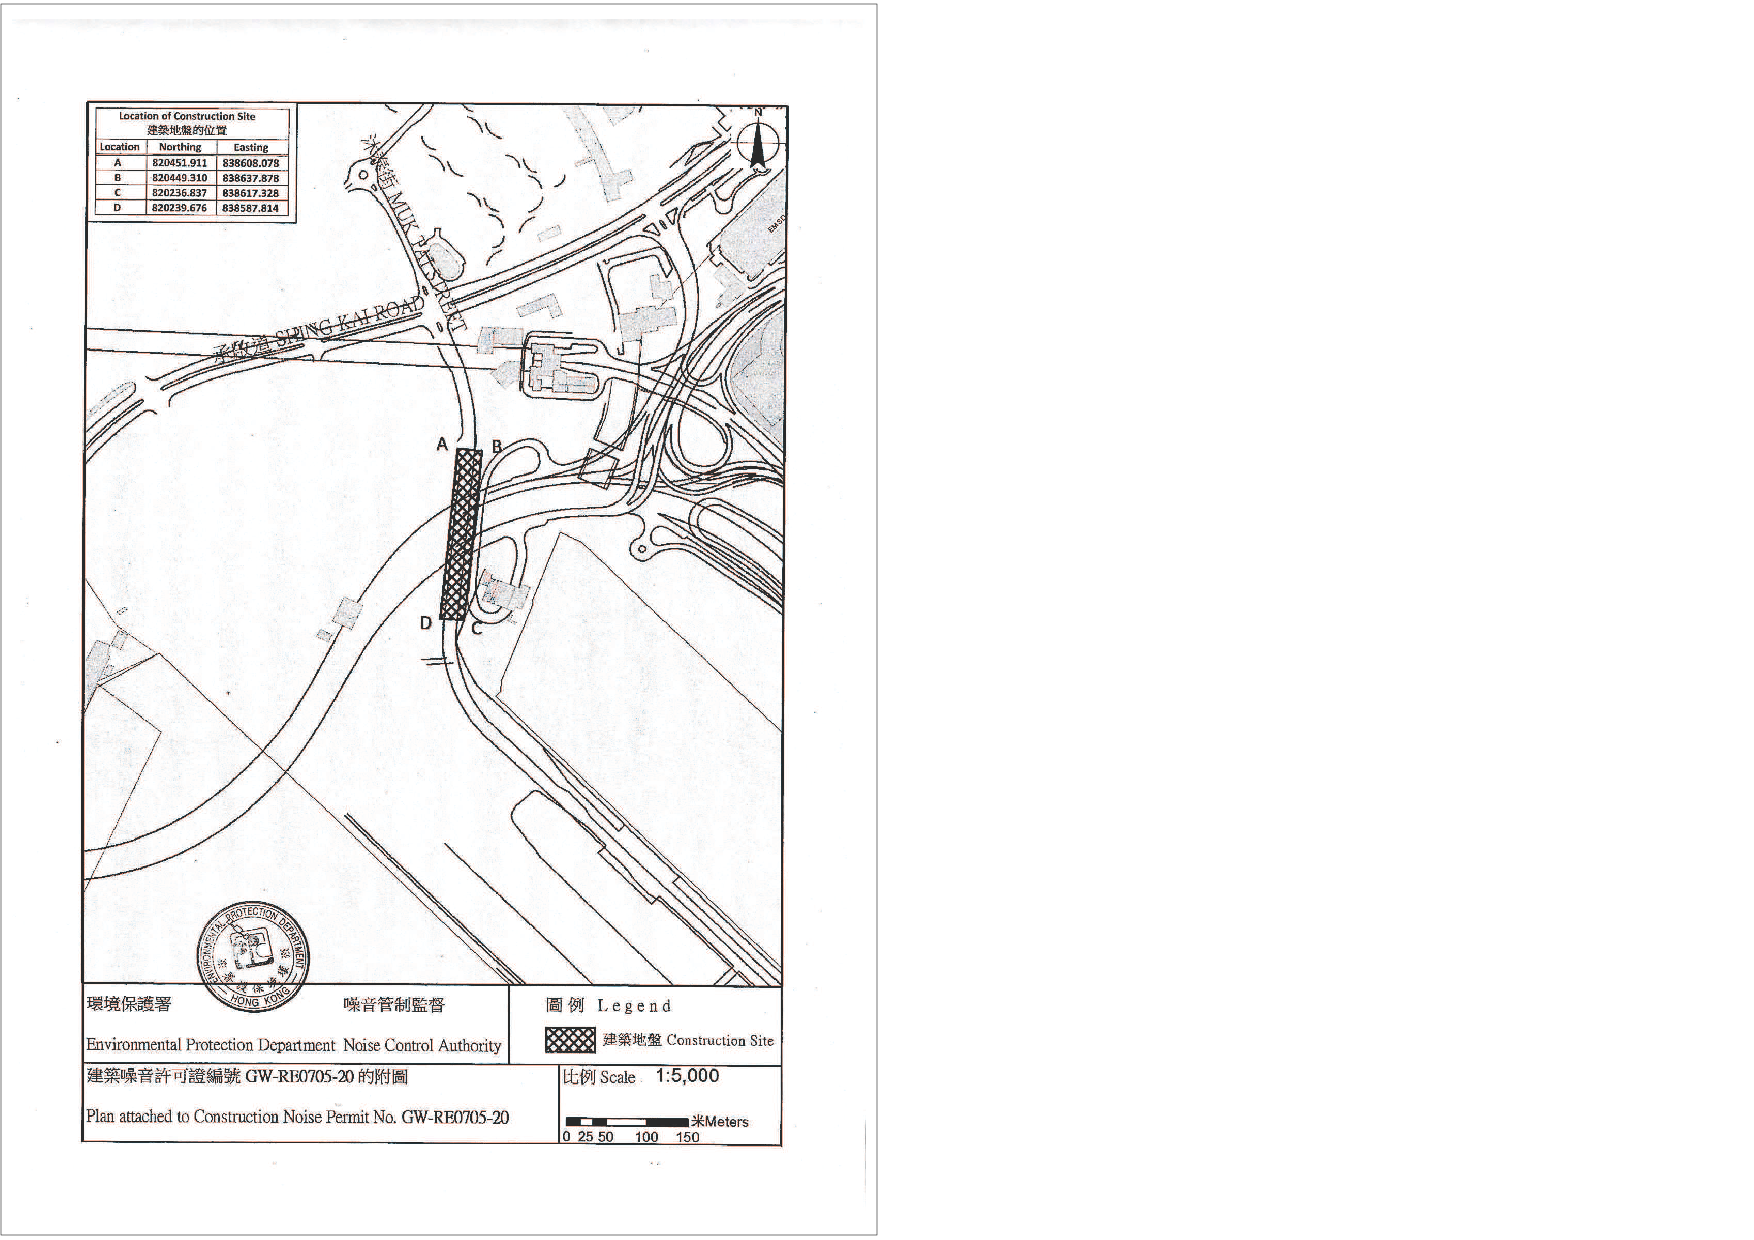
GW-RE0705-20 |
21 Aug 2020 |
23 Mar 2021 |
|
|
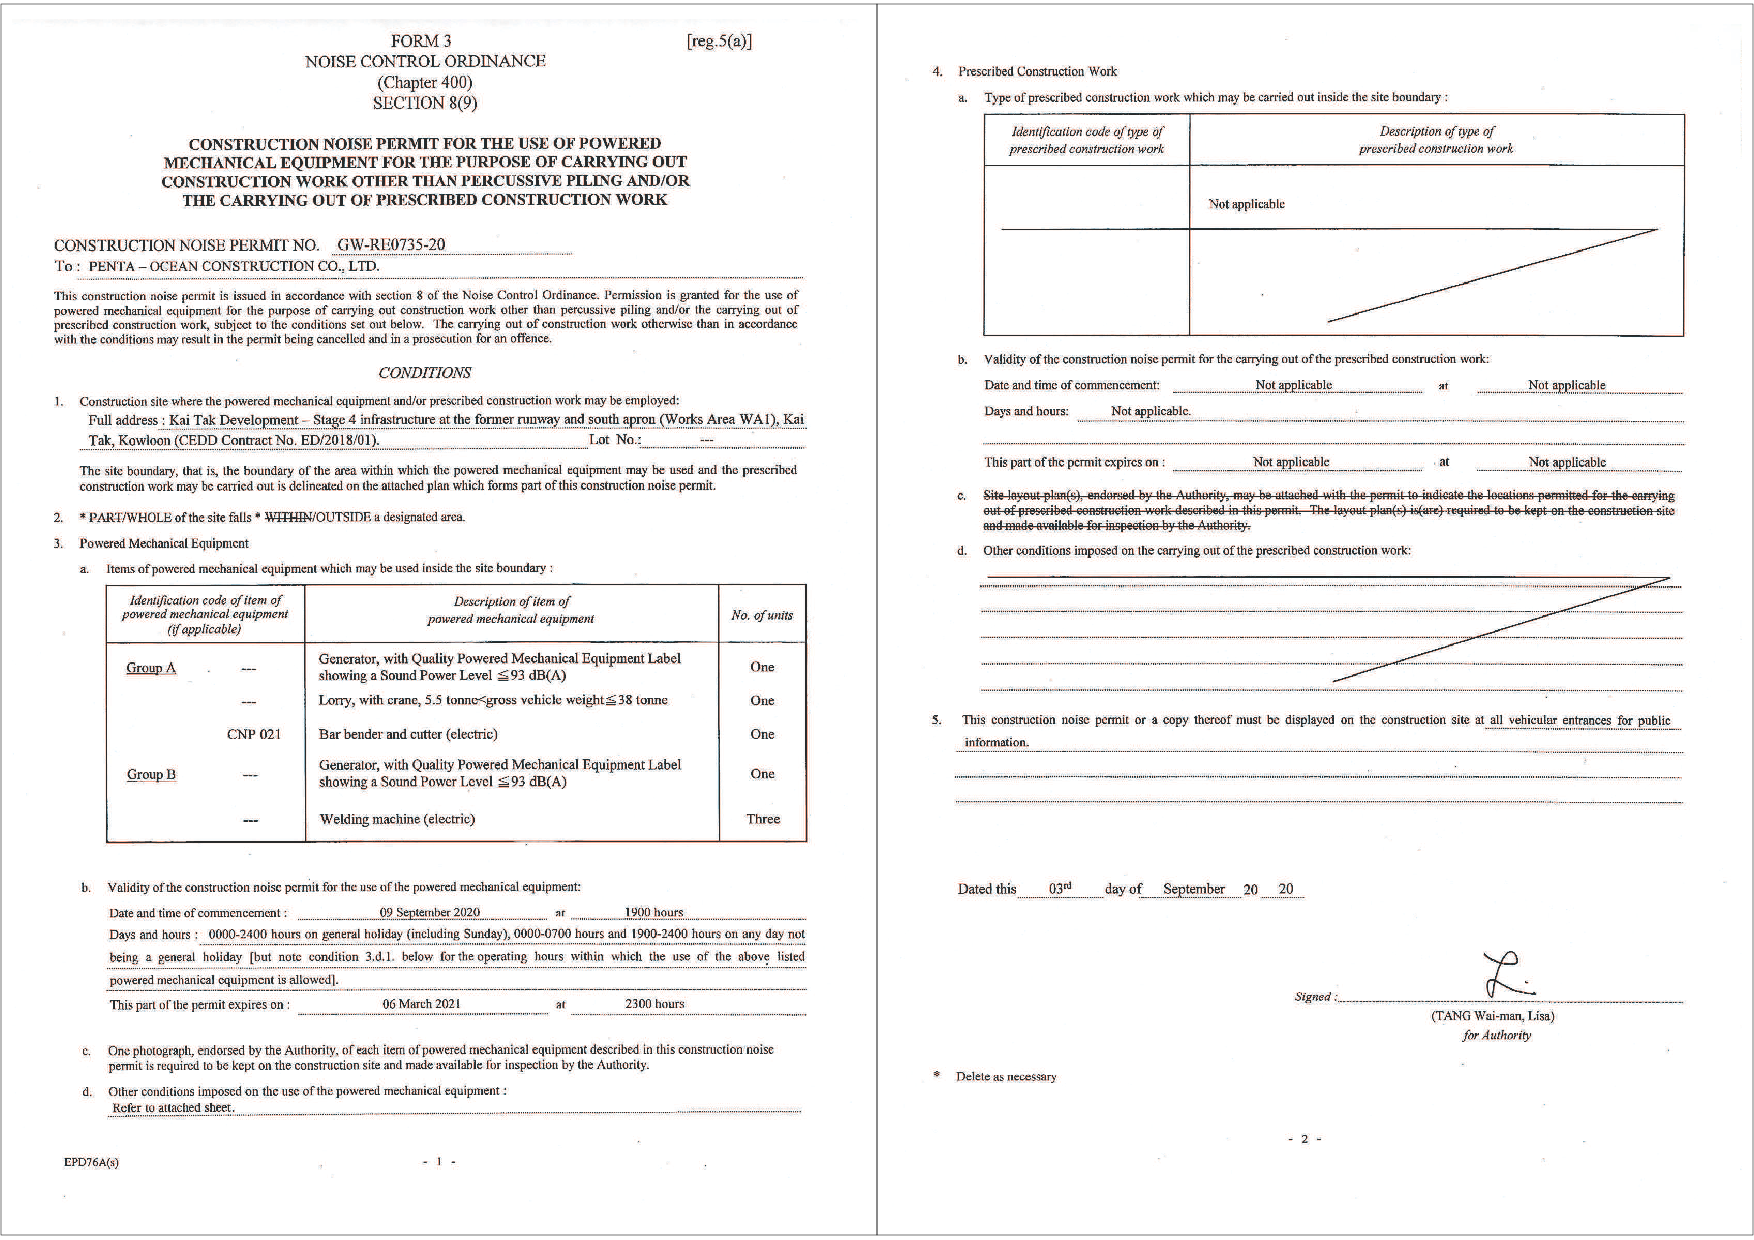
GW-RE0735-20 |
3 Sep 2020 |
6 Mar 2021 |
|
|
GW-RE0742-20 |
11 Sep 2020 |
6 Mar 2021 |
|
|
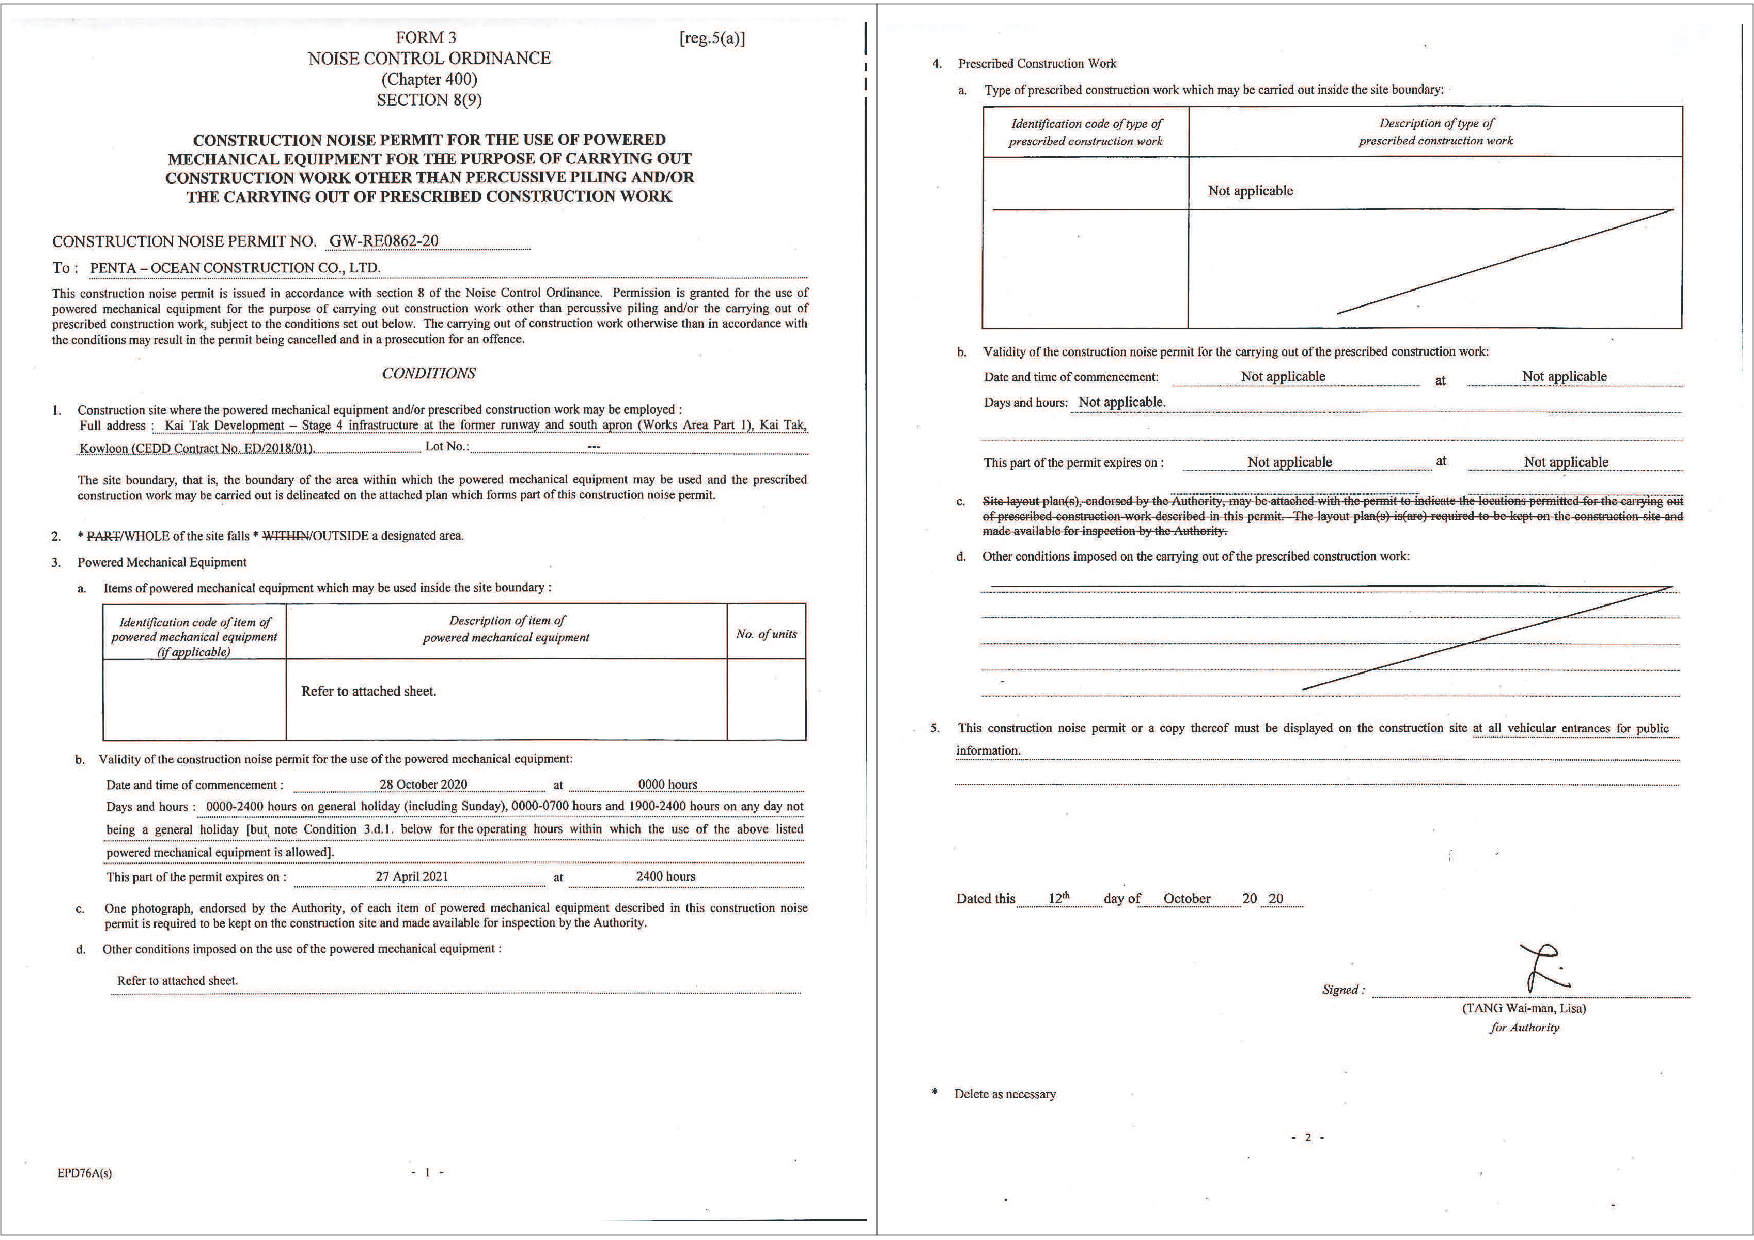
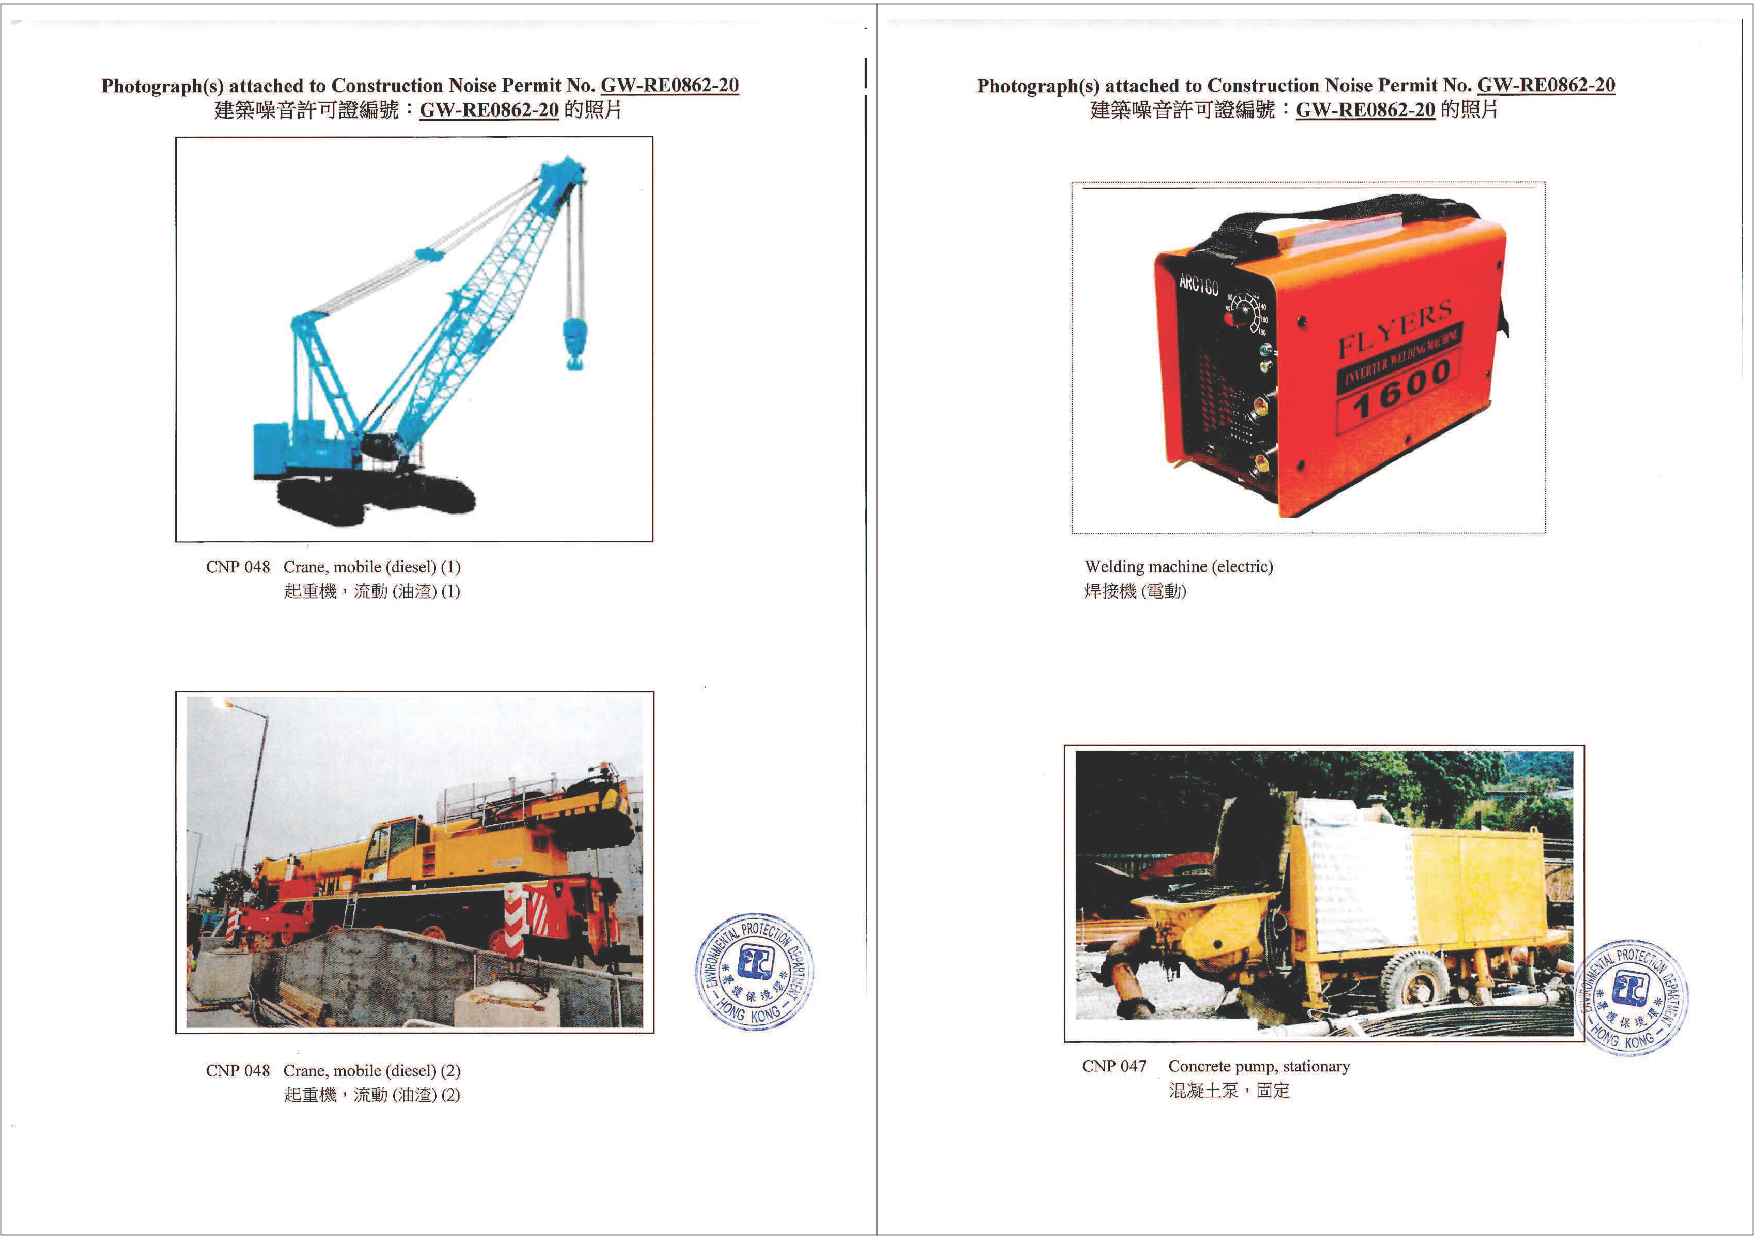
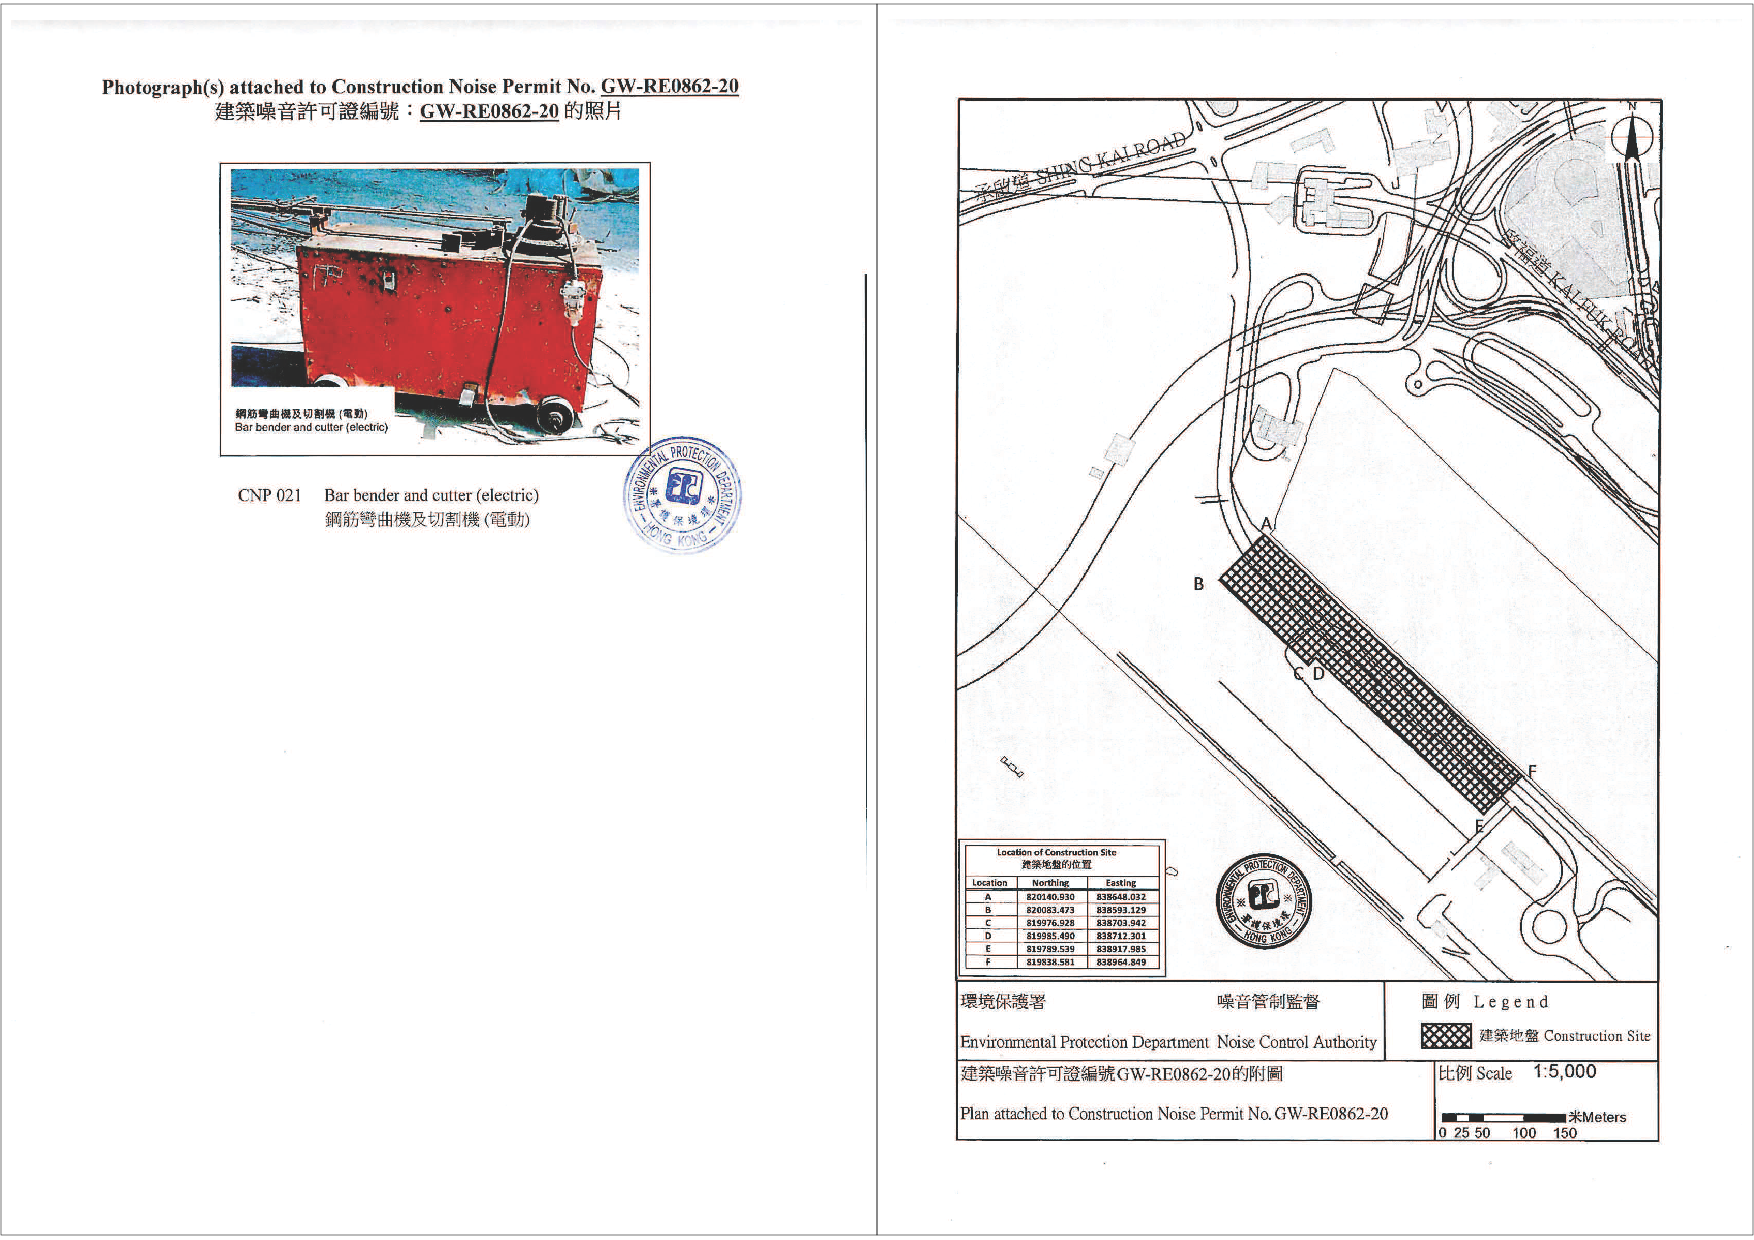
GW-RE0862-20 |
12 Oct 2020 |
27 Apr 2021 |
|
|
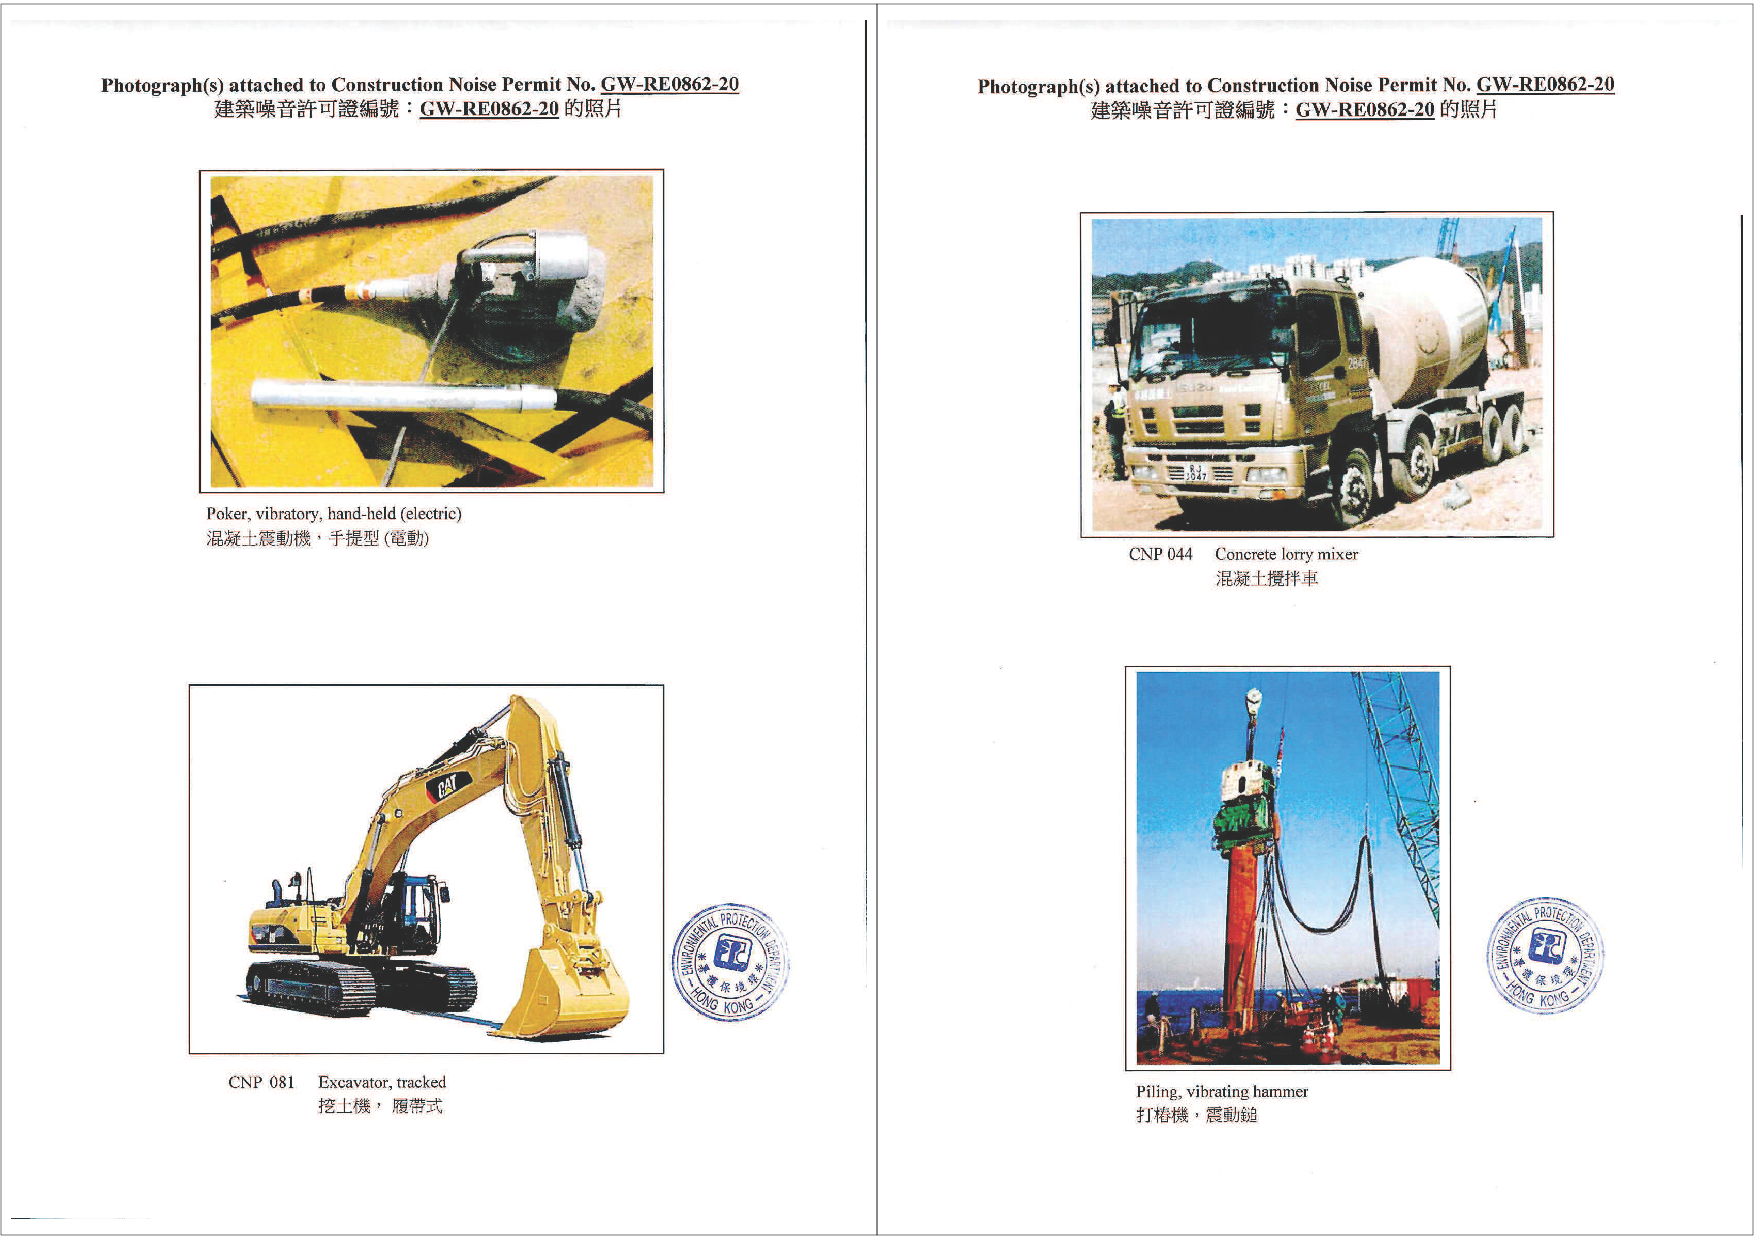
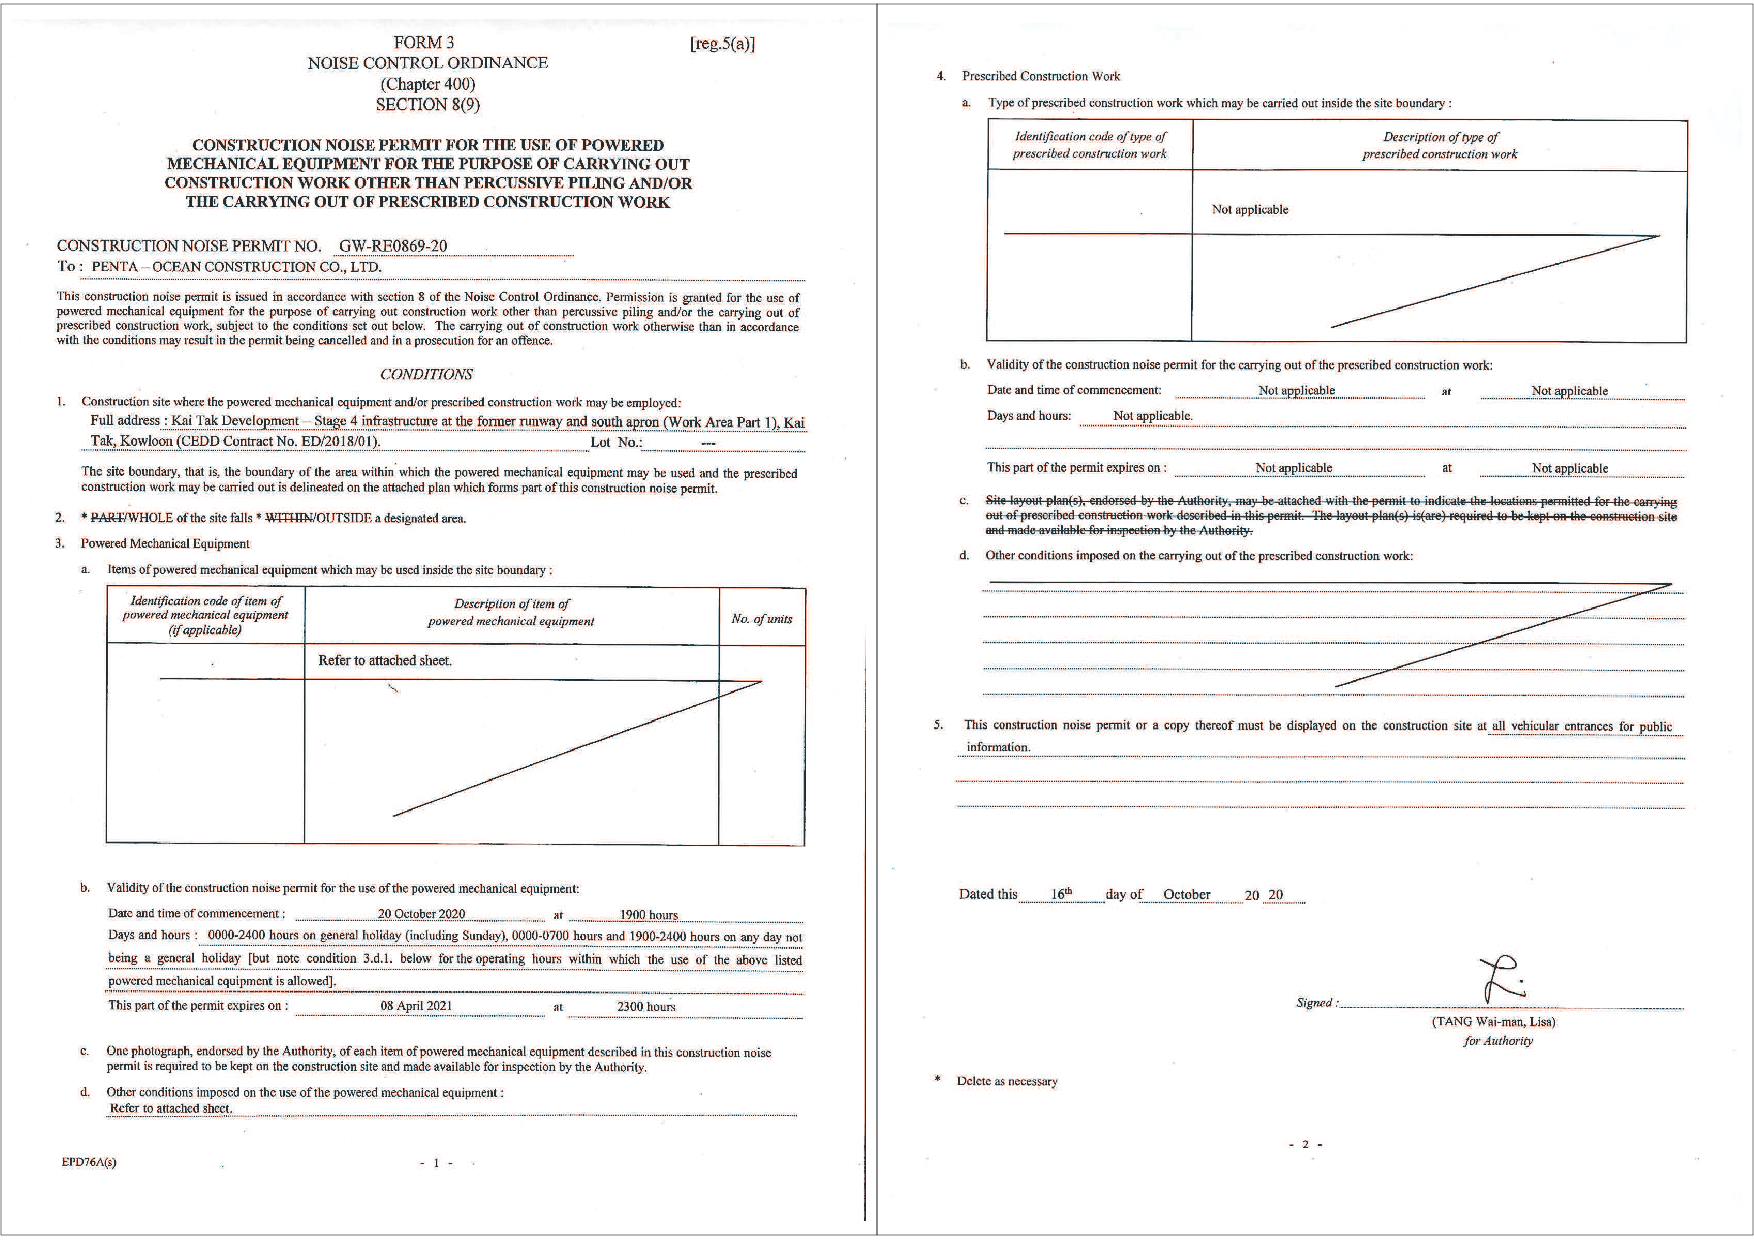
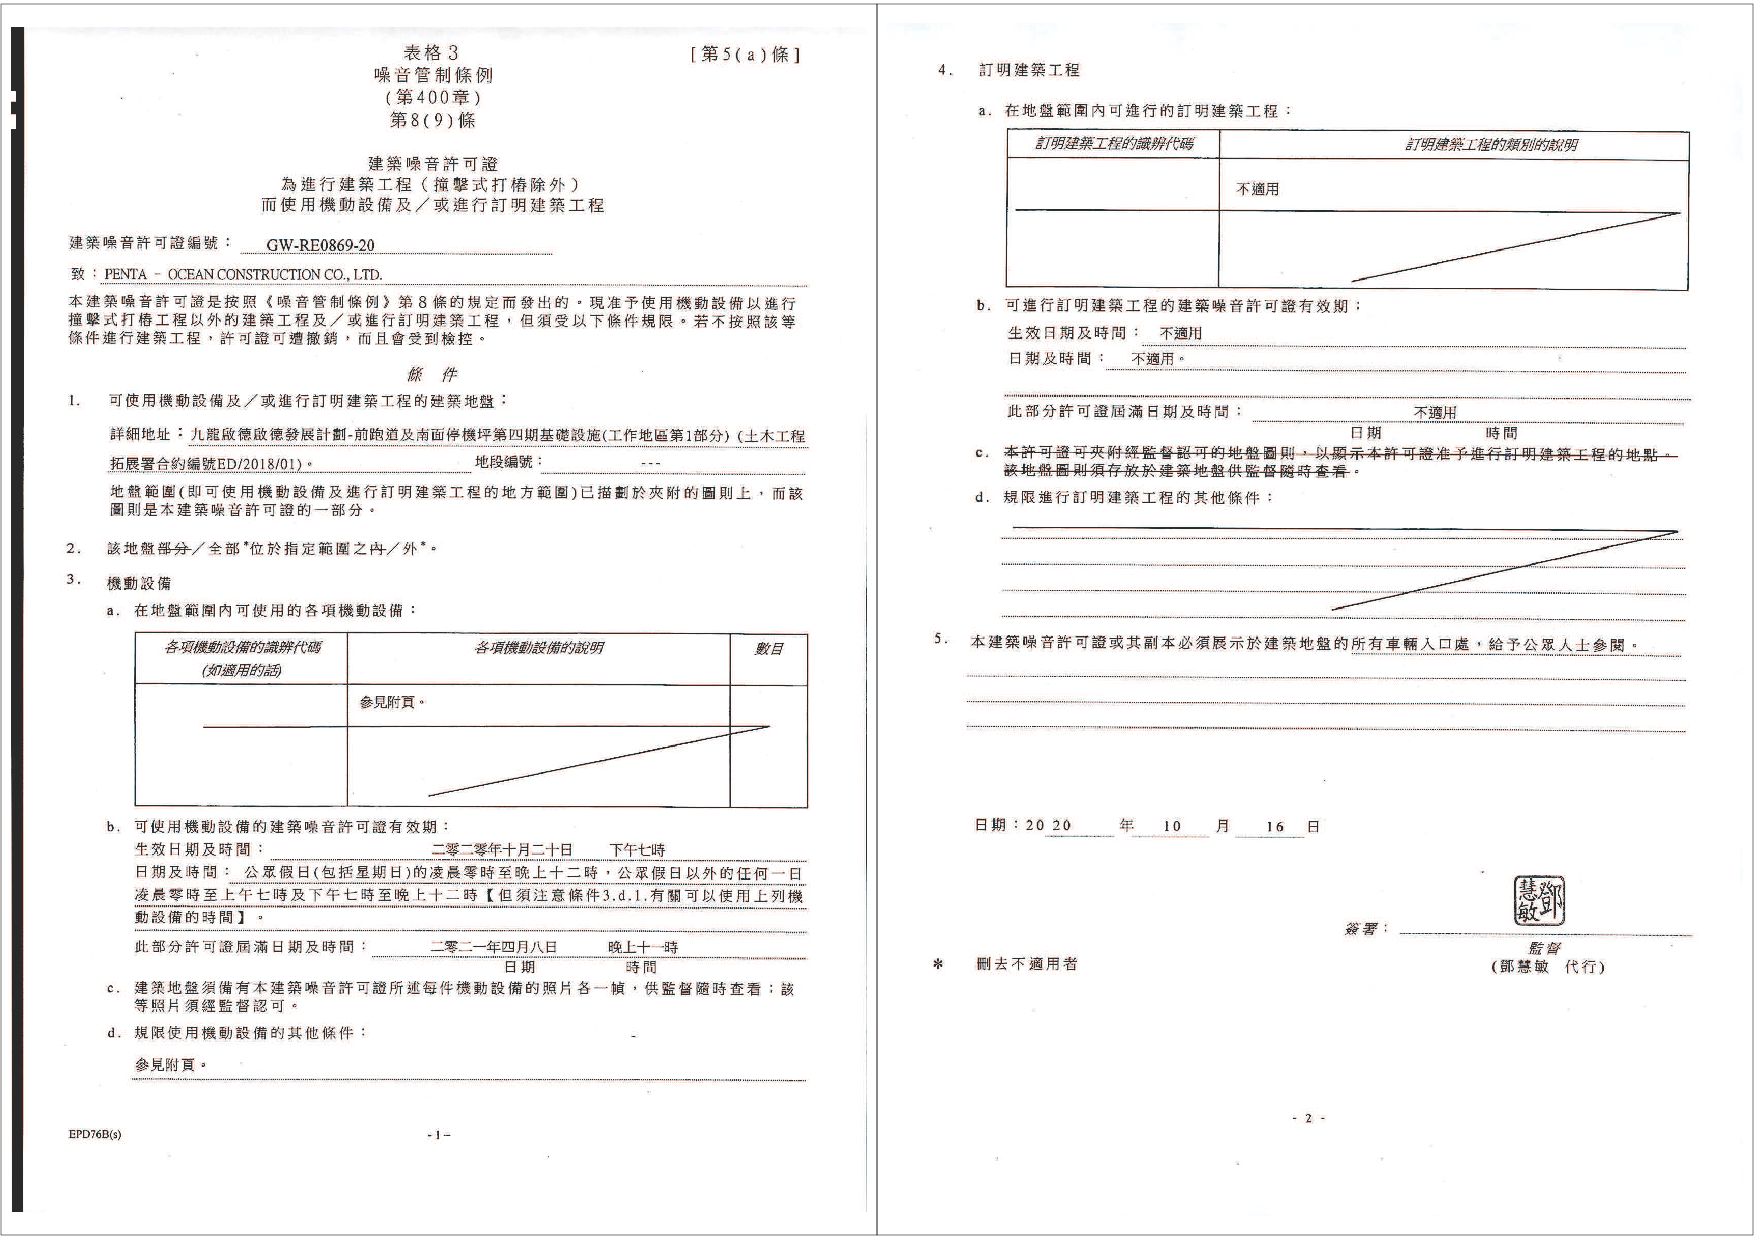
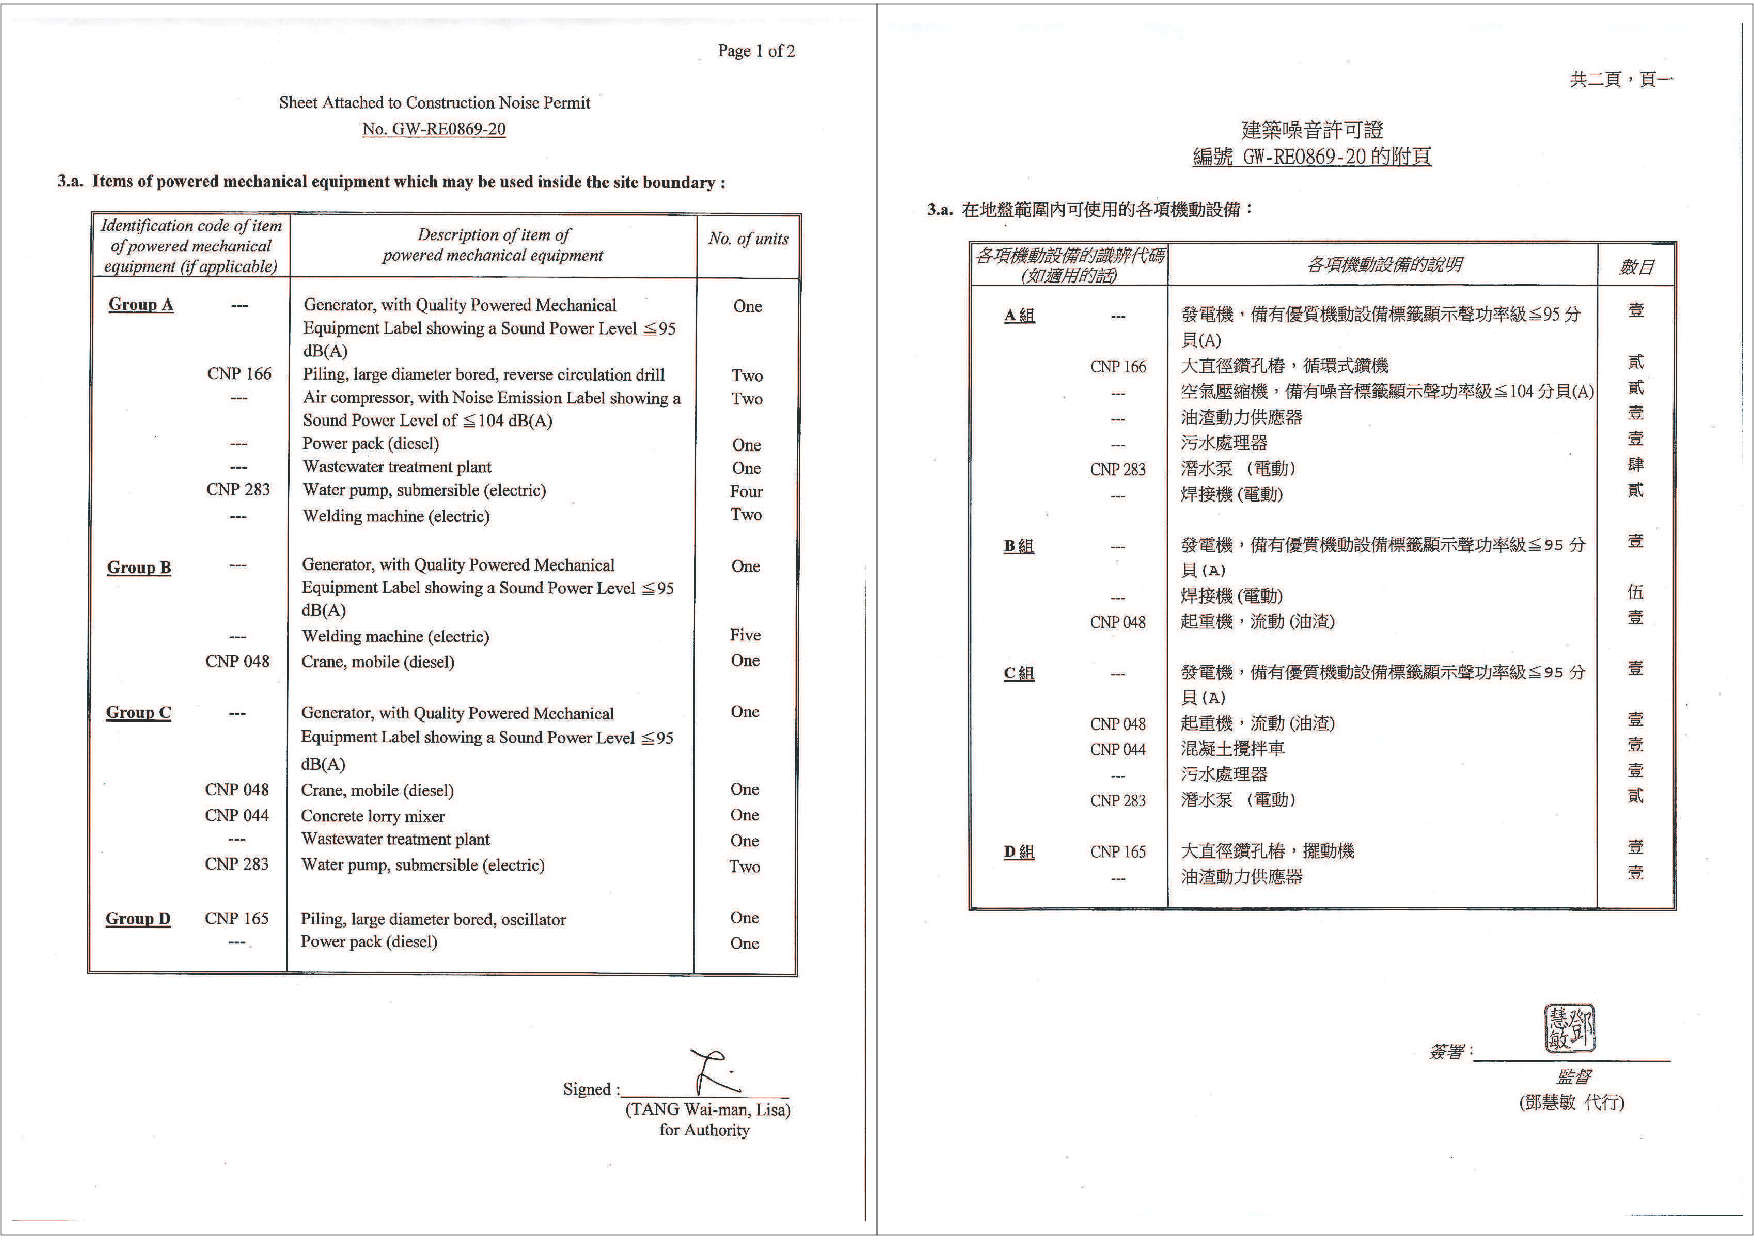
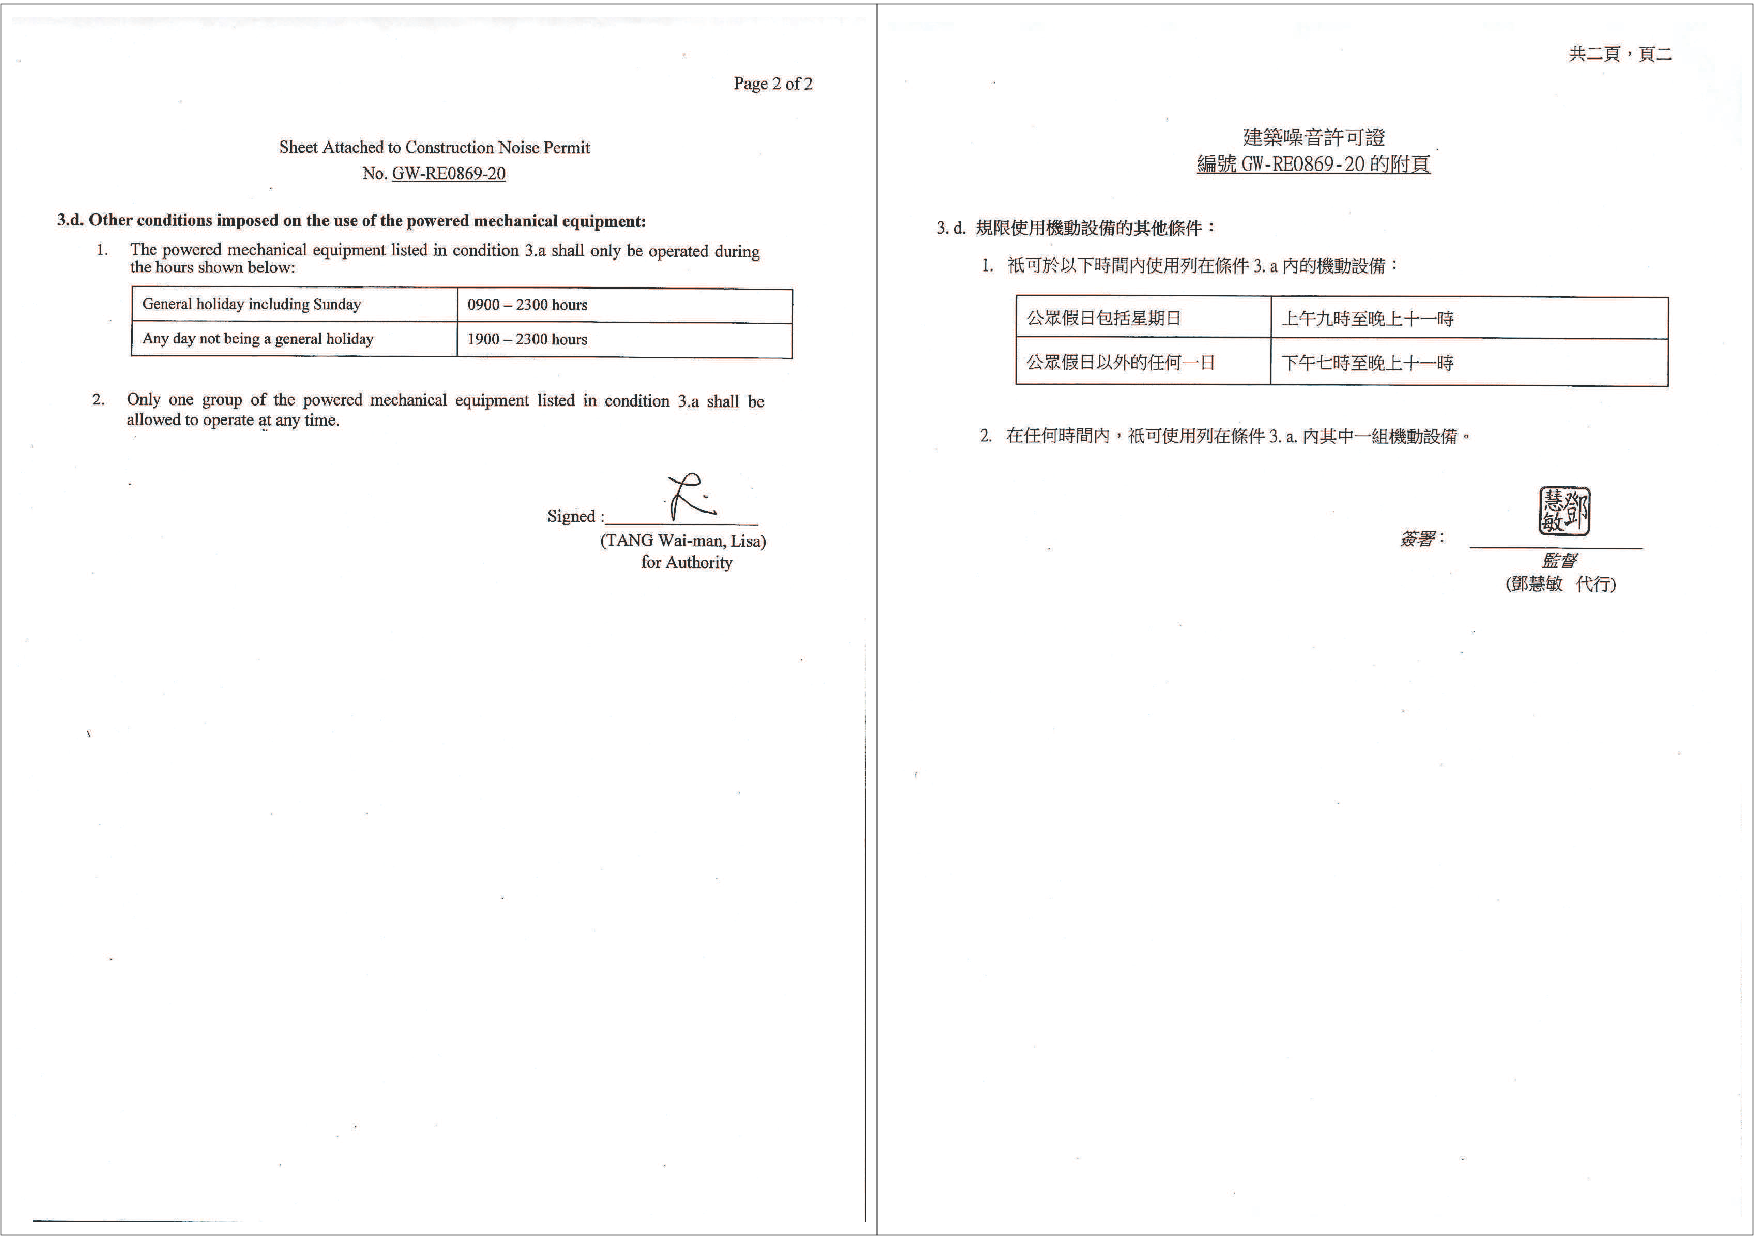
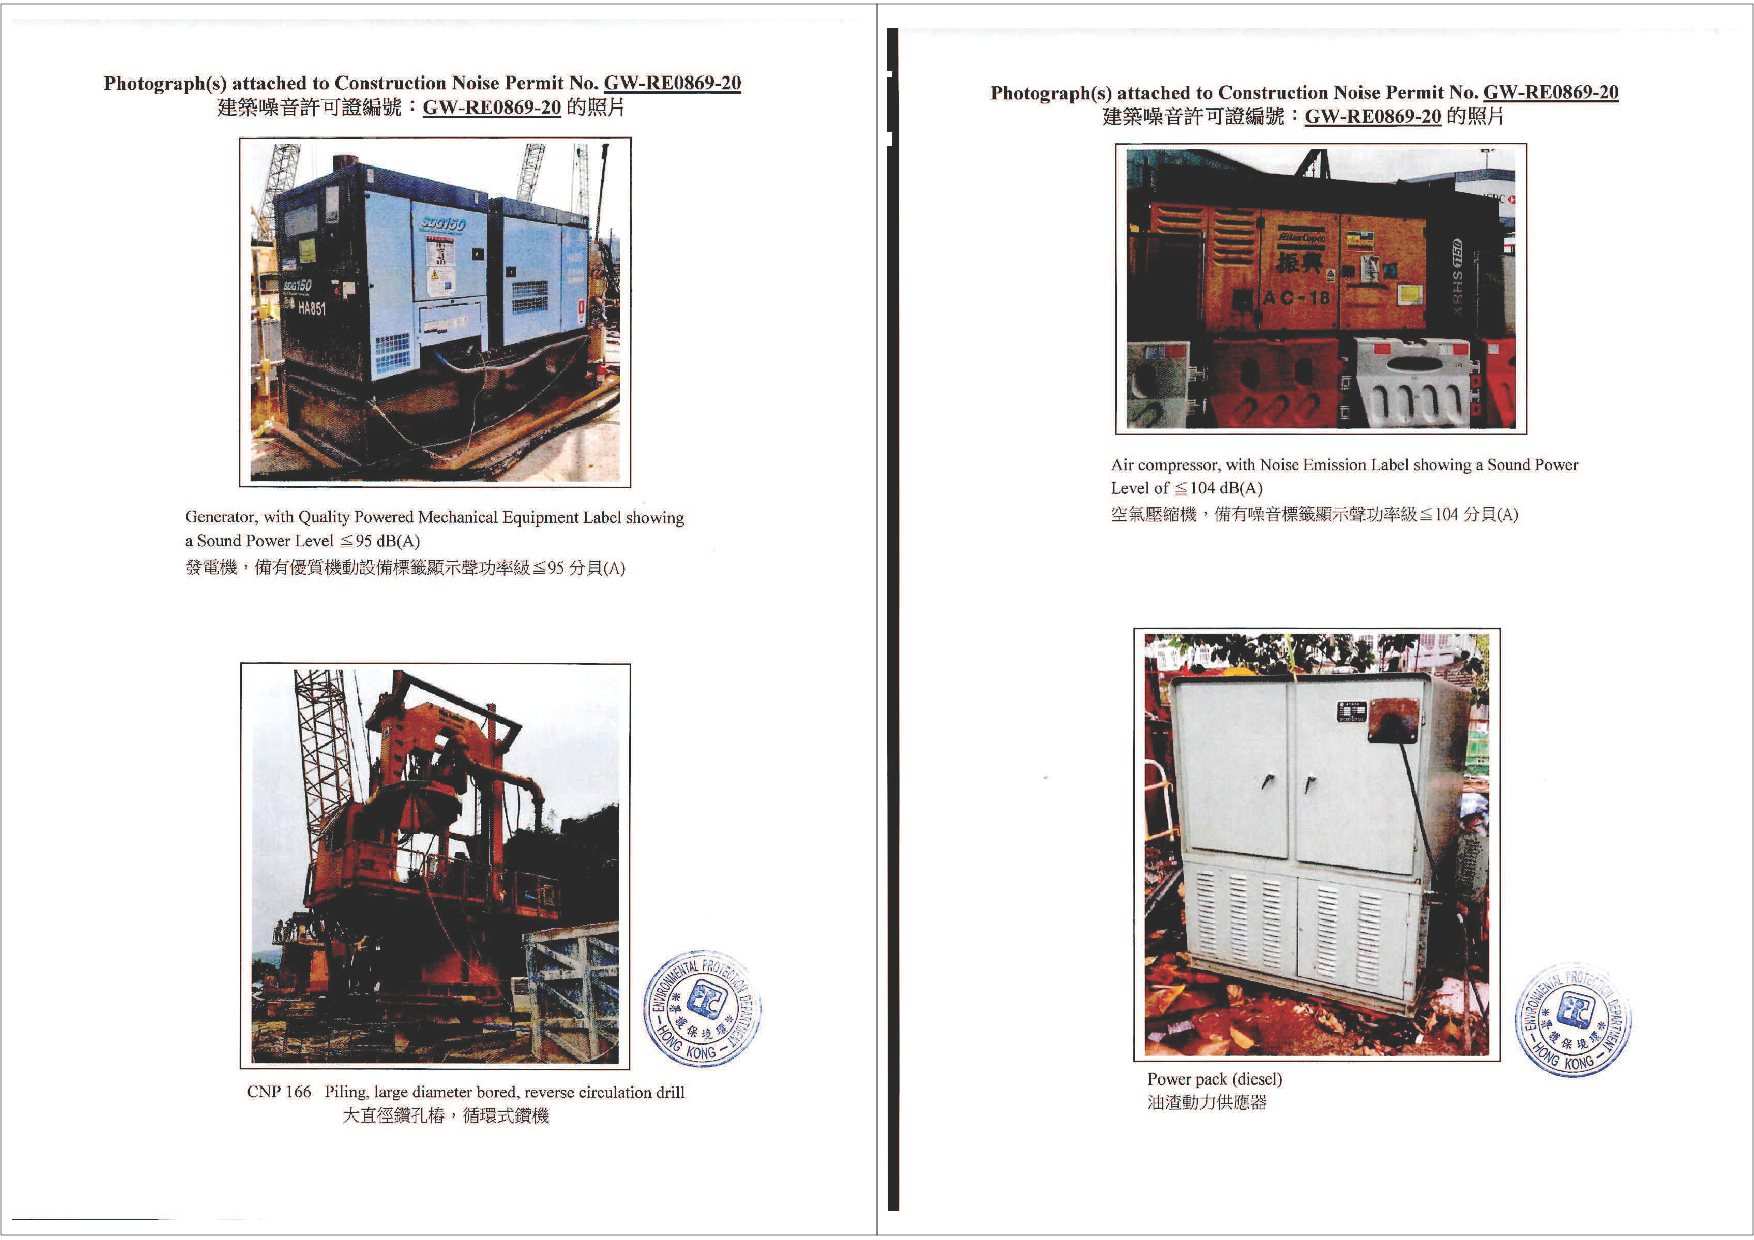
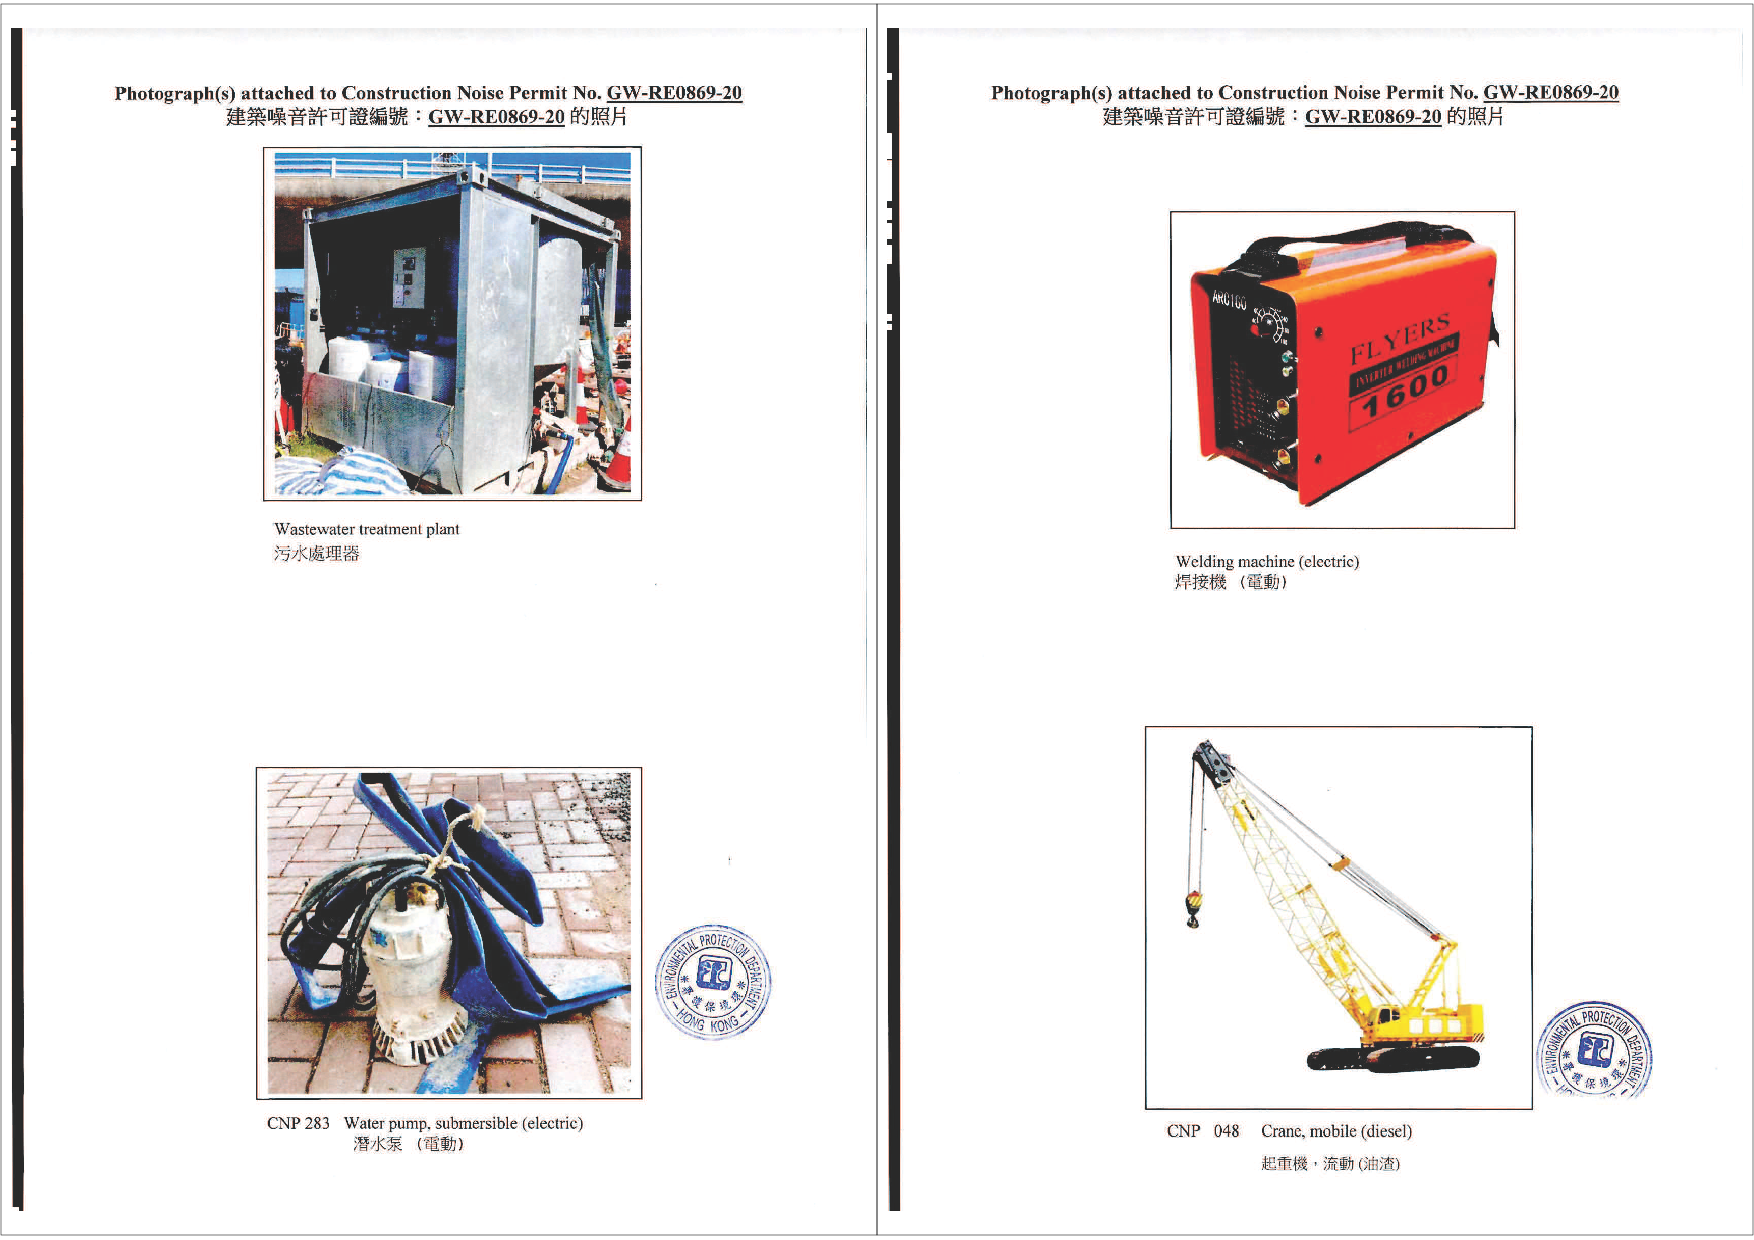
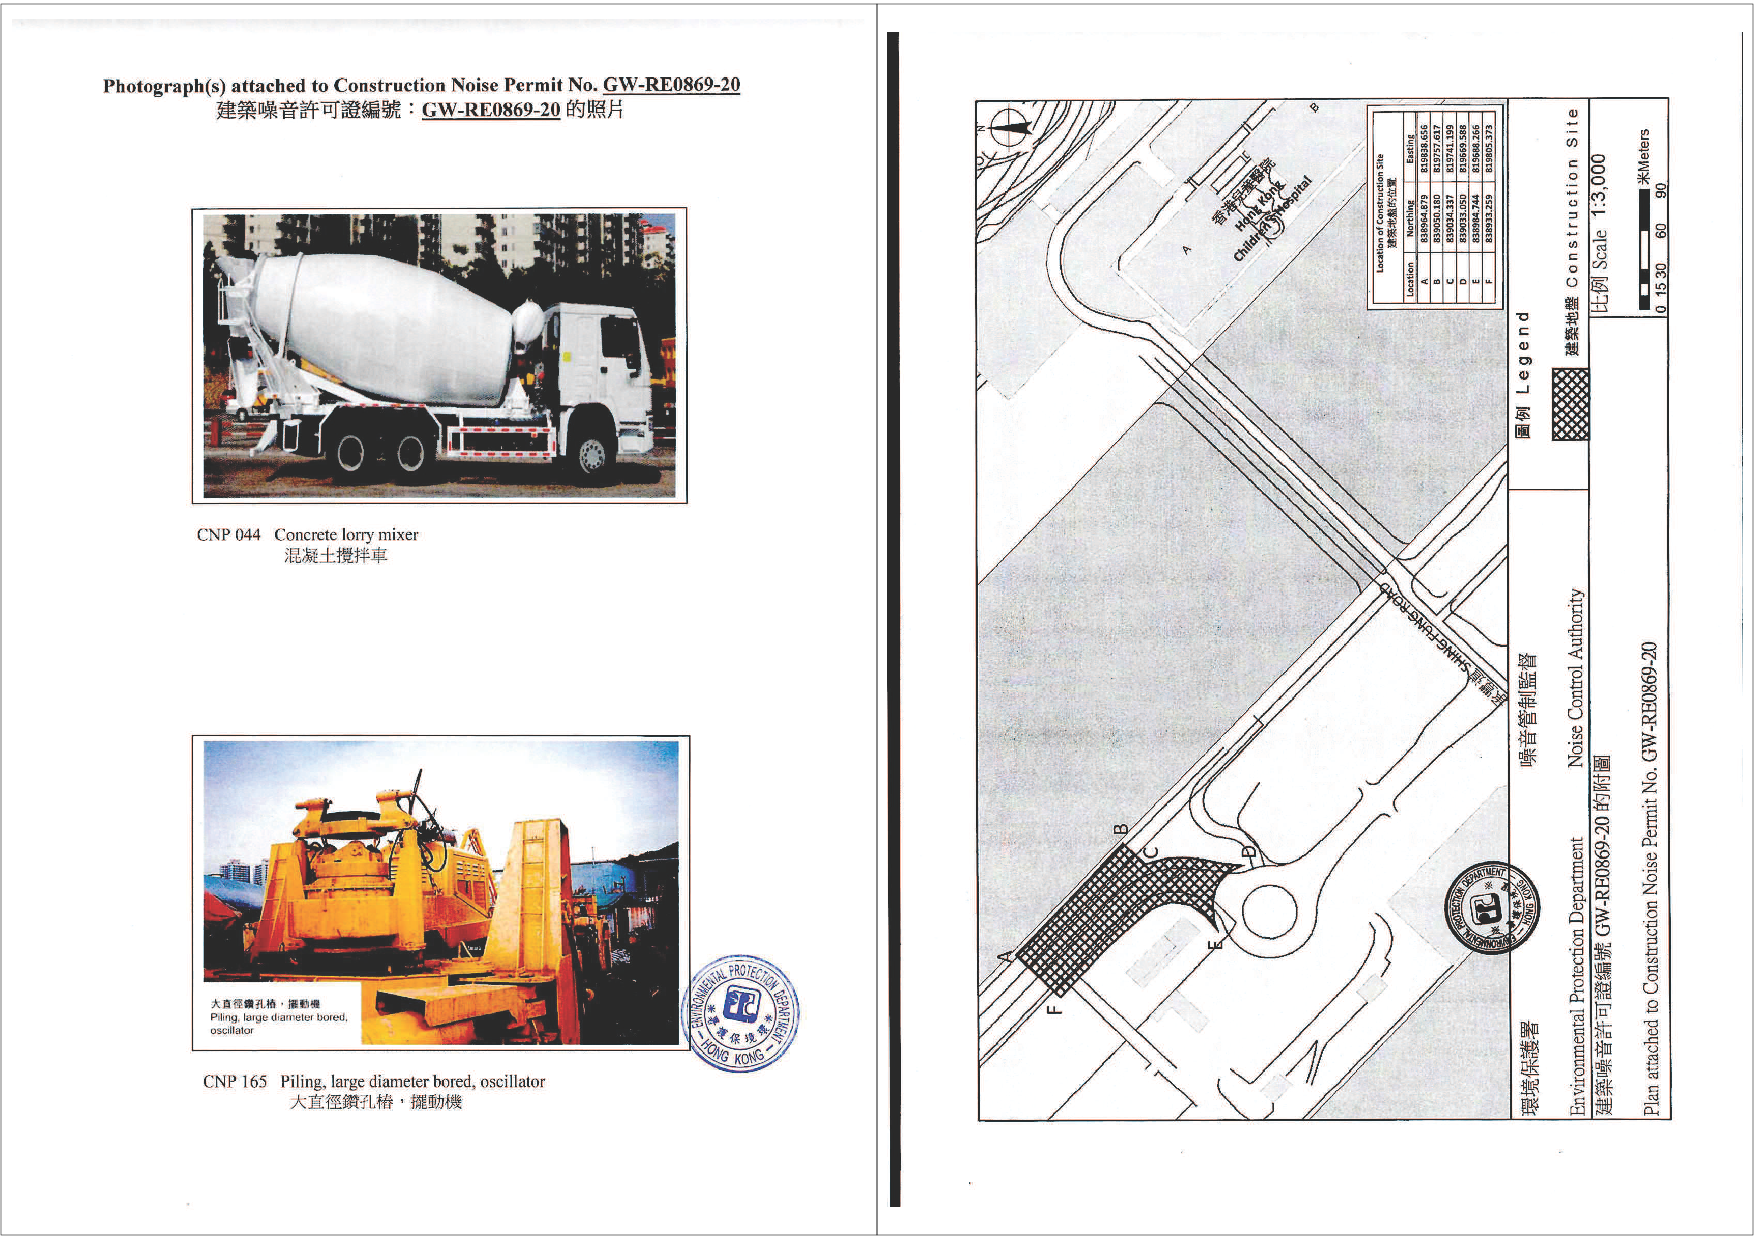
GW-RE0869-20 |
16 Oct 2020 |
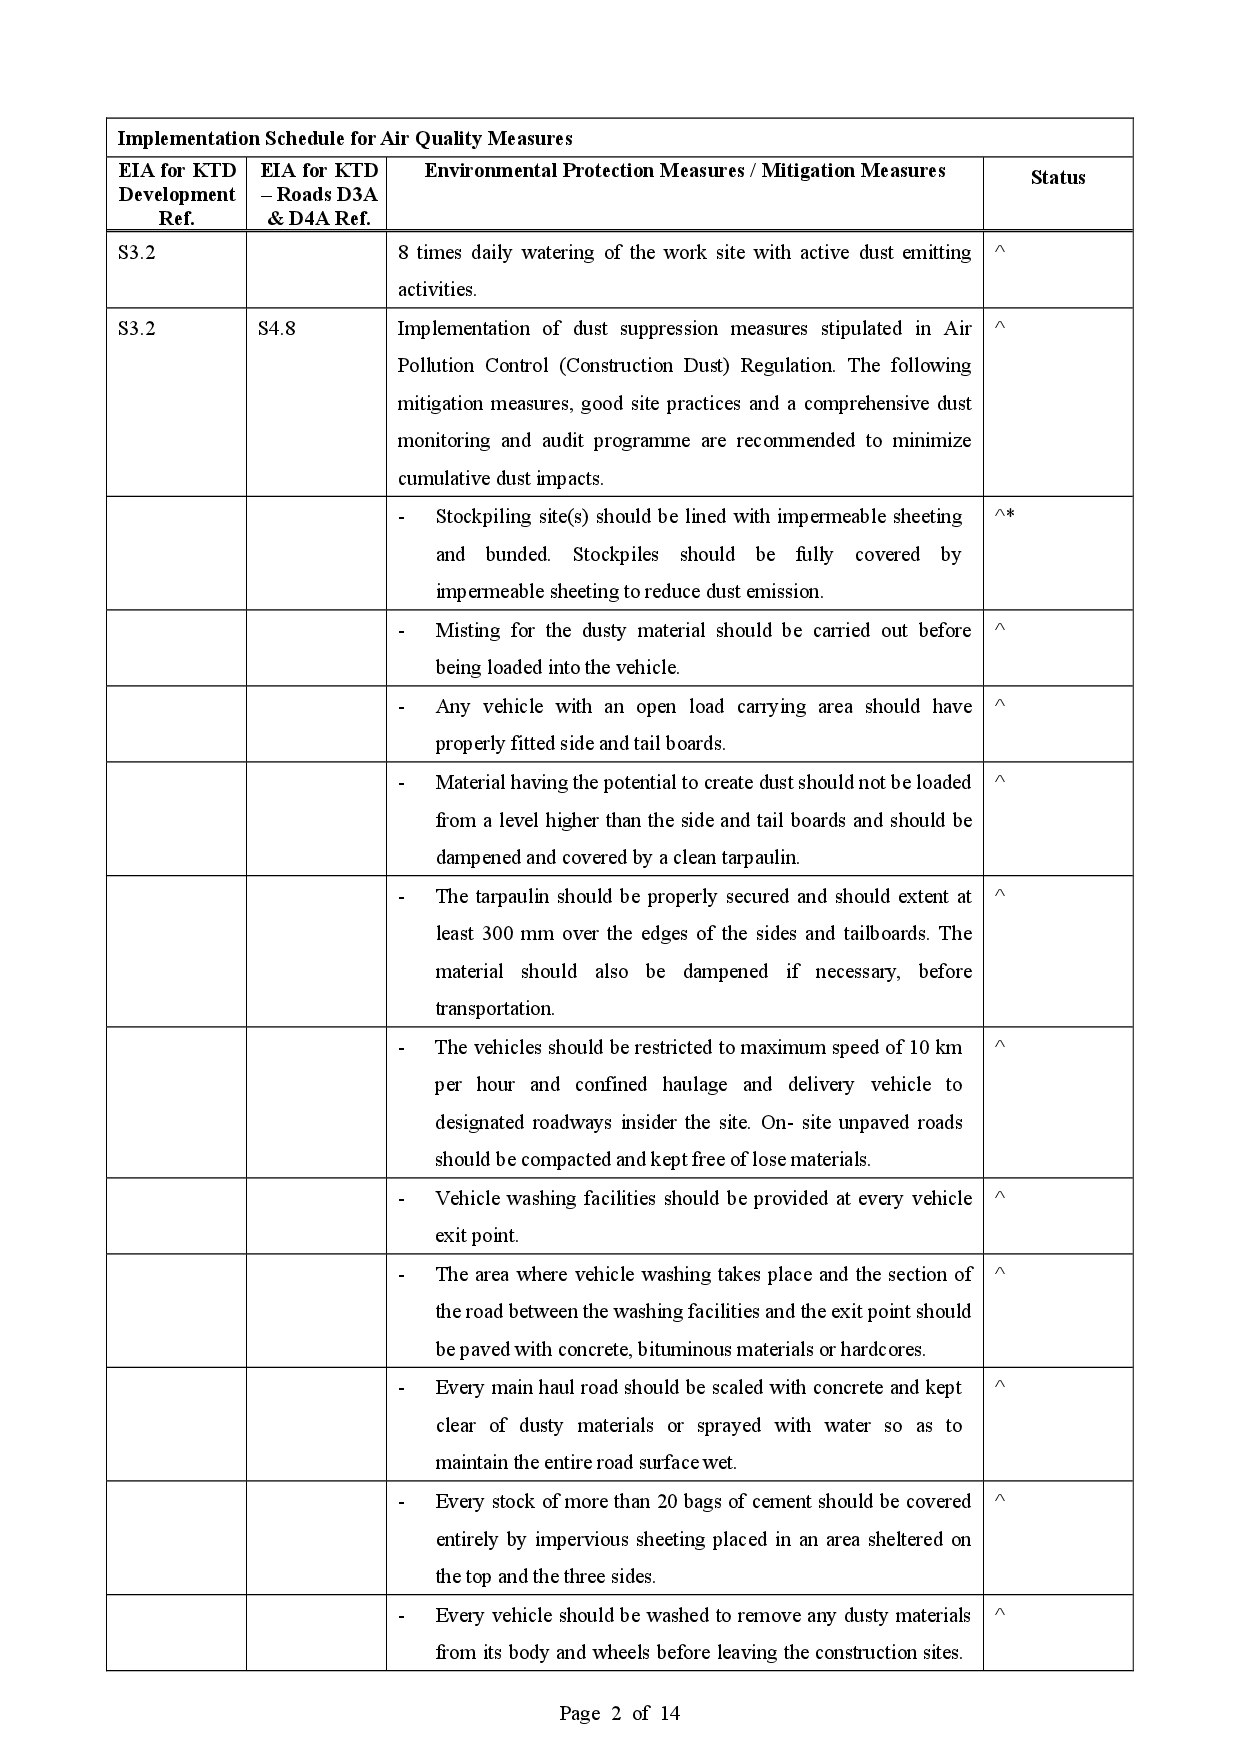
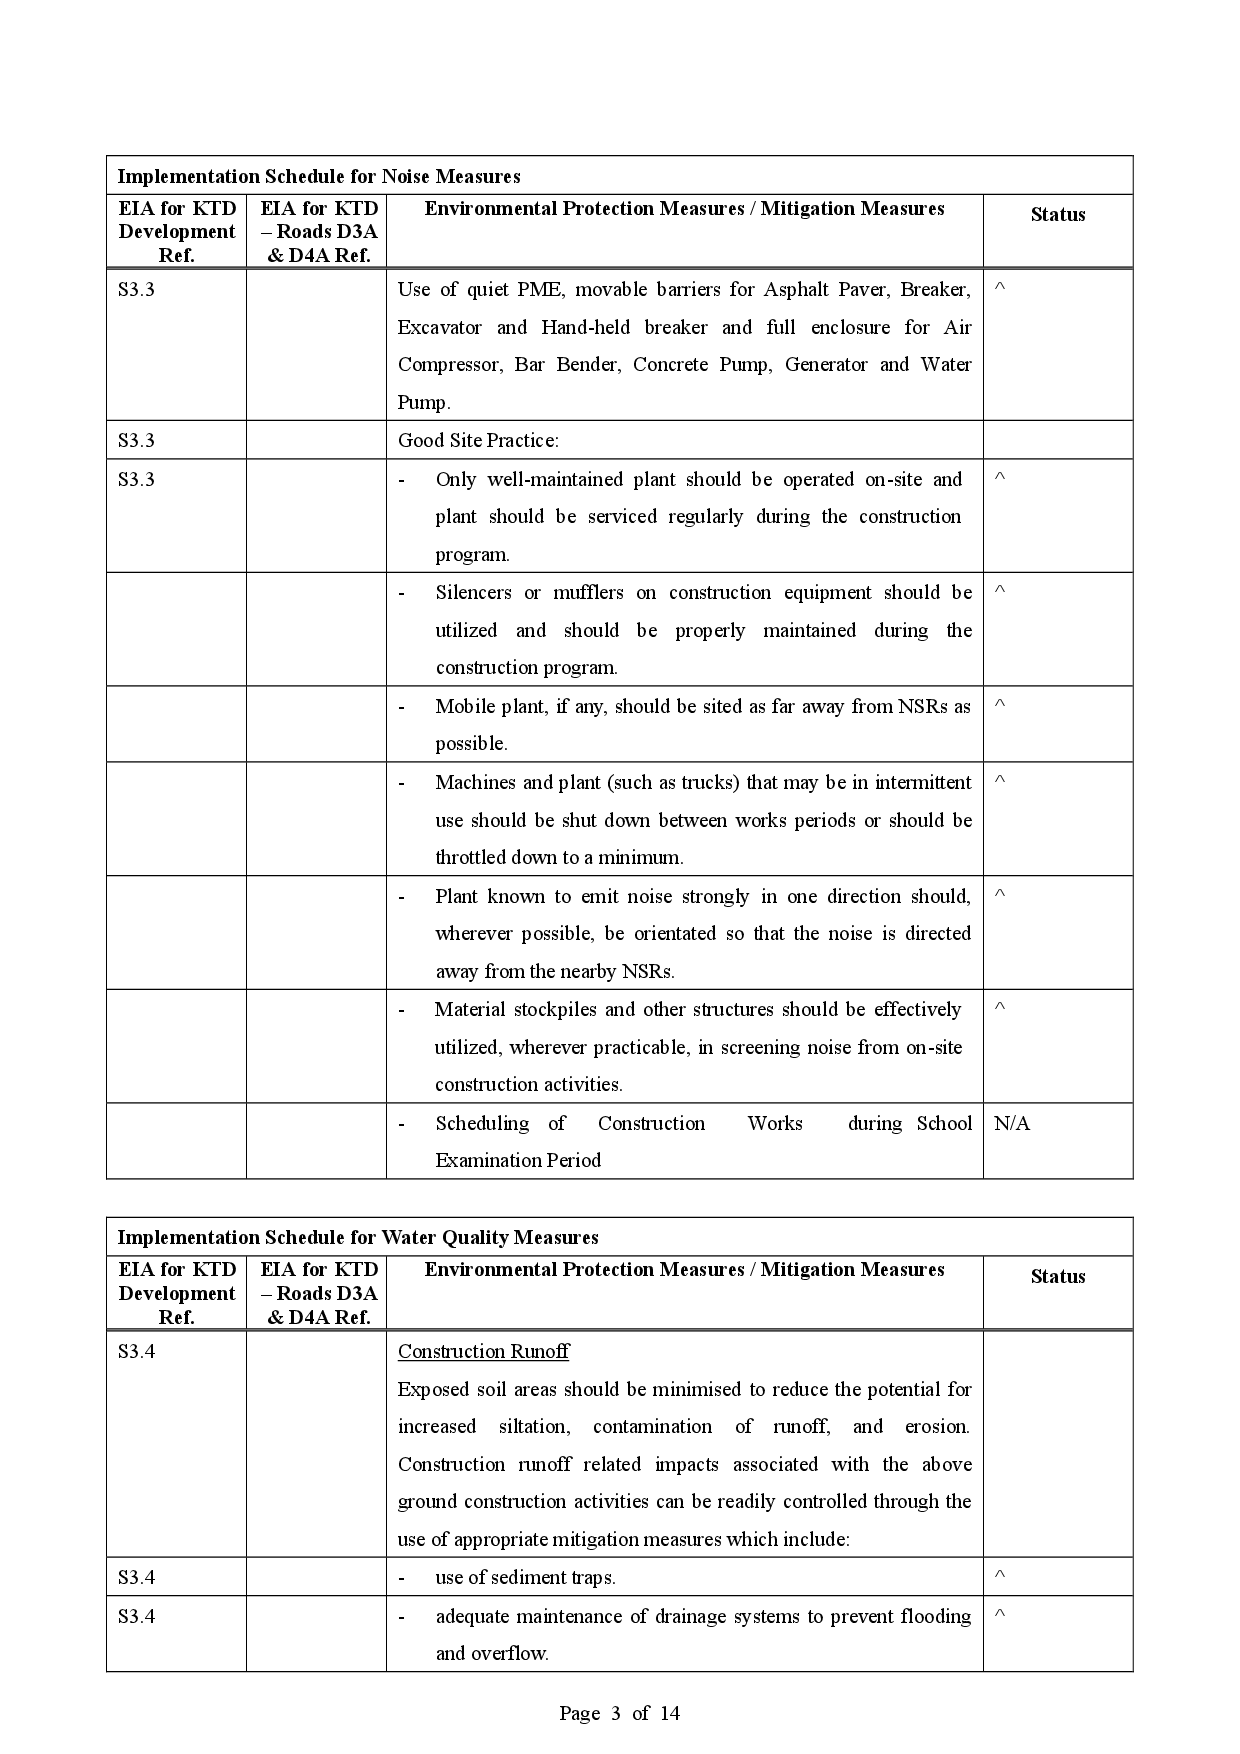
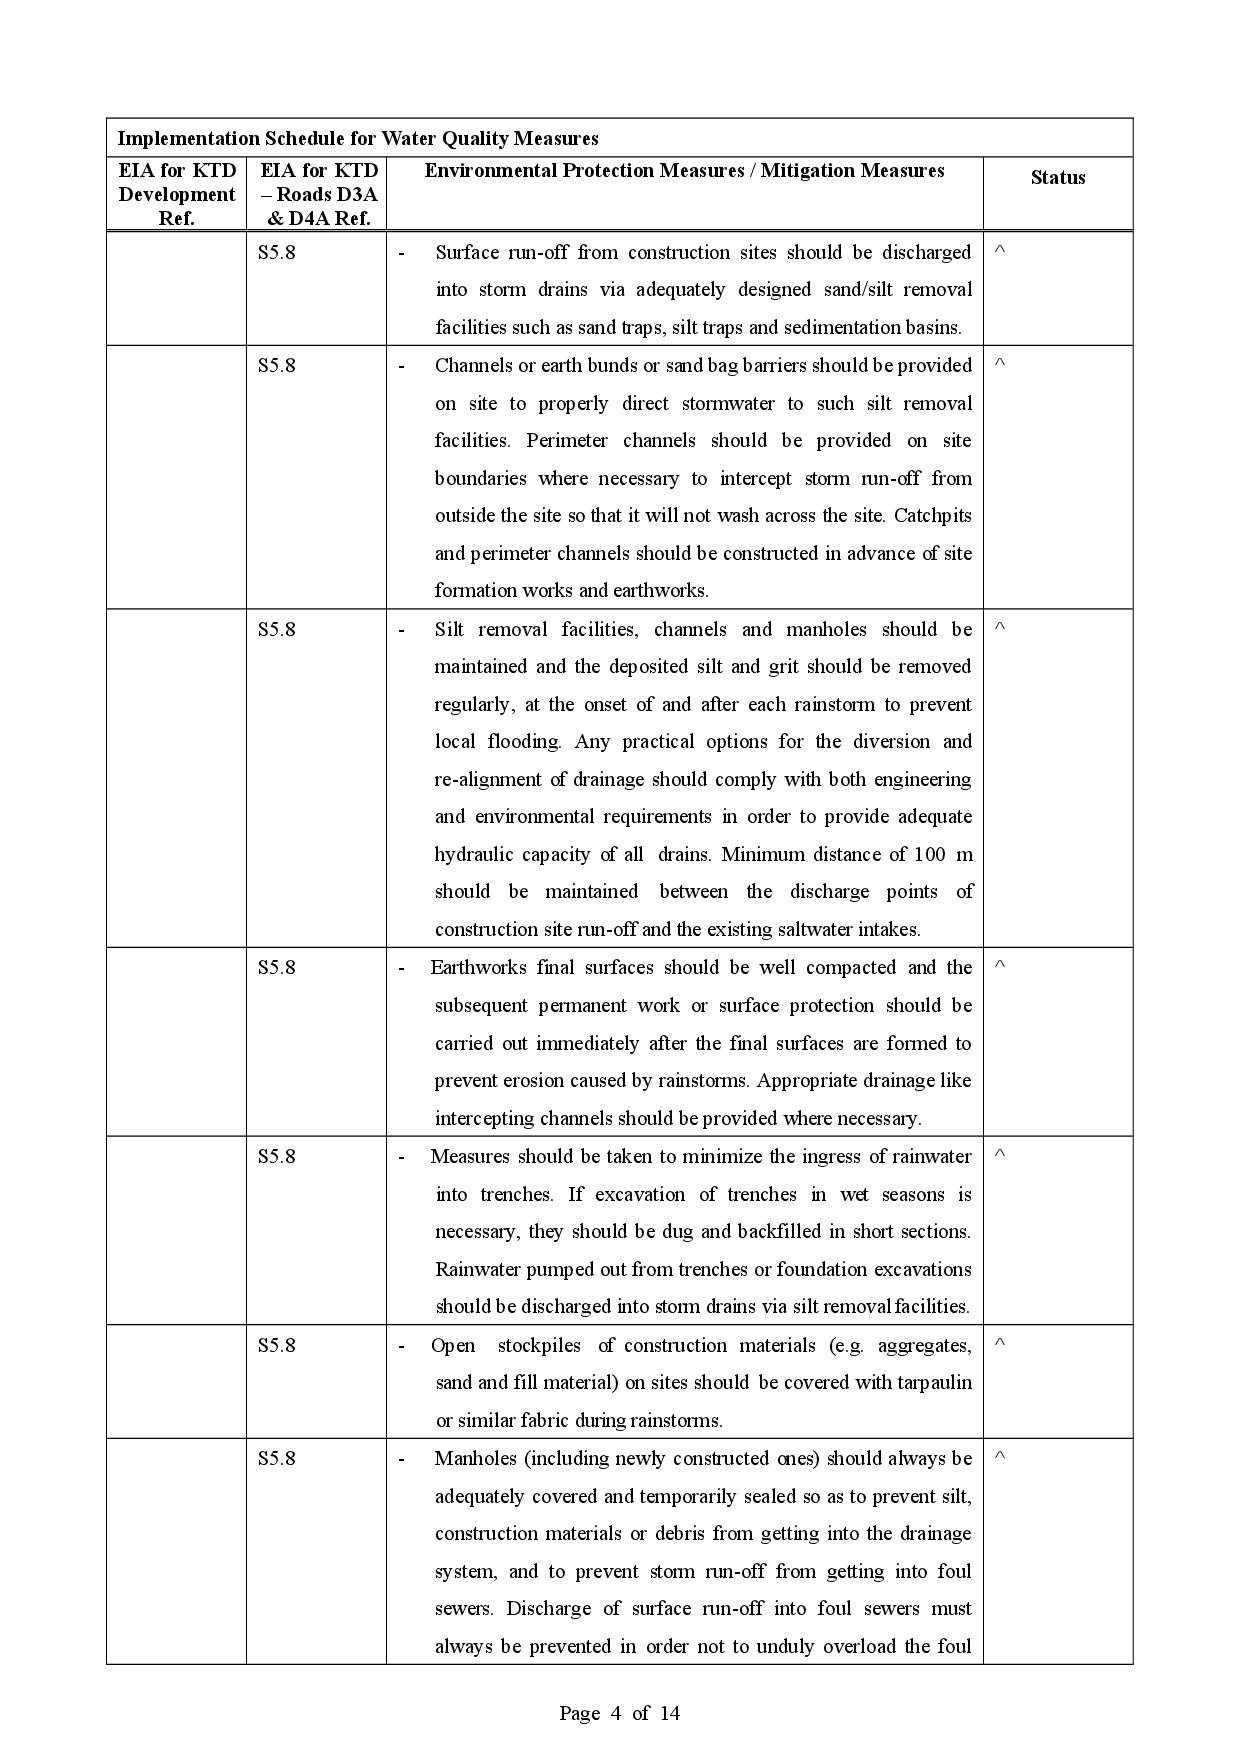
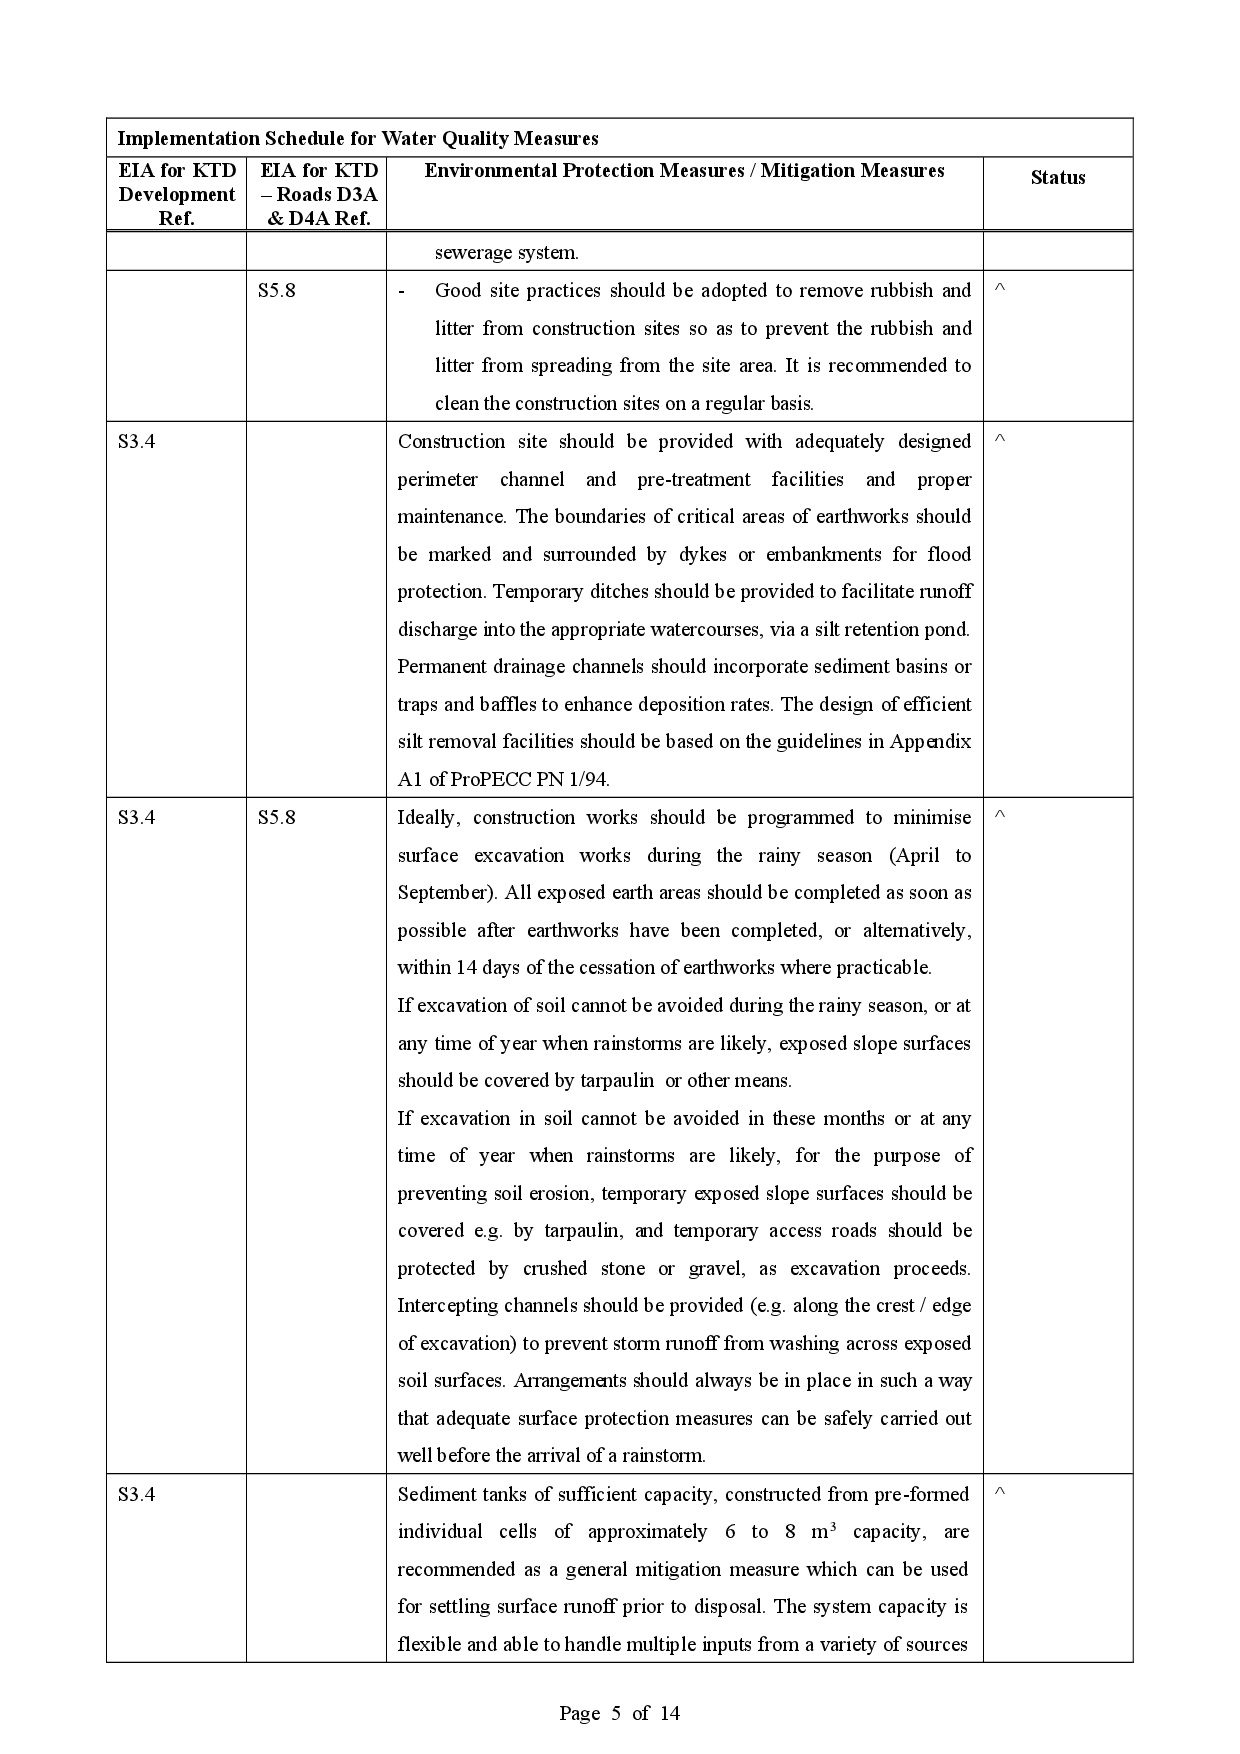
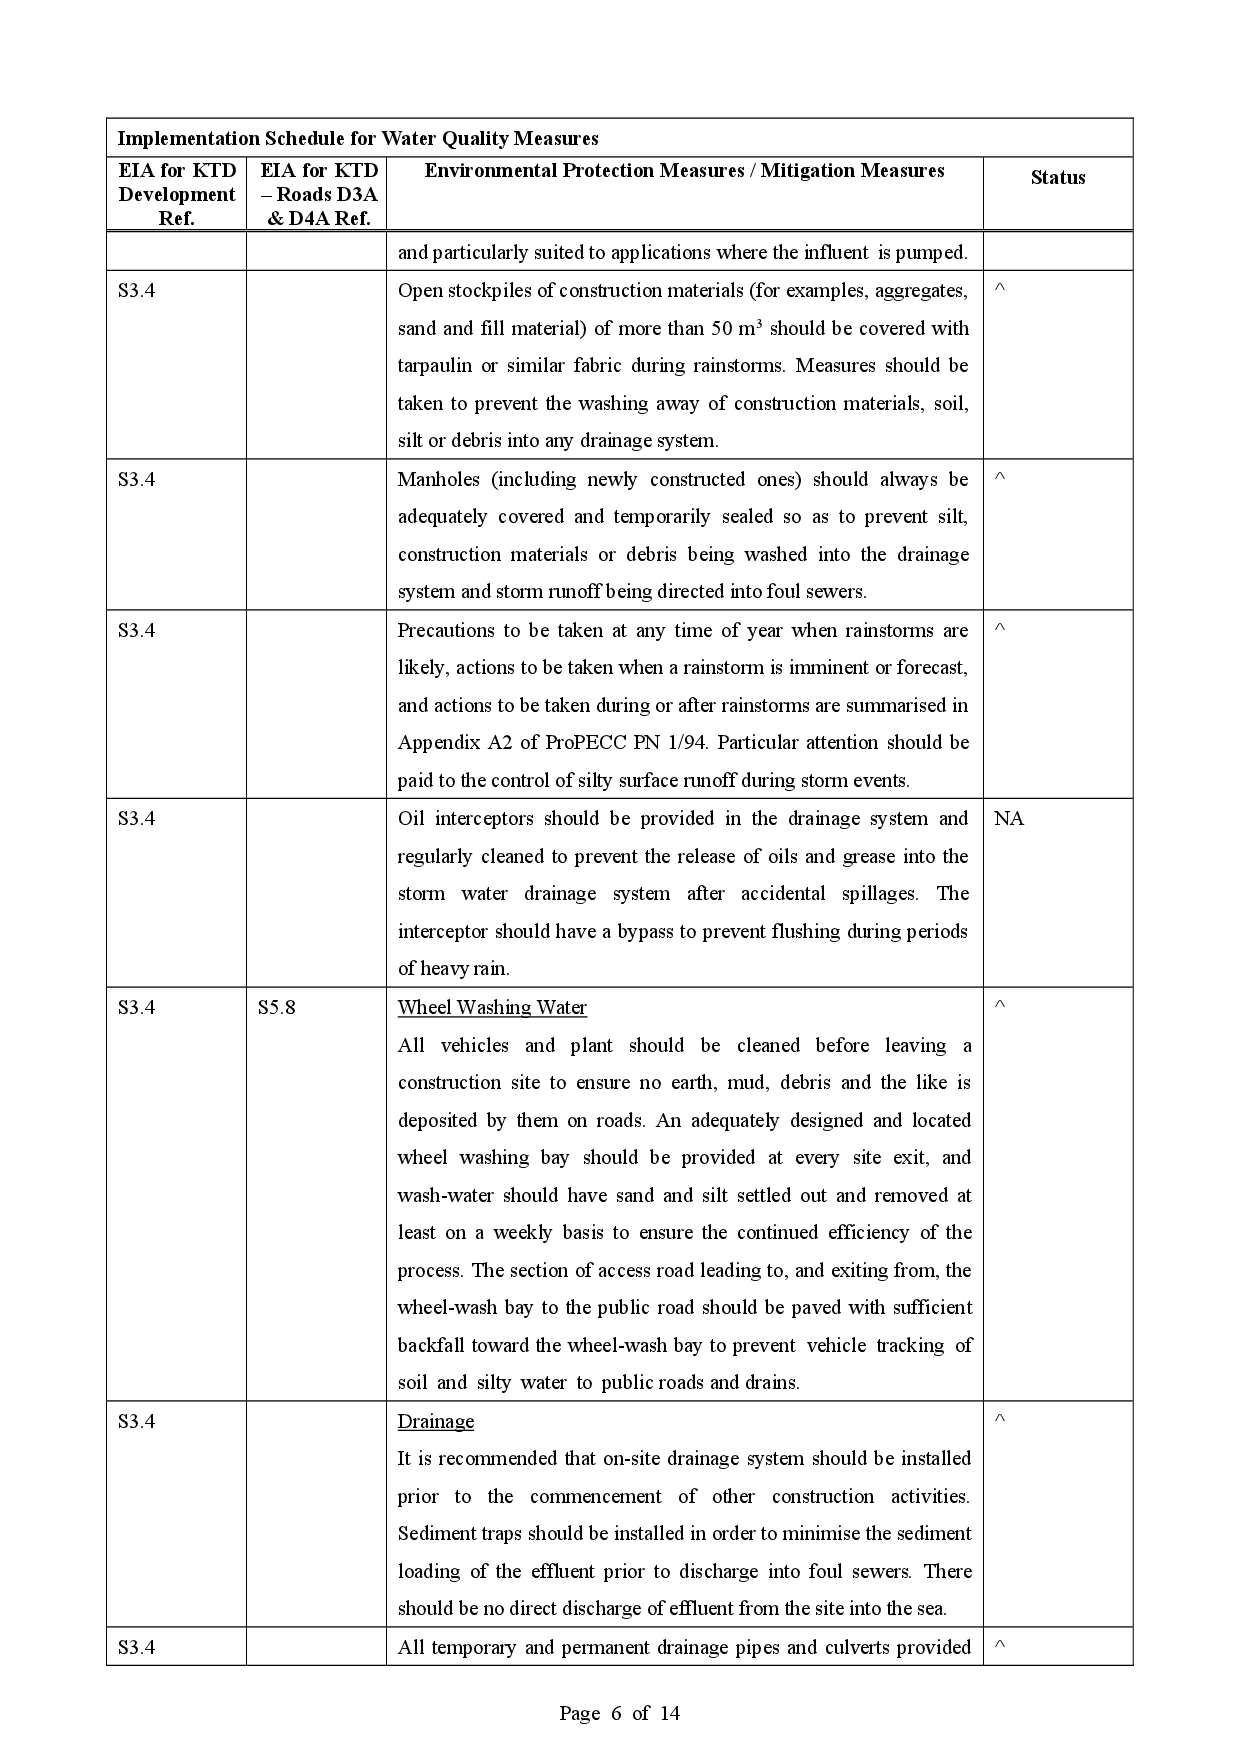
8 Apr 2021 |
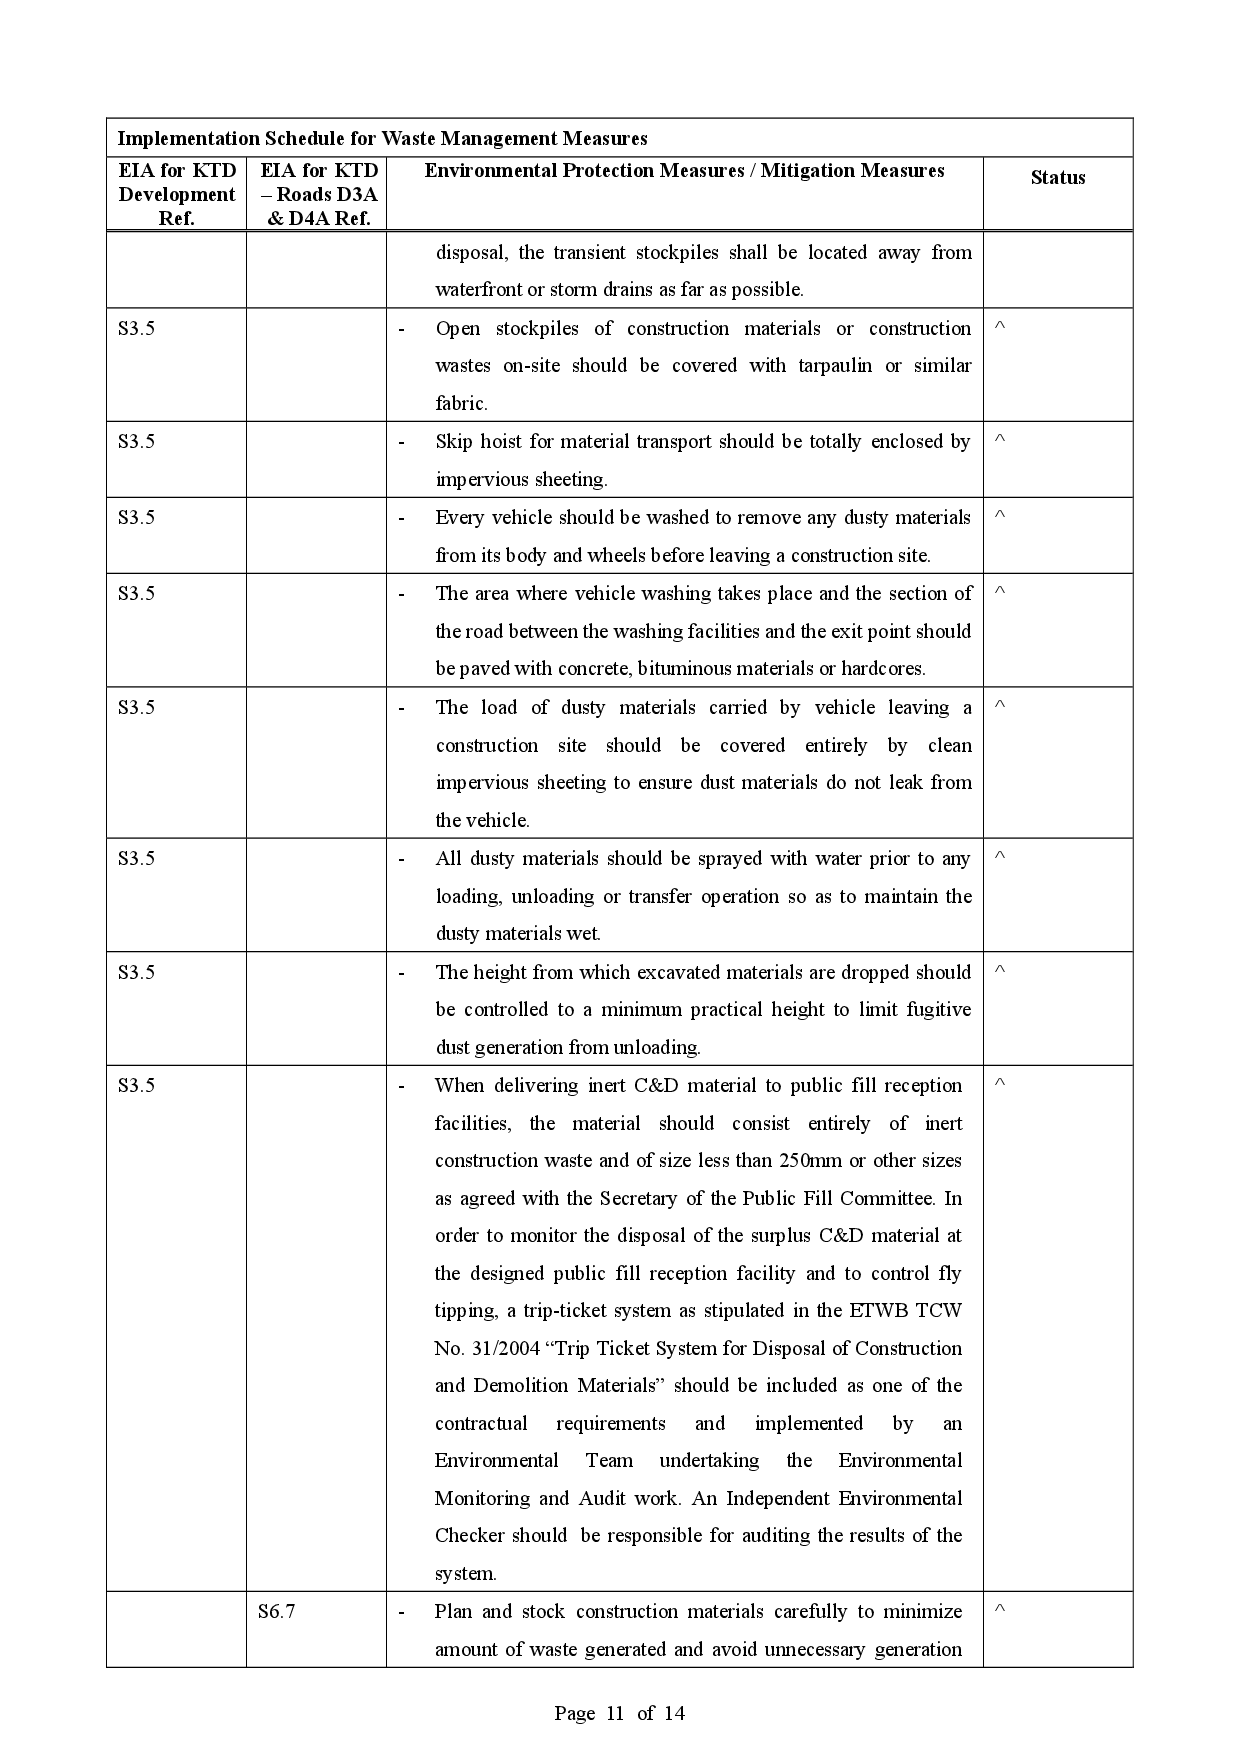
6.7 The Contractor has implemented environmental mitigation measures and requires as stated in the EIA reports, the EP and the EM&A Manuals. The implementation status of the mitigation measures during the reporting month is summarized in Appendix P.
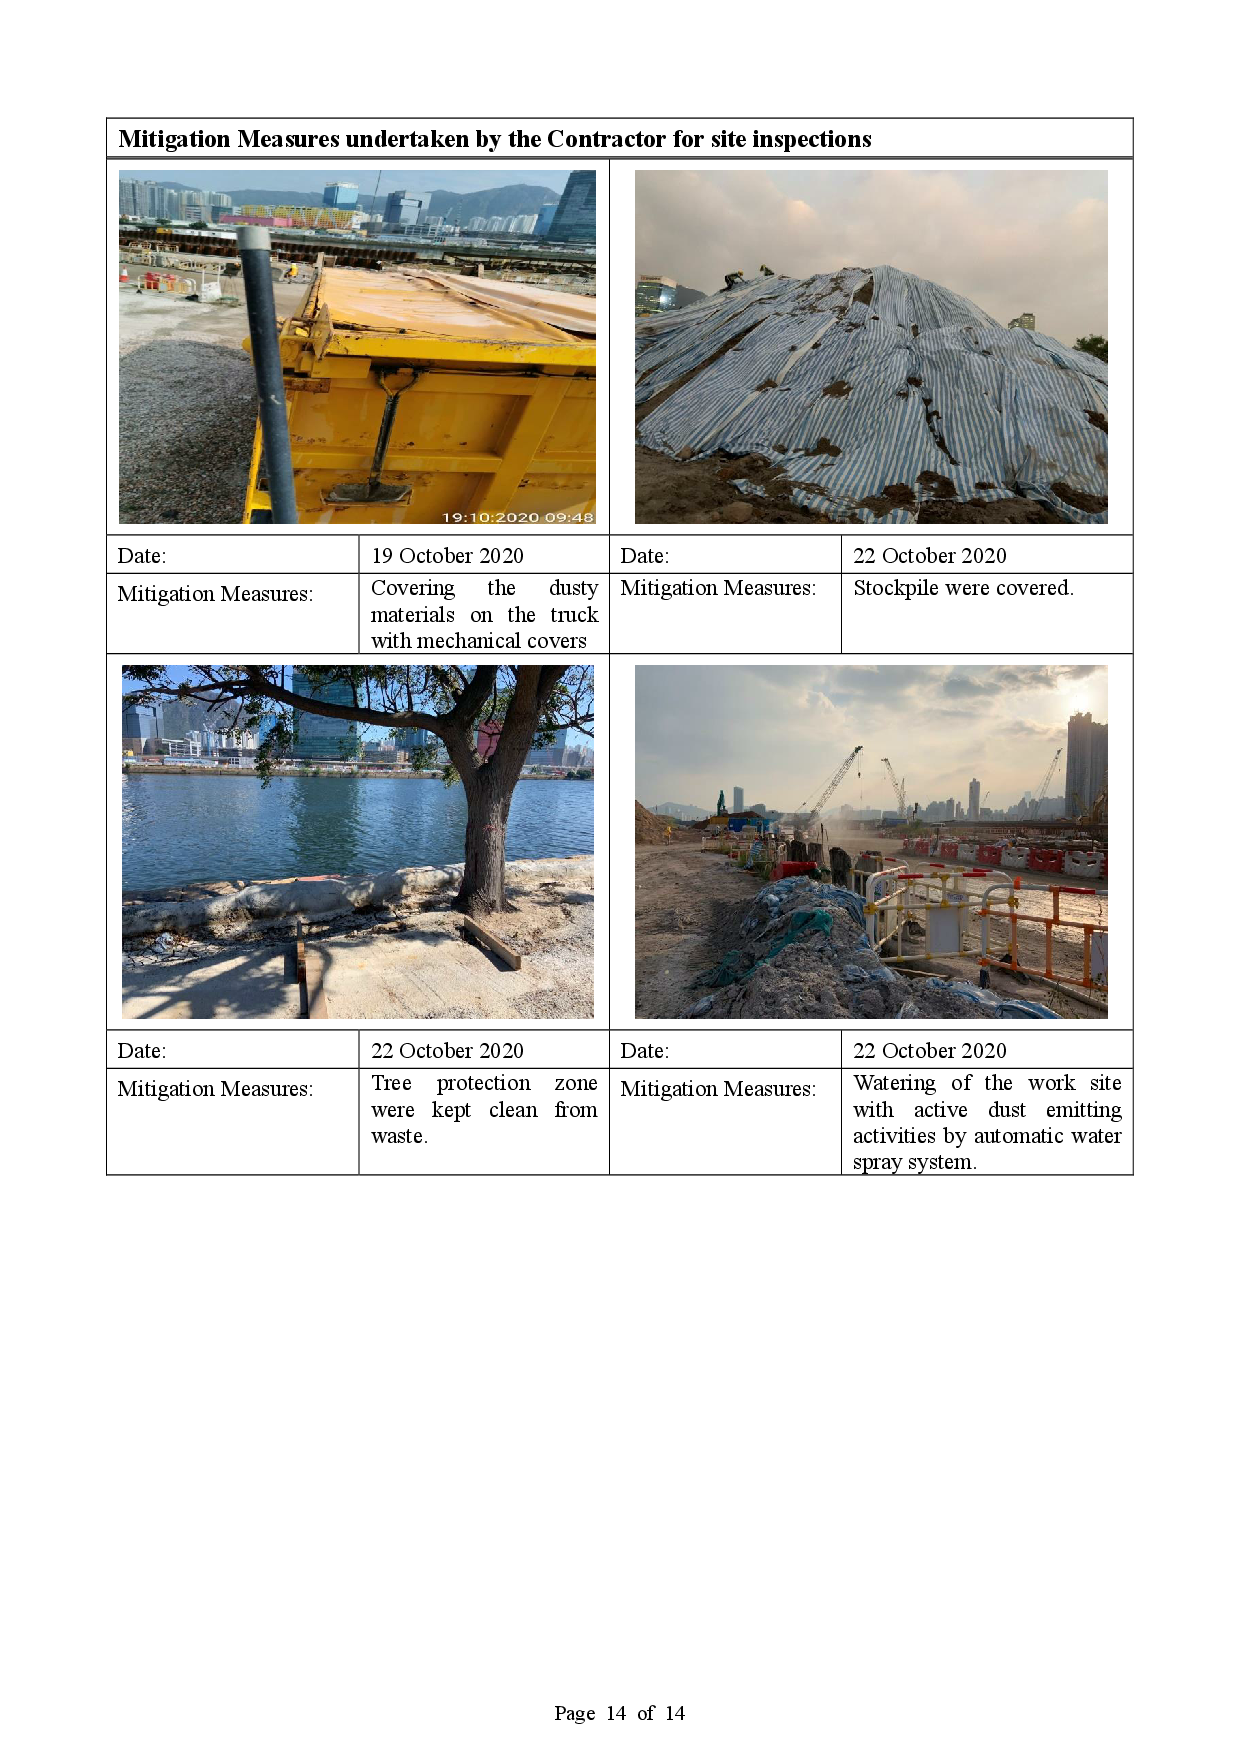
6.8 In response to the site audit findings, the Contractor carried out corrective actions with summary given in Appendix P.
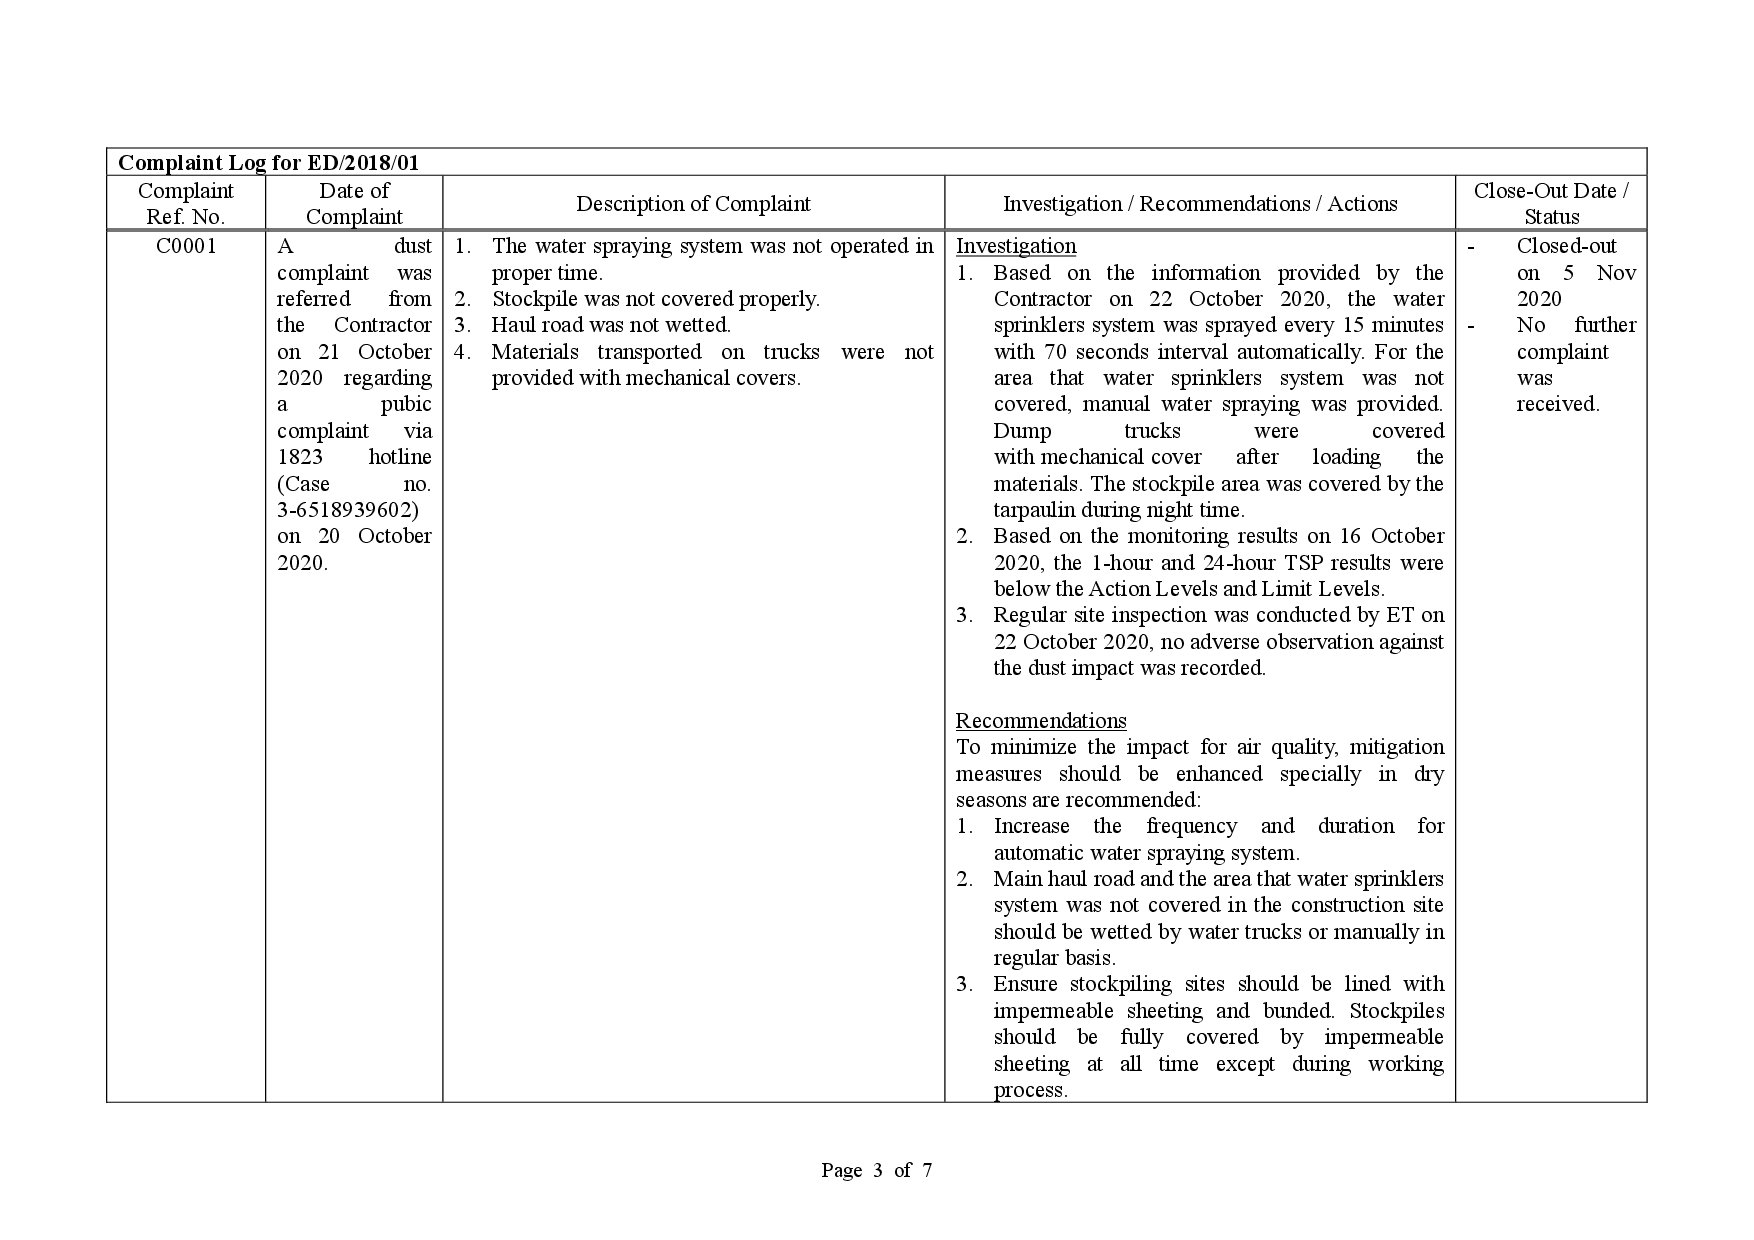
6.9 One complaint was received in the reporting month. Summary of complaints in the reporting month is tabulated in Table 6.3.
|
Date of complaint received |
Date of complaint |
Description of complaint |
Investigation / Recommendations / Action take |
Close-out date / Status |
|
A dust complaint was referred from the Contractor on 21 October 2020. |
Contractor received pubic complaint via 1823 hotline (Case no. 3-6518939602) on 20 October 2020. |
1. The water spraying system was not operated in proper time. 2. Stockpile was not covered properly. 3. Haul road was not wetted. 4. Materials transported on trucks were not provided with mechanical covers. |
Investigation 1. Based on the information provided by the Contractor on 22 October 2020, the water sprinklers system was sprayed every 15 minutes with 70 seconds interval automatically. For the area that water sprinklers system was not covered, manual water spraying was provided. Dump trucks were covered with mechanical cover after loading the materials. The stockpile area was covered by the tarpaulin during night time. 2. Based on the monitoring results on 16 October 2020, the 1-hour and 24-hour TSP results were below the Action Levels and Limit Levels. 3. Regular site inspection was conducted by ET on 22 October 2020, no adverse observation against the dust impact was recorded.
Recommendations To minimize the impact for air quality, mitigation measures should be enhanced specially in dry seasons are recommended: 1. Increase the frequency and duration for automatic water spraying system. 2. Main haul road and the area that water sprinklers system was not covered in the construction site should be wetted by water trucks or manually in regular basis. 3. Ensure stockpiling sites should be lined with impermeable sheeting and bunded. Stockpiles should be fully covered by impermeable sheeting at all time except during working process.
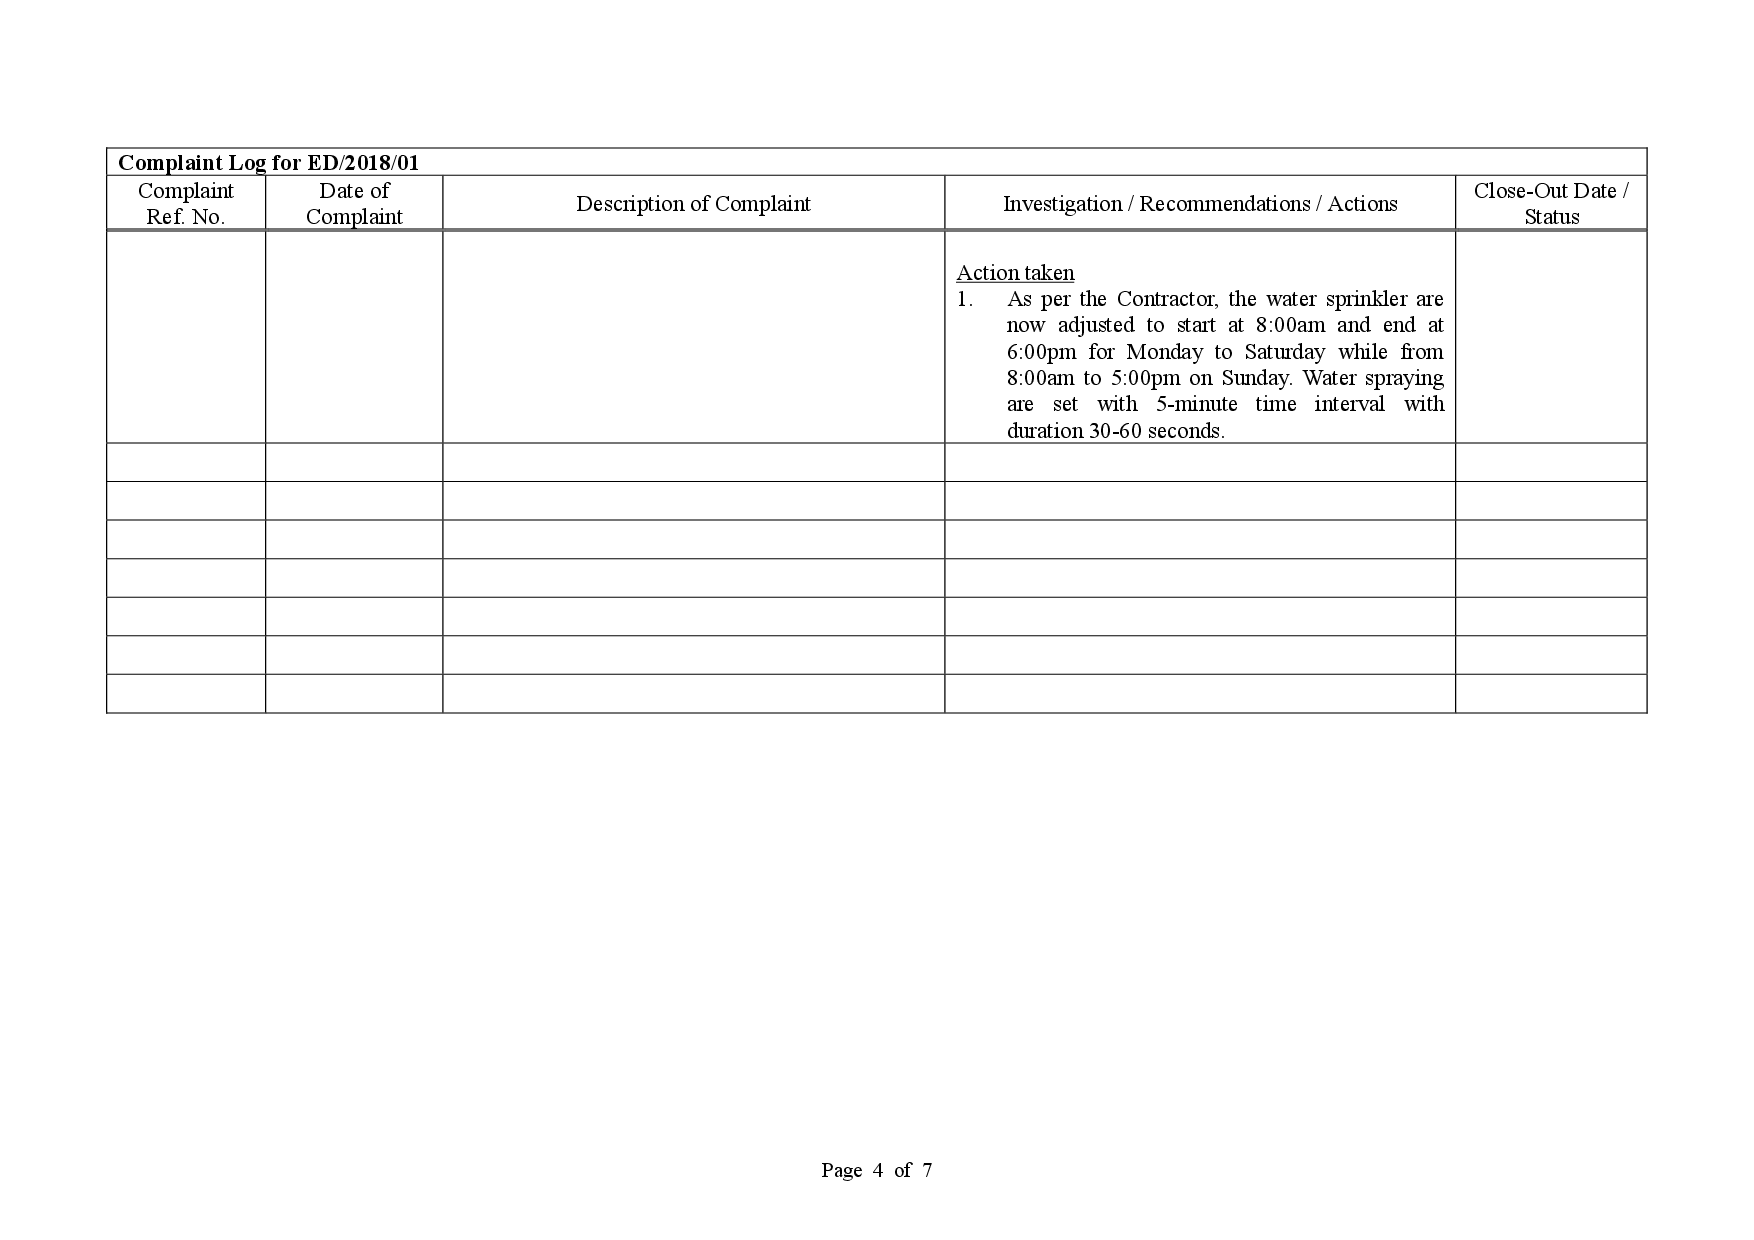
Action taken As per the Contractor, the water sprinkler are now adjusted to start at 8:00am and end at 6:00pm for Monday to Saturday while from 8:00am to 5:00pm on Sunday. Water spraying are set with 5-minute time interval with duration 30-60 seconds. |
- Closed-out on 5 Nov 2020 - No further complaint was received. |
6.10 Complaint log and Complaint Investigation report are shown in Appendix Q.
6.11 No notification of summons and successful prosecutions was received in the reporting month. Summary of summons and successful prosecutions in the reporting month is tabulated in Table 6.4.
|
Date of receiving notification of summons or prosecutions |
Date of event |
Description of event |
Action take |
Close-out date / Status |
|
No notification of summons and successful prosecutions were received in the reporting month. |
NA |
NA |
NA |
NA |
6.12 The summaries of cumulative environmental complaint, warning, summon and notification of successful prosecution for the Project is presented in Appendix Q.
7.1 The major construction activities and potential impacts in the next reporting month as follow:
|
Future key issues in the coming month |
Potential impact |
|
Installation of Sheet Pile |
Noise and Air Quality |
|
Pumping Test at North Depressed Road Cofferdam and South Depressed Road |
Noise |
|
Permanent Structure Construction for Pile Cap |
Noise and Air Quality |
|
ELS Installation & Excavation for South Depressed Road |
Noise and Air Quality |
|
Construction of base slab, walls and columns for North Approach Ramp |
Noise and Air Quality |
|
Permanent Structure Construction for North Depressed Road |
Noise and Air Quality |
|
Erection of Temporary Working Platform |
Noise and Air Quality |
7.2 The mitigation measures for environmental impact including Air Quality, Construction Noise, Water Quality, Chemical and Waste Management, Landscape and Visual shall be implemented:
- Sufficient watering of the works site with the active dust emitting activities,
- Limitation of the speed for vehicles on unpaved site roads,
- Properly cover the stockpiles,
- Good maintenance to the plant and equipment,
- Use of quieter plant and Quality Powered Mechanical Equipment (QPME),
- Provide movable noise barriers,
- Appropriate desilting/ sedimentation devices provided on site for treatment before discharge,
- Well maintain the drainage system to prevent the spillage of wastewater during heavy rainfall,
- Onsite waste sorting and implementation of trip ticket system,
- Good management and control on construction waste reduction,
- Erection of decorative screen hoarding,
- Strictly following the Environmental Permits and Licenses, and
- Provide sufficient mitigation measures as recommended in Approved EIA Reports.
7.3 The tentative schedule for weekly site inspection and air quality and noise monitoring in the next month is provided in Appendix C.
8.1 Environmental monitoring works were performed in the reporting month and all monitoring results were checked and reviewed.
8.2 1-hour TSP monitoring was conducted as scheduled in the reporting month. No Action/Limit Level exceedance was recorded.
8.3 24-hour TSP monitoring was conducted as scheduled in the reporting month. No Action/Limit Level exceedance was recorded.
8.4 Construction noise monitoring was conducted as scheduled in the reporting month. No Action/Limit Level exceedance was recorded.
8.5 One dust complaint (received by hotline 1823 on 20 October 2020) was referred by the Contractor in the reporting month and was closed-out on 5 November 2020. No further complaint was received.
8.6 No notification of summons and successful prosecutions was received in the reporting month.
Figure
|
|